Feb 2, 2016 - process control software tool and it is considered as the best choice by manufacturers. .... standard with complete graphical, user to drop or drag configurable reporting. .... on 6th April 2013 from http://zontec.wordpress.com/.
International Journal of Engineering and Technology Volume 6 No. 2, February, 2016
An Investigation into the Various Statistical Process Control Tools Vipul Vashisht, Socis, Ignou New Delhi
ABSTRACT In today’s competitive world, predicting the process variation and data based decision making is the key to successful project execution and delivery. Statistical Process Control (SPC) has become an integral component in software development process for the past few years. SPC tools are used for analytical decision making tool enabling the organization to measure whether the quality of the process is up to expected standards. This paper describes about some of the software tools and their capabilities that are used for applying SPC techniques Keywords: Statistical Process Control (SPC), SPC tools, SPC techniques
I.
INTRODUCTION TO STATISTICAL PROCESS CONTROL
Statistical Process Control acts as an important component in SEI’s (Software Engineering Institute's) maturity models. SPC is a powerful tool in order to improve the processes that enhance productivity and quality (Florac, 1999; Montgomery, 1985; Humphrey, 1989). Florac (1999) mentioned that Statistical Process Control is one of the methods of process management through the statistical analysis and includes measuring, improving, defining, and controlling the processes. Identification of quantitative mechanisms for process improvements made organizations give rise to the statistical process control application since 1930s (Sutherland, Devor and Chang, 1992). The concept of applying statistical process control to software development was mainly brought by the concept of CMM (Capability Maturity Model) in mid 90s. Generally, benefits of SPC are mostly accepted for the manufacturing companies and for the last few decades its application has entered into the software development process (Card, 1994 Typical activities in statistical process control may include:
Identifying the ‘out of control’ situations with the help of control limit Identifying the unstable patterns that are associated with the control charts Analyzing the cause for identified ‘out of control’ situations, and Stabilizing entire process by the removing identified special causes.
The critical decisions in Software development processes like when to ship the code or when to stop the shipment are taken based on inputs received from quantitative techniques like SPC. SPC tools helps to identify whether the process is under control or not. The control limits from past projects data is used to evaluate whether the process is stable. Similarly specification limits provided by customer is used to evaluable
whether the process is capable or not.
II.
NEED FOR APPLYING STATISTICAL PROCESS CONTROL IN SOFTWARE DEVELOPMENT PROCESS The importance of applying statistical process control (SPC) in the field of software industry has been growing for the past few decades. SPC tools are helpful for organizations following through maturity levels of process improvement models as CMMI (i.e. Capability Maturity Model Implementation). The CMMI model is used in many software companies to implement SPC as a significant step for accomplishing higher levels of maturity processes. The CMMI model has processes which make use of SPC techniques like control charts for the project level process control and organizational levels processes for the improvement purposes. Many researchers have discussed about the need for using the techniques of statistical process control in the software industry. Humphrey (1989) explained about the framework for software development process and highlighted various activities that were used in higher level of maturity processes which stands as a basic guide to develop the processes in the software organizations. In addition to these, Humphrey further pointed out that useful measures must be robust, reliable and also associated with certain product and processes. In addition to that, Humphrey has given four significant points for applying SPC in software development processes:
Metrics should integrate with the software quality characteristics of software products that are defined by the customer. Statistical Process Control must be applied in significant processes. These processes help to produce desired software product. The metrics should be chosen for all activities to produce tangible items.
ISSN: 2049-3444 © 2016 – IJET Publications UK. All rights reserved.
56
International Journal of Engineering and Technology (IJET) – Volume 6 No. 2, February, 2016 Kan (1995) described about the information regarding software reliability models, software metrics and analysis of program complexity. Kan mainly emphasized about the complexity in accomplishing capability of software domain and the usage of control charts in order to improve the software organization. The SPC specifically act as a supplementary tool in quality engineering models like defect and reliability models.
III.
at the granular level. WinSPC software tool involves some special features in the real time process (WinSPC, 2013). These are as follows: To increase manufacturing profitability: Real time SPC (statistical process control) software permits manufacturers to increase entire responsibility, proficiency and results as a cheaper rate of quality.
OVERVIEW OF SPC TOOLS
There are numerous tools readily available in the market which supports the application of statistical process control (SPC) in software development process. This research discusses about few most frequently applied software tools such as WinSPC, Zontec, XLSTAT,SCADA and Minitab. These software tools are described in the following section: a) WinSPC: In order to compete with today’s global economy WinSPC provides real time statistical process software (SPC) to ensure quality of products delivered to end customers. The following figure illustrates the architecture of WinSPC
To develop the quality of products and processes: WinSPC provides power to avoid process errors which lead to several defects and permit the user to constantly deliver a high quality of products without any fail. To reduce scrap, waste and rework: This real time software tool permits team members to reduce unwanted cost variation, scrap, few amount of waste products and rework. Reduce variation: WinSPC helps to deliver instant, valuable and actionable information to personnel but also permitting the manufacturers to find out defects, then correct and reduce process variation in a real time. To improve customer satisfaction: The real time process control software permits the user to make sure a constant, high quality of products, reduce warranty repairs and rapidly deliver complete reports to the customers. To meet regulatory requirements: This software tool enables ability of audit which depends on control process and it may contain FDA 21 CFR 11 compliant and also it is useful for cost effectiveness needs in ISO, FDA and USDA requirements. WinSPC tool provides a high level of real time SPC proficiency compared to any other process control software products. b) Zontec: Zontec is a globally accepted SPC software tool that has raised the industry standard based on the cloud computing technology in software organization (Zontec, 2013). The following figure illustrates the architecture of the product Synergy 3000, one of the latest ventures of Zontec:
Figure 1: WinSPC architecture Source: WinSPCServer, 2013
WinSPC offers a lean way for organizations by helping them to increase the quality of products at lower rate. WinSPC provides three significant benefits to the manufactures such as:
Rapidly improve quality Reduce cost variation and Maximize good profitability. This software tool runs in a real time process on the shop floor and delivers the process information to shop floor operators, engineers, supervisors and managers, etc. It acts as a real time process control software tool and it is considered as the best choice by manufacturers. The same tool can also be used in the software organization since this provides real time SPC insight
Figure 2: Architecture of Synergy3000 Source: (Synergy3000, 2010)
ISSN: 2049-3444 © 2016 – IJET Publications UK. All rights reserved.
57
International Journal of Engineering and Technology (IJET) – Volume 6 No. 2, February, 2016 Synergy3000 is a software product that was launched in the year 2010 with cloud computing technology support. This software has been design in order to enable the users to collect, process and report on data sets that is available on the internet for performing real time statistical process control, This software can be considered as a complete quality collaboration tool in the cloud environment that satisfies the quality needs of any business,, Synergy 3000 enables any authorized user from anywhere across the globe to perform the following operations (Synergy3000, 2010):
Gather data/information Monitor the status of a process Forecast adverse events Troubleshoot or manage critical processes Trace and track Prevent problems from penetrating through the next link in a process Exchange or share information with other users Enable sound decision making process by offering reliable and accurate quality reports in a secured cloud based environment
Further Synergy3000 through its cloud computing environment allows customers for using software tools such as scoreboard report card, automated certificate of analysis, and
cost of analysis report to view the data from the supply chain in order to produce strategic and business intelligence decisions. The services of Synergy3000 take place through a “private cloud” that is maintained and established by an organization’s own IT resources. This software tool uses SQL database to support complete supply chain tool. The statistical process control (SPC) report generated by Synergy3000 offers an immediate, worldwide view to minimize scrap, rework and analyze user personnel performance, processes, production equipment and more suppliers globally. Real time data promotes immediate feedback to the manufacturer team to avoid from defects before it occurs and the customers to validate their specifications. Synergy3000 also permits management to analyze an endure profitability of the business. c)
Xlstat SPC:
It is based on Microsoft Excel (MS – Excel) and also provides a powerful statistical analysis software solution useful for SPC (statistical Process Control) to improve software organization (Xlstat, 2013). The following figure shows the architecture of Xlstat statistical process control software:
Figure 3: Architecture of XlStat Source: (XlstatArch, 2013)
XLStat was developed by Addinsoft in the year 1993, with an intention of enhancing the analytical capabilities of Microsoft Excel. XLStat is an add-in for Microsoft Excel. It is statistical software build over XlStat-Pro, the product of Addinsoft. This software tool offers additional module which is useful for software companies in applying six sigma methods to control activities and enhance the quality of production or sales processes in the specific method. XLSTAT SPC tool provides a way by using an analytical control charts and MSA (Measurement System Analysis) namely Gage Reproducibility
and repeatability depends on both the quantitative and qualitative data are used to identify all kinds of deviation processes. Subgroup chart in XLSTAT focuses on the characteristics of quality measurement into a subgroup. It facilitates to supervise and manage such quality of production, re-iterate the mean value and the variability of the measured quality of products. d) CEBOS
ISSN: 2049-3444 © 2016 – IJET Publications UK. All rights reserved.
58
International Journal of Engineering and Technology (IJET) – Volume 6 No. 2, February, 2016 CEBOS is a software tool that controls the functionality to meet enduring quality system requirements when data sharing automatically to the entire quality of the business system (QAD, 2013). It is also known as Quality Management Software (MQ1) that permits users to get involved in their business process requirements to make sure the end users meet universally recognized compliance requirements like FDA and ISO requirements for certain customers. Functionality is standard with complete graphical, user to drop or drag configurable reporting. Additionally, this software provides a wide range of implementation and maintains services in every deployment to satisfy needs of the customer’s highest expectation.
Technology systems, is one of the most noteworthy aspects of this software (SCADA, 2004). Supervisory Control and Data Acquisition has evolved to network based architecture from a monolithic architecture. SCADA is a centralized system that is used in order to monitor and control complete sites over large areas. The following is the image of a typical SCADA system.
Figure 5: SCADA system architecture Source: Thomas, et al, 2003
Figure 4: Enterprise Quality Management Software of CEBOS Source: QAD (2013): CEBOS Enterprise Quality Management Software, retrieved on 28th March 2013 from http://www.qad.com/erp/Solutions/Manufacturing/Cebos+MQ1+Qu ality+Management+System
Usage of CEBOS in Enterprise Applications:
e)
Several control actions are carried out in an industrial control system by applying PLC (Programmable Logic Controller) or RTCs (Remote Terminal Units). This tool can be typically implemented as a distributed database and generally termed as a tag database. It includes data elements known as points or tags. A point indicates a single input or output value that is controlled or monitored through the system. It is mostly used in national infrastructures like water supplies, pipelines and electric grids. SCADA systems may have security vulnerabilities and it is essential to evaluate the systems in order to find risks and solutions which cause those risks. f)
It supports compliance with ISO, FDA, and TS16949 and AS 9100. Quality Management (MQ1) contains a modular design for allowing customers to implement their components to meet in quality objectives. Integrated capability promotes seamless real time information visible across the enterprise from functions to the executive software system. CEBOS also supports for documentation control, complaints (CAPA or NCR), inspection of statistical process control (SPC), non-conformance management, APQP or PPAP, audit management, training tracking and so on. SCADA
SCADA stands for Supervisory Control and Data Acquisition. It is another kind of SPC software tool used in industrial control system (ICS). SCADA is used in monitoring critical infrastructure systems and forecasting disastrous situations in advance. The potential to evolve with ever changing face of technology, which is at present referred to as IT or Information
MINITAB
Minitab is the most popular tool among the metrics and SEPG teams across organizations. Irrespective of domain, manufacturing or IT industry, this tool is handy for all sorts of organizations that use data to arrive on analysis resulting in informed decision making. Minitab provides insight into multiple statistical analyses, like DOE, regression, ANOVA, quality tools, and time series. Built-in graphs generation capability enables managers to visualize data and validation of results. ( Minitab, 2014) Minitab can easily plot data points on a control charts where unusual patterns among data points indicates the presence of special cause of variation in the process. These charts can assess process stability over time. Further, process capability can also be analyzed by identifying the data points lying within the specification limits This SPC tool further supports display and store statistics and diagnostic measures. The tool is one of most frequently used tool for Six Sigma process improvement initiative deployments in the organizations.
ISSN: 2049-3444 © 2016 – IJET Publications UK. All rights reserved.
59
International Journal of Engineering and Technology (IJET) – Volume 6 No. 2, February, 2016
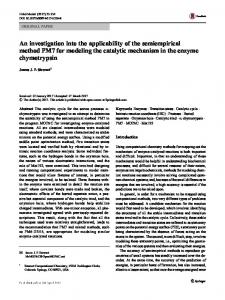
Figure 8: Sample C-chart used for monitoring Code review defects data
Figure 6: Sample Capability Analysis using Minitab (Page -39, Minitab17_GettingStarted-en, www.minitab.com/en-us/support/documentation/)
g) R LANGUAGE FOR STATISTICAL COMPUTING R language and environment is available as free open source software and has become popular among statistical computing community. It is implementation of S language and environment which was developed earlier at Bell labs. R can be extended through packages, which allow specialized statistical techniques, graphical devices, import/export capabilities, reporting. It has found usage in various statistical and graphical techniques like linear and non linear modeling, time series analysis. [17] [18]. R package system allows the use of real datasets and vignettes to demonstrate statistical analyses and has been widely used in graphics modeling by researchers [19].
IV.
IN HOUSE TOOLS
Many matured organizations have invested in dedicated teams for Metrics and in-house Tools development. Their main objective is to develop and maintain their own tools for process monitoring. Control chart is a statistical tool used to distinguish between process variation resulting from common causes and variation resulting from special causes. In such cases, the historical limits of the process are fed inside the tools and then process variation with respect to control limits is monitored and analyzed. These tools do help in providing insight to certain extent with respect to process control but lack functionalities and depth as compared to other SPC tools available off the shelf in the market.
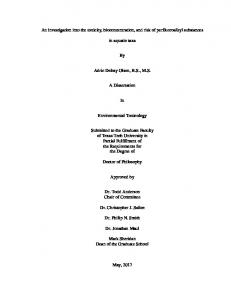
Figure 9: Sample U chart used for monitoring Defect Density
V.
CONCLUSION
It is concluded that SPC (statistical process control) helps the organization to monitor the process behavior. The application of statistical process control tools and techniques to the software development processes has been a challenging task for researchers and software engineers in the past. Unlike, manufacturing sector, it is very difficult to characterize a software product. Since software products are not concrete, identifying the correlation between a particular software process and the quality of the corresponding software product is very difficult. Further there is not any particular measure portraying the extent to which the requirements of a customer are met in case of a software product. However, with the advent of It is concluded that SPC (statistical process control) helps the organization to monitor the process behavior. The application of statistical process control tools and techniques to the software development processes has been a challenging task for researchers and software engineers in the past. Unlike, manufacturing sector, it is very difficult to characterize a software product. Since software products are not concrete, identifying the correlation between a particular software process and the quality of the corresponding software product is very difficult. Further there is not any particular measure portraying the extent to which the requirements of a customer are met in case of a software product. However, with the advent of numerous software tools, application of SPC to software process in no more a nightmare, many software tools are now available for applying the SPC in software development process. It is, however, up to the organization to choose the appropriate tool that suit bests to its needs in order to have the most effective output.
REFERENCES Figure 7: Sample XmR charts used for monitoring Code Review Efficiency
[1] Fenton, N.E., Pfleeger, S.L., (1997): Software Metrics. PWS Publishing Company, 1997, ISBN 0-53495425-1. [2] Humphrey, W., (1989): Managing the Software Process. Reading, Mass.: AddisonWesley Publishing Company, 1989. ISBN 0-201-18095-2
ISSN: 2049-3444 © 2016 – IJET Publications UK. All rights reserved.
60
International Journal of Engineering and Technology (IJET) – Volume 6 No. 2, February, 2016
[3] Kan, S. H., (1995): Metrics and Models in Software Quality Engineering. AddisonWesley Publishing Company, 1995. ISBN 0-201-63339-6. [4] Card, D., (1994): “Statistical Process Control for Software?” IEEE Software, May 1994, PP 95-97. [5] Sutherland, J., Devor, R., Chang, T., (1992): Statistical Quality Design and Control, Prentice Hall Publishing Company, 1992. ISBN: 002329180X. [6] Florac W. A, (1999): Carleton A. D., “Measuring the Software Process,” Addison-Wesley, 1999. [7] Montgomery D.C., (1985): “Introduction to Statistical Quality Control,” John Wiley & Sons Inc. 1985. [8] Humphrey W.,(1989): “Managing the Software Process,” AddisonWesley, 1989 [9] QAD (2013): CEBOS Enterprise Quality Management Software, retrieved on 28th March 2013 from http://www.qad.com/erp/Solutions/Manufacturing/Cebos+M Q1+Quality+Management+System [10] WinSPC (2013): Real-Time Statistical Process Control Software, retrieved on 28th March 2013 from http://www.winspc.com/products/winspc
[11] WinSPCServer (2013): What is the WinSPC Application Server?, retrieved on 8th April 2013 from http://knowledgebase.winspc.com/questions/300/What+is+the +WinSPC+Application+Server%3F Zontec (2013):Zontec: The Power of SPC, retrieved on 28th March 2013 from http://www.zontec-spc.com/ [12] Xlstat (2013): Statistical Process Control (SPC), retrieved on 28th March 2013 from http://www.xlstat.com/en/productssolutions/spc.html. [13] XlstatArch (2013): XlStat, retrieved on 8th April 2013 from http://www.kovcomp.co.uk/xlstat/xlsbroc.html. [14] SCADA (2004), Supervisory Control and Data Acquisition (SCADA) Systems, retrieved on 6th April 2013 from http://www.ncs.gov/library/tech_bulletins/2004/tib_04-1.pdf. Walski, Thomas M., et. al., Advanced Water Distribution Modeling and Management, Haestad Press, January 2003 [15] Synergy3000 (2010), SPC Cloud computing is here, retrieved on 6th April 2013 from http://zontec.wordpress.com/. [16] Minitab17_GettingStarted-en documentation as on 18 Feb 2014 from www.minitab.com/en-us/support/documentation [17] http://www.r-project.org/ [18] http://en.wikipedia.org/wiki/R_(programming_language) [19] The R Journal, Volume 5/1, June 2013, ISSN: 2073-4859, page 117
ISSN: 2049-3444 © 2016 – IJET Publications UK. All rights reserved.
61