International Journal of Multimedia and Ubiquitous Engineering Vol.10, No.7 (2015), pp.213-222 http://dx.doi.org/10.14257/ijmue.2015.10.7.22
A Multi-Layer Perceptron Approach for Customer Churn Prediction Mohammad Ridwan Ismail1, Mohd Khalid Awang2, M Nordin A Rahman2 and Mokhairi Makhtar2 Faculty of Informatics and Computing, Universiti Sultan Zainal Abidin, Tembila Campus, Besut, Terengganu, Malaysia 1
[email protected], 2{khalid, mohdnabd,mokhairi} @unisza.edu.my Abstract Nowadays, the telecommunication industries are facing substantial competition among the providers in order to capture new customers. Many providers have faced a loss of profitability due to the existing customers migrating to other providers. Customer retention program is one of the main strategies adopted in order to keep customers loyal to their provider. However, it requires a high cost and therefore the best strategy that companies could practice is to focus on identifying the customers that have the potential to churn at an early stage. The limited amount of research on investigating customer churn using machine learning techniques has lead this research to explore the potential of an artificial neural network to improve customer churn prediction. The research proposes Multilayer Perceptron (MLP) neural network approach to predict customer churn in one of the leading Malaysian’s telecommunication companies. The results are compared against the most popular churn prediction techniques such as Multiple Regression Analysis and Logistic Regression Analysis. The result has proven the supremacy of neural network (91.28% of prediction accuracy) over the statistical models in prediction tasks. Overall, the findings suggest that a neural network learning algorithm could offer a viable alternative to statistical predictive approaches in customer churn prediction. Keywords: Neural Network, Regression Analysis, Multiple Regression, Logistic Regression, Data Mining, Churn
1. Introduction Managing customers in the telecommunications industry plays an important approach to fight customer churn in this saturated market. Preventing churn via a retention program will assist the provider to save their customers from leaving. The main problem of any retention program is that it will incur a high cost if the provider plans to apply it to the entire customer base. To simplify the problem, a retention program should be implemented to the targeted customers who have a potential to churn. Positive development of the telecommunications industry provides an opportunity for the customers to choose the provider they prefer. Customers have a tendency to churn if the existing provider cannot treat their valuable customers at the early stage. Competitors compete with pricing and special packages to attract more customers compared to focusing on customers’ satisfaction [1]. Identifying potential customers to churn in a proactive way provides good advantages to the provider to implement retention programs for their valuable customers by offering an incentive or new packages to satisfy customers’ needs in an effort to prevent churn [2-3]. In fact, churn will continue to exist and customer management is the best way to ensure sustainable business growth for long term profitability rather than capturing new
ISSN: 1975-0080 IJMUE Copyright ⓒ 2015 SERSC
International Journal of Multimedia and Ubiquitous Engineering Vol.10, No.7 (2015)
customers [4]. Common churn management activity focuses on churn prediction using past churn data and the factors of customer churn known as predictors [5-8]. The success of churn prediction is determined by measuring the ability of the prediction models to produce high accuracy in correctly predicting whether a customer will churn or not. Traditionally, marketing strategies have focused on capturing new customers rather than retaining the existing customer base. The providers are trying hard to capture new customers by reducing the price and introducing special packages, thus the result will attract more customers through special offerings. Based on [9], the cost of capturing a new customer is five times higher than retaining the existing customers. Focusing on capturing new customers will affect the company profit due to the investment in capturing new customers. Previous researchers have proposed many methods to predict customer churn using statistical and machine learning algorithm [3, 8, 12, 16]. The limited amount of research on investigating customer churn using machine learning techniques has lead this research to explore the potential of an artificial neural network to improve customer churn prediction.
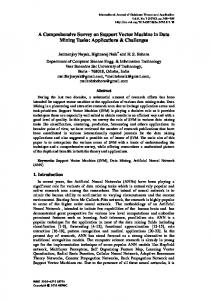
2. Related Work Data mining technique refers to extracting latent, unknown, meaningful and useful data information from large data sets to investigate the information that can be produced from the extracted data. In Europe, the number of customers who change operators has increased from year to year and the churn rate now stands at 25% up to 2012 on average [10]. The loss of valuable customers will have impact on higher costs to attract new customers, which is five to six times more expensive than customer retention expenses [11]. A previous study [12] utilized various data mining techniques to assist the telecommunication companies regarding churn issues. Another study [13] proposed customer demographics, market, customer relationship, billing and data usage as predictors to identify potential customer churn in the wireless technology. 2.1. Customer Churn Prediction Algorithms Predicting customer churn is not straightforward as various factors of predictor need to be analyzed. Earlier researchers have recommended many approaches to predict customer churn, such as neural network [3, 13-14], decision tree [15], regression analysis [8], and [16]. A study [12] shows that neural network, regression analysis and decision tree are popular tools in churn prediction.
Figure 1. Data Mining Techniques and Number of Publications (Abi et al., 2010)
214
Copyright ⓒ 2015 SERSC
International Journal of Multimedia and Ubiquitous Engineering Vol.10, No.7 (2015)
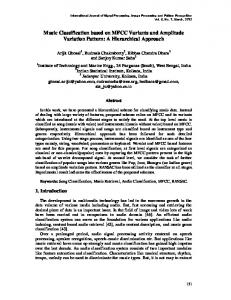
2.2. Neural Network Neural network is a computer system in which the operation is inspired from the human brain [17]. The model consists of the interconnection of neurons via the respective weight for each connection. The neural network produced an output based on experience during the training process [18]. Figure 2 shows graphical representations of a simple neuron model consisting of N number of input nodes. Multilayer Perceptron (MLP) neural network consists of multiple layers where the input signal propagates through layer by layer.
bj
x1
w1
x2
w2
x3
.. . x
F(t)
w3
𝑦̂
wN
N
Figure 2. Graphical Representation of Neuron Model During the training process, the input data is repeatedly fed into the neural network. Performances of every predicted output of neural network are compared with the desired output and errors are calculated. This error is then fed back to the neural network model and weights adjusted until the minimum error is achieved to produce the desired output.
𝜀𝑖 = 𝑦𝑖 − 𝑦̂𝑖
(1)
where 𝑦𝑖 = 𝑎𝑐𝑡𝑢𝑎𝑙𝑜𝑢𝑡𝑝𝑢𝑡 𝑦̂𝑖 = 𝑛𝑒𝑟𝑎𝑙𝑛𝑒𝑡𝑤𝑜𝑟𝑘𝑜𝑢𝑡𝑝𝑢𝑡 The principle of the neural network is that when data from an input is presented at the input layer, the network nodes (neurons) perform calculations in the successive layer until an output value is computed at each of the output nodes. The output of the ith hidden node is given by:
ℎ𝑖 = ∑𝑁 𝑖=1 𝑤𝑖 𝑥𝑖
(2)
where 𝑤i = 𝑐𝑜𝑛𝑛𝑒𝑐𝑡𝑖𝑜𝑛𝑠 𝑤𝑒𝑖𝑔ℎ𝑡 𝑏𝑒𝑡𝑤𝑒𝑒𝑛 𝑡ℎ𝑒 ℎ𝑖𝑑𝑑𝑒𝑛 𝑎𝑛𝑑 𝑖𝑛𝑝𝑢𝑡 𝑙𝑎𝑦𝑒𝑟𝑠 𝑥𝑖 = 𝑖𝑛𝑝𝑢𝑡 𝑛𝑜𝑑𝑒𝑠 The output of the ith neural network is given by:
𝑦̂𝑖 = 𝐹(∑𝑁 𝑖=1 𝑤𝑖 𝑥𝑖 + 𝑏𝑗 )
(3)
where 𝑏𝑗 = 𝑡ℎ𝑟𝑒𝑠ℎ𝑜𝑙𝑑𝑠 𝑖𝑛 ℎ𝑖𝑑𝑑𝑒𝑛 𝑛𝑜𝑑𝑒𝑠 2.3. Regression Analysis Regression analysis is known as a popular statistical tool for the prediction of customers [12]. The analysis will provide the relationship between the independent and
Copyright ⓒ 2015 SERSC
215
International Journal of Multimedia and Ubiquitous Engineering Vol.10, No.7 (2015)
dependent variables which apply the input features and the result of churn or non-churn in this application. Multiple regressions which consist of various input features or independent variables were used to build the relationship with respective dependent variables or output. The general equation of multiple regressions is as follows [19]:
𝑦 = 𝑎 + 𝑏1 𝑥1 + 𝑏2 𝑥2 + ⋯ 𝑏𝑖 𝑥𝑖
(4)
Where y is defined as a dependent variable, while x1,x2 until xi are the independent variables or the predictors. The value of b1, b2 until bi are known as the coefficient for the respective predictors of x, and a is the value of y when all the independent variables are equal to zero. In dealing with binary result, logistic regression is a widely used tool that predicts whether churn will occur or not [20]. Multiple logistic regressions can be expressed as Equation 2 which replaces the dependent variable y with logit function. 𝑝
𝑙𝑜𝑔 (1−𝑝) = 𝑎 + 𝑏1 𝑥1 + 𝑏2 𝑥2 + ⋯ 𝑏𝑖 𝑥𝑖
(5)
where p is a binomial proportion.
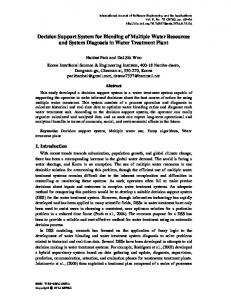
3. Research Methodology This project can be summarized in Figure 3. The research begins with the features extraction inspired from the literature review study. The data then undergoes preprocessing and normalization before being analyzed by the prediction tools. The development of the prediction tools involves neural network modelling and regression analysis. The proposed features are evaluated at the training and testing stage by their respective tools.
1. Data collection and selection
5. Testing stage
4. Training stage
2. Data preprocessing and normalization
3. Develop prediction tools/models
Figure 3. Research Framework The performance of the models was measured based on accuracy, sensitivity and specificity. Accuracy measures the proportion of churn and non-churn that are predicted correctly when compared to the total number of churn and non-churn data. Sensitivity measures the proportion of churn data that were correctly predicted to the total number of actual churn data. Specificity measures the proportion of non-churn which was correctly predicted to the total number of non-churn data.
216
Copyright ⓒ 2015 SERSC
International Journal of Multimedia and Ubiquitous Engineering Vol.10, No.7 (2015)
Table 1. Churn Prediction Categories Actual Churners
Actual NonChurners
Predicted Churners
True Positive (TP)
False Positive (FP)
Predicted NonChurners
False Negative (FN)
True Negative (TN)
Table 2. Measurements of Churn Prediction Measurement
Formula
Explanation
Accuracy (Acc.)
(TN + TP) / (TN+TP+FN+FP)
The number of correct predictions / Number of all predictions
Sensitivity (Sens.)
TP / (TP + FN)
Specificity (Spec.)
TN / (TN + FP)
The number of true positive predictions / Number of all positives The number of true negative predictions / Number of all negatives
3.1. Feature Extraction The most important part of churn prediction is the predictors used in the analysis. Data from a telecommunication company were manually extracted based on proposed features; customer demographics, customer relationship data, billing data and usage data. Customer demographics consist of a customer’s age and gender. Customer relationship data contain the internet speed, call packages and the monthly commitment for the Internet charges. The billing data consists of total customers’ bills, total payment and account receivable (AR) day data. Usage data explain the number of national and international calls performed by the customers. The proposed features for churn analysis can be summarized in Table 3. Table 3. Feature Extraction Features
Extracted Features
Customer Demographics
-Age -Gender
Customer Relationship Data
-Internet speed -Call packages -Monthly commitment for internet
Billing Data
-Total bill -Total payment -Account receivable (AR) days
Usage Data
-The total number of national calls -The total number of international calls
Copyright ⓒ 2015 SERSC
217
International Journal of Multimedia and Ubiquitous Engineering Vol.10, No.7 (2015)
3.2. Development of Prediction Models Software MINITAB for windows, version 16 was used to develop a multiple and logistic regression analysis model. Meanwhile, MATLAB 2008a software was used to execute the MLP neural network analysis. The data were arranged into four sets of data. During the training phase, 78 churn data and 58 non-churn data were used. While for the testing phase, 13 churn data and 10 non-churn data were used. Nine training algorithm from MLP neural network were used to predict customer churn which are the Levenberg-Marquardt backpropagation (trainlm), Bayesian Regularization backpropagation (trainbr), Scaled Conjugate Gradient backpropagation (trainscg), Conjugate Gradient backpropagation with Fletcher-Reeves Updates (traincgf), Conjugate Gradient backpropagation with Polak-RibiereUpdates (traincgp), Conjugate Gradient backpropagation with Powell-Beale Restarts (traincgb), One Step Secant backpropagation (trainoss), Resilient backpropagation (trainrp),and BFGS Quasi-Newton backpropagation (trainbfg). For regression analysis, multiple and logistic regression were proposed in this paper.
4. Results and Discussion The data was randomly selected from the data warehouse of the telecommunication company based on customers’ bills. Features extraction was base on nine months of bills and those who churn during this period were excluded from the analysis. 4.1. Neural Network Analysis The results of nine training algorithms of MLP neural network can be summarized in Table 4.The MLP neural network trained using Levenberg-Marquardt backpropagation (trainlm) provided the highest percentage of overall accuracy with 91.28%. While the percentage of overall accuracy for other algorithms i.e. Bayesian Regularization backpropagation (trainbr), Scaled Conjugate Gradient backpropagation (trainscg), Conjugate Gradient backpropagation with Fletcher-Reeves Updates (traincgf), Conjugate Gradient backpropagation with Polak-RibiereUpdates (traincgp), Conjugate Gradient backpropagation with Powell-Beale Restarts (traincgb), One Step Secant backpropagation (trainoss), Resilient backpropagation (trainrp),and BFGS Quasi-Newton backpropagation (trainbfg) were 74.43%, 71.55%, 70.75%, 66.77%, 72.25%, 70.38%, 66.77% and 67.51% respectively. Accuracy has a higher priority in prediction tools, therefore, LevenbergMarquardt (LM) algorithm was chosen among the training algorithms in comparing to other tools. Table 4. Performance of Proposed Training Algorithm Training Phase Type of Training Algorithm
Optimum Epoch
Trainlm trainbr trainscg traincgf traincgp traincgb trainoss trainrp trainbfg
38 8 45 9 17 33 16 18 49
218
Optimum Hidden Node 30 1 27 4 41 46 23 8 12
Testing Phase Acc. (%)
Optimum Epoch
95.59 70.59 73.53 63.24 63.97 70.59 62.50 63.97 65.44
12 5 30 7 11 17 5 18 10
Optimum Hidden Node 2 1 6 5 17 5 11 19 18
Acc. (%) 86.96 78.26 69.57 78.26 69.57 73.91 78.26 69.57 69.57
Overall Acc. (%)
91.28 74.43 71.55 70.75 66.77 72.25 70.38 66.77 67.51
Copyright ⓒ 2015 SERSC
International Journal of Multimedia and Ubiquitous Engineering Vol.10, No.7 (2015)
The results in Table 5a and 5b show the performance summary of MLP neural network trained with Levenberg-Marquardt (LM) algorithm. Accuracy, sensitivity and specificity of MLP neural network are 95.59%, 94.87% and 96.55% respectively for the training phase. While for the testing phase, the accuracy, sensitivity and specificity are 86.96%, 92.31% and 80.00% respectively. Table 5a.Training Result
Table 5b.Testing Result
Actual Predict ed
Actual
Chur n
NonChur n
Tota ls
Churn
74
2
76
NonChurn
4
56
Totals
78
58
Predicte d
Chur n
NonChur n
Tota ls
Churn
12
2
14
60
NonChurn
1
8
9
136
Totals
13
10
23
4.2. Multiple Regression Analysis The relationship of dependent and independent variables of multiple regression analysis is as shown in Equation (6): Output =1.62 - 0.00669 Var1 - 0.246 Var2 + 0.000048 Var3 - 0.00328 Var4 - 0.0151 Var5 - 0.00841 Var6 - 0.214 Var7 + 0.000006 Var8 - 0.000022 Var9 - 0.00160 Var10 - 0.00645 Var11 + 0.000005 Var12 + 0.00088 Var13 + 0.000008 Var14 - 0.000458 Var15 - 0.000006 Var16 + 0.00112 Var17 - 0.000661 Var18 + 0.000003 Var19 + 0.00204 Var20 (6) The results of multiple regressions for training and testing are as shown in Table 6a and 6b. Results from the tables show that the accuracy, sensitivity and specificity for the training phase are 79.41%, 91.03%, and 63.79% respectively. While for the testing phase, the accuracy, sensitivity and specificity are 78.26%, 76.92% and 80.00% respectively. Table 6a. Training Result
Table 6b.Testing Result Actual
Actual Predicted Churn
NonChurn
Totals
Predicted Churn
NonChurn
Totals
Churn
71
21
92
Churn
10
2
12
NonChurn
7
37
44
NonChurn
3
8
11
Totals
78
58
136
Totals
13
10
23
4.3. Logistic Regression Analysis Logistic regression equation as shown in Equation (7): Output=6.9323-0.0309226 Var1 - 1.46806 Var2 + 0.0003463 Var3 - 0.0384708 Var4- 0.130652 Var5 - 0.0544983 Var6 - 1.76608 Var7 + 0.0014638 Var8 - 0.0001494 Var9- 0.0191988 Var10 - 0.0452703 Var11 + 0.0000732 Var12- 0.0010744 Var13 + 0.0001597 Var14 - 0.0031387 Var15 - 0.000041 Var16 + 0.0058433 Var17 - 0.002859 Var18 + 0.0000159 Var19 + 0.0153593 Var20 (7)
Copyright ⓒ 2015 SERSC
219
International Journal of Multimedia and Ubiquitous Engineering Vol.10, No.7 (2015)
The Equation (7) was evaluated under the training and testing stage. From the Table 7a and 7b, analysis by using the logistic regression method produced a result of accuracy, sensitivity and specificity of76.47%, 74.36% and 79.31% respectively at the training phase. For the testing phase, the results show73.91%, 69.23% and 80.00% for accuracy, sensitivity and specificity respectively. Table 7a. Training Result
Table 7b. Testing Result
Actual Predicted
Actual NonChurn
Churn
Totals
Predicted Churn
NonChurn
Totals
Churn
58
12
70
Churn
9
2
11
NonChurn
20
46
66
NonChurn
4
8
12
Totals
78
58
136
Totals
13
10
23
4.4. Performance Comparison between Neural Network and Regression Analysis Tools Table 8 shows the comparison between neural network and regression analysis tools consisting of accuracy (Acc), sensitivity (Sens) and specificity (Spec). As can be seen in Table 8, the neural network is the best technique in predicting customer churn by evaluating the accuracy. The accuracy is acceptably good with 91.28% for neural network analysis compared to multiple regression; 78.84% and logistic regression; 75.19%. The sensitivity of neural network shows 93.59% compared to multiple regressions; 83.98% and logistic regression; 71.80%. The specificity of neural network also provided the highest specificity with a percentage of 88.28%. Whereas the specificity of multiple and logistic regression provided the percentages of 71.90% and 79.66% respectively. Table 8. Result Summary Multiple Regression
Acc. Sens. Spec.
Logistic Regression
Neural Network
Train (%)
Test (%)
Overall (%)
Train (%)
Test (%)
Overall (%)
Train (%)
Test (%)
Overall (%)
79.41
78.26
78.84
76.47
73.91
75.19
95.59
86.96
91.28
91.03
76.92
83.98
74.36
69.23
71.80
94.87
92.31
93.59
63.79
80.00
71.90
79.31
80.00
79.66
96.55
80.00
88.28
5. Conclusion The most effective customer retention strategies should be used to efficiently reduce customer churn rates. The research proposes Multilayer Perceptron (MLP) neural network approach to predict customer churn in one of the leading Malaysian’s telecommunication companies. The results are compared against the most popular churn prediction techniques such as Multiple Regression Analysis and Logistic Regression Analysis. The result confirmed the previous claims made by many researchers stating the superiority of
220
Copyright ⓒ 2015 SERSC
International Journal of Multimedia and Ubiquitous Engineering Vol.10, No.7 (2015)
neural network over statistical models in prediction tasks. The optimum model of neural network consists of fourteen input units, one hidden node and one output node with Levenberg Marquardt (LM) learning algorithm. The best results of the experiment indicate that this model is able to produce prediction accuracy of 91.28%. Overall, the findings suggest that a neural network in modelling techniques offers a viable alternative to traditional predictive approaches in customer churn prediction.
Acknowledgements This work is partially supported FRGS/2/2013/ICT07/UniSZA/02/2.
by
UniSZA
and
KPM
(Grant
No.
References [1] [2] [3]
[4] [5] [6]
[7] [8]
[9] [10] [11] [12]
[13]
[14]
[15] [16] [17] [18] [19] [20]
S. Portelaa and R. Menezes, “Modeling Customer Churn: An Application of Duration Models,” Proceedings of the Australian and New Zealand Marketing Academy (ANZMAC), (2009). J. Hadden, “A Customer Profiling Methodology for Churn Prediction,” Cranfield University, (2008). A. Sharma and P. K. Panigrahi, “A Neural Network based Approach for Predicting Customer Churn in Cellular Network Services,” International Journal of Computer Applications, vol. 27 no. 11, (2011), pp. 26-31. H. E. Chueh, “Analysis of marketing data to extract key factors of telecom churn management,” African Journal of Business Management, vol. 5 no. 20, (2011), pp 8242-8247. A. Berson, S. J. Smith and K. Thearling, “Building Data Mining Applications for CRM,” McGraw-Hill, NewYork, (2000). M. C. Mozer, R. Wolniewicz, D. B. Grimes, E. Johnson and H. Kaushansky, “Predicting Subscriber Dissatisfaction and Improving Retention in the Wireless Telecommunications Industry,” IEEE Transactions On Neural Networks, vol. 11 no. 3, (2000), pp. 690 - 696. B. H. Chu, M. S. Tsai and C. S. Ho, “Toward a hybrid data mining model for customer retention,” Knowledge-Based Systems, vol. 20 no. 8, (2007), pp. 703-718. M. K. Awang, M. N. A. Rahman and M. R. Ismail, “Data Mining for Churn Prediction: Multiple Regressions Approach,Computer Applications for Database, Education, and Ubiquitous Computing,” Springer Berlin Heidelberg, (2012), pp. 318-324. D. Chiang, Y. Wang, S. Lee and C. Lin, “Goal-oriented sequential pattern for network banking and churn analysis,” Expert systems with applications, vol. 25, (2003), pp. 293-302. A. T. Kearney, “European Mobile Industry Observatory 2011. In GSMA (Ed.),” Rising to the Challenge of Intense Competition, (2011). A. D. Athanassopoulos, “Customer Satisfaction Cues To Support Market Segmentation and Explain Switching Behavior,” Journal of Business Research, vol. 47, (2000), pp. 191-207. S. K. Abi, M. R. Gholamian, M. R. and M. Namvar, “Data Mining Applications in Customer Churn Management,” Paper presented at the International Conference on Intelligent Systems, Modelling and Simulation, (2010). J. B. Ferreira, M. Vellasco,M. A. Pacheco and C. H. Barbosa, “Data Mining Techniques on the Evaluation of Wireless Churn,” Paper presented at the European Symposium on Artificial Neural Networks, (2004). Y. He, Z. He and D. Zhang, “A Study on Prediction of Customer Churn in Fixed Communication Network Based on Data Mining,” Paper presented at the Sixth International Conference on Fuzzy Systems and Knowledge Discovery, (2009). P. Datta, B. Masand, D. R. Mani and B. Li, “Automated Cellular Modeling and Prediction on a Large Scale,” Artificial Intelligence Review, vol. 14 no. 6, (2000), pp. 485-502. C. Kang and S. P. Ji, “Customer Churn Prediction Based on SVM-RFE,” Paper presented at the International Seminar on Business and Information Management, (2008). S. Haykin, “Neural Network : A Comparehsive Foundation. New Jersey Prentice Hall International, vol. 2, (1999). A. Krogh, “What are artificial neural networks?,” Nature Publishing Group, vol. 26 no. 2, vol. (2008), pp. 195-197. D. M. Levine, P. P. Ramsey and R. K. Smidt, “Applied statistics for engineers and scientists: using Microsoft Excel and Minitab,” Upper Saddle River, NJ: Prentice Hall, (2001). S. A. Sweet and K. G. Martin, “Data Analysis with SPSS: A First Course in Applied Statistics,: Pearson, vol. 2, (2010).
Copyright ⓒ 2015 SERSC
221
International Journal of Multimedia and Ubiquitous Engineering Vol.10, No.7 (2015)
222
Copyright ⓒ 2015 SERSC