MARINE ECOLOGY PROGRESS SERIES. Mar. Ecol. Prog. Ser. Published December 15. Juncus roemerianus production and decomposition along gradients of ...
MARINE ECOLOGY PROGRESS SERIES Mar. Ecol. Prog. Ser.
Published December 15
Juncus roemerianus production and decomposition along gradients of salinity and hydroperiod Robert R. Christian, Wade L. Bryant Jr*,Mark M. Brinson Department of Biology, East Carolina University. Greenville, North Carolina 27858, USA
ABSTRACT: Juncus roemerianus Scheele, the black needlerush, dominates much of an irregularly flooded salt marsh at the Cedar Island National Wildhfe Refuge, North Carolina, USA. We examined its dynamics of growth, senescence, and decomposition along a 1.6 km transect into the marsh over salinity and hydroperiod gradients passing successively through 3 distinct vegetational zones. Little difference was noted among zones in any of the dynamic aspects examined. Aerial, annual net primary production of J. roernerianus averaged 812 g dry mass m-2. This rate is comparable to that of J. roemerianusin other North Carolina marshes. Measured parameters for production estimates were production-to-biomass ratio, frequency of replacement of growing leaves (number of times per year in which leaf cohorts grow to maximum height), and standing crop of growing leaves. Only the latter parameter revealed statistically significant change with distance into the marsh with the most inner zone having the least biomass of leaves. Senescence of leaves progressed similarly along the transect, as did decomposition. A lack of dominance by J. roemerianus in the inner zone may be a consequence of competitive advantages of other species in an environment of lower salinity and shorter hydroperiod. On average, Juncus roemerianus leaves grow for 259 d and senesce for 312 d. The rate of decomposition of standing dead leaves is slow (-0.25 F-') Thus . it would not be uncommon for a leaf to remain standing for several years. Given this longevity and persistence, biomass removal by physical processes such as storms and fire may be important.
INTRODUCTION
Where present, the salt marsh plant Juncus roemerianus Scheele acts often as a major structural component of marshes. The life history of this stresstolerator (sensu Grime 1979) is such that throughout the year leaf recruitment occurs and leaves continue to grow, and dead leaves remain standing for long periods of time (Williams & Murdoch 1972, Eleuterius 1975, Eleuterius & Caldwell 1981).The result is a dense assemblage that can easily exceed 1000 leaves, both living and dead, per m'. Little light penetrates to the soil surface, and this thicket provides habitat for a variety of marsh animals (Stout 1984). While primary production and decomposition of salt marsh plants have received considerable attention for over a quarter of a century, these processes are not well known in Juncus roemerianus. One of the earliest and Present address: Department of Environmental Engineering, University of Florida, Gainsville, Florida 32611, USA C3 Inter-Research/Printed in Germany
most complete studies of primary productivity in this plant was done by Williams & Murdoch (1972). They analyzed the results of changes in height of 92 tagged leaves in the context of harvested biomass to derive production and senescence rates in a North Carolina marsh. Their technique has been used by others (Hopkinson et al. 1980). As the detritus food web is considered of great importance to marsh ecosystems, decomposition studies of marsh plants, especially with 'litter bags', have also been widely conducted (Brinson et al. 1981, Christian 1984).We used both tagging and litter bag approaches to study J. roemerianus at Cedar Island National Wildlife Refuge, North Carolina, USA. Salt marshes are often characterized, from edge to interior, by changes in salinity and hydroperiod. Extent and direction of these changes depend on a variety of factors including source waters, marsh size, elevational changes, tidal amplitudes and frequencies, and neighboring landscapes. The most widely considered paradigm is that of a regularly flooded marsh positioned between diurnally tidal waters and upland (Turner
138
Mar. Ecol. Prog. Ser.
1976, Pomeroy & Wiegert 1981, Bertness & Ellison 1987). In such marshes, dominated by Spartina spp., plant dynamics vary considerably along transects from edge to interior and along salinity and hydroperiod gradients. In contrast, the marsh at Cedar Island National Wildlife Refuge is irregularly flooded, lacks dominance by Spartina spp., and is an island rather than having an upland edge. Nevertheless, changes in salinity and hydroperiod occur from edge to interior. Little is known about such marshes and the interrelations between changes in such physical factors and plant dynamics. Therefore the objective of the study was to determine the aerial, annual net primary production (ANPP), senescence, and decomposition rates of Juncus roemerianus in relation to gradients of salinity and hydroperiod and through 3 zones of community structure. We also compared these rates and standing crops of growing, senescing, and standing dead leaves relative to the population's biomass dynamics and distribution. This work is part of a larger program reported in Brinson (1990).
STUDY SITE
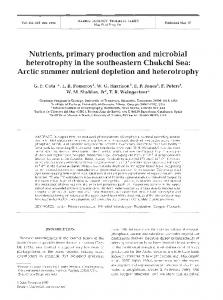
The study was conducted at Cedar Island National Wildlife Refuge in Carteret County, North Carolina, USA (Fig. 1).Aerial photography resolved 3 concentric zones of vegetation from the marsh edge (Zone 1) to interior (Zone 3). Work was done on Merkle Bay transect (MBT)which ran perpendicular to these zones from the marsh shoreline to the interior. The 1.6 km transect was chosen as representative of environmental gradients of salinity, hydroperiod, and elevation that occurred along other transects into marsh. Along this transect the marsh surface elevation of Zone 1 was 15 cm below that of Zone 3 (Fig. 1). Two years of data from stations approximately mid-way in each zone characterize conditions for plant growth (Brinson 1990). In Zone 1 pore water salinity at 0.4 m depth averaged 28.6 %o, and the marsh was flooded 98.5 % of the time at an average depth of 8.6 cm above the marsh surface. Pore water salinity in Zone 2 averaged 22.1 and the zone was flooded 84.5 % of the time at an average depth of 4.8 cm. In Zone 3 pore water salinity averaged 9.6 %o, and the marsh was flooded 29.9 % of the time; average water depth was -8.6 cm (below surface). Surface water salinity was more variable and normally lower than pore water salinity. Salinities in the estuary adjacent to the marsh commonly are in the range of 15 to 20 %o, but values between 5 and 30 %O have been recorded (Records of N.C. Division of Marine Fisheries, Morehead City, North Carolina, USA). Topographic relief is low on a large scale and relatively high at small scale resulting in very slow drain-
Fig. 1. Location of (a) Cedar Island marsh, North Carolina USA, and (b) study site and 1.6 km transect (MBT). Numbered vegetational zones described in text
age from the center to the periphery of the marsh. At the periphery, drainage is further impeded by the presence of a shoreline levee which tends to trap water running off the marsh interior which accumulated there from either rainfall or flooding from the estuary. The sampling site at 50 m mentioned below is on this levee. The lack of distinct drainage courses and prevalence of sheet flow characterize the marsh as an area of very low hydrologic energy compared to other coastal marshes. Cedar Island marsh owes its hydrologic and salinity characteristics to Pamlico Sound. Because of the resistance that the narrow inlets of the Outer Banks create to the exchange of water between the Atlantic Ocean and the sound, astronomic tidal fluctuations are greatly diminished within the estuary, and the marsh itself is nontidal. The nearest connection to the ocean is Drum Inlet, 12 km by water to the south (Fig. 1). Wind direction and force are the major determinants of water level fluctuations (Giese et al. 1985, Pietrafesa et al. 1986). Flooding by estuarine water on Cedar Island marsh occurs when winds from northeasterly directions persist long enough to cause a 'set-up' of water in the southwestern area of the sound near Cedar Island.
Christian et al.: Juncus roemerianus production and decomposition
Such 'northeaster' storms may flood the marsh more than l m deep. Vegetation analysis revealed that species composition and dominance on the transect were representative of other areas in the marsh (Knowles 1989). Although Juncus roemerianus was the dominant species in all 3 zones, its importance decreased from Zone 1 where Distichlis spicata (L.) Greene was subdominant, to Zone 2 where Spartina patens (Aiton) Muhl and Fimbristylis spadicea (L.) Vahl were subdominant, and to Zone 3 where S. patens and Panicum virgatum L. were subdominant. Also, scattered shrubs, primarily Myrica cerifera L., were diagnostic of Zone 3.
MATERIALS AND METHODS Study transect. Seventeen sites along Merkle Bay transect were set for aerial, annual net primary production (ANPP), and senescence studies at 50, 90, and approximately every 100 m from 90 m inland through 1590 m. Care was taken to ensure that each study site was within a stand of Juncus roemerianus and not where the species was an obvious subdominant. Decomposition studies were conducted at 200, 500, 800, 1200, and 1600 m. Sampling overview. We generally followed the procedures of Williams & Murdoch (1972) to determine ANPP and senescence rates. However, enough modifications were made to warrant the detailed descriptions below. Juncus roemerianus leaves were tagged on 4 occasions: 13 March 1986, 27 May 1986, 11 November 1986,and 5 May 1987. We placed over each leaf a small ring of numbered Tygon tubing to which a colored strip of tape was tied. We chose leaves to be tagged on the basis of their height and relationship between their total height and the height of their green portion. Young cohorts were considered as less than 30 cm total height and mostly or all green. Older, growing leaves were considered as over ca 30 cm total height but still largely green (> 95 %). Senescing leaves were considered as greater than 50 cm in total height and having considerable browning from the tip. On 13 March 1986, 3 leaves of each cohort were tagged at each of the 17 sites (Cohorts 1, 2, and 3 in order of probable age). On the 2 subsequent dates (27 May 1986 and 11 Nov 1986) of tagging, 3 young cohort leaves were tagged at each site (Cohorts 4 and 5 in order of date of tagging). On 5 May 1987, 3 young cohort leaves were tagged at 190, 490,790, 1190, and 1590 m (Cohort 6). Thus 270 leaves were tagged over the course of the study. Growth and senescence of tagged leaves were followed from 13 March 1986 through 29 March 1988. Total height and height of the green portion of each leaf were measured on 24 dates using meter sticks until
139
the leaf turned completely brown. When the height of the green portion was not the same around the circumference of the leaf, maximum height of the green portion was measured. Occasionally new leaves of a comparable size and condition to lost leaves were tagged as replacements. Biomass estimates were derived from 4 harvests of above-ground plant material: March 1986, May 1986, September 1986, and February 1987. For each of the harvests one 0.0625 m2 plot was randomly chosen along each of two 10 m transects at each site. All material was clipped within 2 cm of the marsh surface and returned to the laboratory for separation and analysis. Litter bags of standing dead Juncus roemerianus were sampled from each of the 5 locations previously described. We harvested senescent (brown) leaves that had a slight amount of green at the base. They were air dried, and 15 g were placed into each litter bag. The bags were cylindrical, having a height of 80 cm and a diameter of 10 cm, and were made of l mm mesh fiberglass screening. On 23 September 1986, at 5 sites 34 bags were hung vertically from 0.8 m high monofilament line stretched around the periphery of a square to simulate standing dead leaves. Bases of the bags were in contact with the marsh surface. Periodically until 29 March 1988, 2 bags were randomly chosen from each site and were returned to the laboratory for analysis. Sample analysis. Harvested plant material was separated into Juncus roemenanus leaves which had some green (living leaves), those that were all brown (dead leaves), and material from other plant species (other). For all dates the numbers of living and dead leaves per plot were determined. Further, the living leaves were sorted into categories based on the heights of the green portion and total leaf. A matrix was developed by which leaves were classified according to 20 cm increments of both measured heights. For example, categories included living leaves that had both green and total heights between 0 and 20 cm; green height between 0 and 20 cm but total height between 20 and 40 cm; and so on for longer leaves. On dates after the first harvest, living leaves, dead leaves, and other material were separately dried at 85 "C, and weighed to 0.1 g. Representative leaves from the first harvest were used to establish the relationship between leaf height and mass. Living leaves were cut into green and brown portions. The length of each portion was measured to the nearest mm; the portions were dried at 85 "C and then weighed. Decomposing leaves from litter bags were also dried at 85 "C and weighed. Data analysis. ANPP (g m-' yr-l) was calculated as the product of above-ground biomass (AVE BIOM) (g m-'), production-to-biomass ratio (P/B) (dimension-
140
Mar. Ecol. Prog. Ser. 68: 137-145, 1990
less), and annual frequency of replacement of growing leaves (days of leaf growth divided into 365 days per year) (FREQ) (yr-l). The latter 2 components were derived from the tagging studies, and the former from harvesting. Cohorts 1, 2, 4, 5, and 6 were tagged while growing, and thus used for estimates of ANPP. For the length of growing time required for the calculations we incorporated an estimate of when the leaves began to grow. In contrast Williams & Murdoch (1972) assumed that this 'zero time' (To)occurred when a young leaf was tagged. We extrapolated backwards to To assuming a linear relationship between height and time: To = T1-Hi. (T2-Tl) f (H2-Hi)
(1)
where T1 = date of tagging; T2 = next sampling date; H1 = height at the day of tagging; H2 = height at the next sampling. This calculation was made for both the green and total heights of each leaf, and the average To from both was taken as the zero time for the leaf. This procedure worked well for most leaves. However, Cohort 5 was begun in autumn when growth had slowed resulting in inordinately long intervals between T1 and calculated To. When this occurred, To was assumed to be 1 or 2 sampling dates prior to tagging depending on the height of the leaf at tagging. The number of days from To to the date at which green height was maximum was designated the replacement time for each growing leaf, and FREQ was this value divided into 365 days per year. The total height for the date when the green portion of the leaf was maximum was considered the maximum height of the leaf (MAX HT in cm). The production to biomass (P/B) ratio was mathematically equivalent to the ratio of MAX HT to average total height during the period of growth (AVE HT in cm). This latter ratio was considered P/B, where AVE HT was calculated as: AVE HT = fori=Oton
1{ [ H ~ +- ~(Hi
- Hi -
)
1)/2] X (Ti - Ti - l)/(Tn- To) (2)
where Hi (cm) = total height at date Ti; n = sampling date for MAX HT. This was calculated for each leaf in the cohorts under consideration. The average biomass (AVE BIOM) of growing leaves per m2 of marsh was obtained by combining 2 sets of information: the relation between height and biomass per leaf and the density of growing leaves. The natural logarithms of biomass of green and brown leaf portions were regressed against the natural logarithms of height, both separately and combined (Williams & Murdoch 1972). Little difference was found between the regression equations of biomass with green and brown portions; thus an equation for the combined data set was used. A total of 372 leaf portions were used in the analysis providing the equation:
In (mass in dry g) = 1.3398 [In (height in cm])- 6.266 (3) The r for this relationship was 0.979 (p G 0.01). The biomass per leaf of average height for each size class category in the matrix previously described was determined from the aforementioned regression. This value was multiplied by the number of leaves in a size class category from a harvest. After conversion of plot area to m2, the density data could be thus expressed as g mp2.Growing leaves were taken as those in which the green and total heights were within the same 20 cm increment. The sum of biomass of all such leaves per m2 from each location was used as the total biomass of growing leaves for that location. These values were averaged by location for the 4 harvests providing the estimate of AVE BIOM. The averages of FREQ and P/B for each cohort from each location were determined. ANPP (g m-2 yr-l) for each cohort was calculated as: ANPP = P/B (dimensionless) X FREQ (yr-l) X AVE BIOM (g m-2). We then averaged all variables from cohorts 1, 2, 4, and 5 by location. The residence time for leaf senescence was considered the interval between maximum green height and loss of all green for Cohorts 1 and 2. The date of maximum height was determined as described. We considered that loss of all green occurred at a date midway between the sampling date when green was last detected and the subsequent sampling date. The inverse of residence time in the units yr-l is frequency with which senescence occurs. This can be directly compared to FREQ for growth.
RESULTS
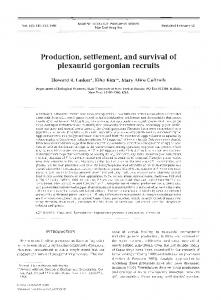
Aerial annual net primary production ANPP of Juncus roemerianus at a location as averaged for 4 cohorts ranged from 463 to 1030 g m-' over the 1.6 km transect (Fig. 2a). The grand mean and standard deviation (SD) for the entire transect were 812 145 g m-'. We chose a sample design that would be conducive to correlation and regression analyses of variables with distance. Analyses of ANPP against distance (n = 17) did not produce a statistically significant correlation coefficient (r = 0.400, p > 0.05) or a nonzero regression slope (t = 1.69, p > 0.05).Thus, we assumed that if no trends were noted and if regression and correlation analyses proved nonsignificant, no major difference among zones should be apparent. The lower ANPP at 1590 m may reflect differences between Zone 3 and the others. However, results from the other 2 sites in Zone 3 (1390 and 1490 m) were within the range of those of other locations.
+
141
Christian et al.: Juncus roemenanus production and decomposition
Fig. 2. Juncus roemenanus. (a) Aerial, annual net primary production (g m-' yr-l); (b) production to biomass ratio; (c) frequency of growth ( ~ r - ' ) to maximum height; (d) average growing biomass (g m-') along Merkle Bay transect. Bars overlap for data from 50 and 90 m because of the proximity of sites
n 500
2.00
/-. 1L
5
N
1.50
l,oo W
E o,so
300
5-
200
W
o,oo o
200 400 600 800 1000 1200 1400 1600
The P/B ratio was relatively constant varying only from 1.81 to 2.09 (Fig. 2b). Average and standard deviation for all locations were 1.96 0.36. Again there were no statistically significant trends for this parameter along the transect (r = 0.003, p > 0.05; t = 0.00, p > 0.05). Even at 1590 m leaves possessed a comparable P/B to other locations. The frequency of replacement of growing leaves (FREQ) averaged by location ranged from 1.10 to 1.92 y ~ - lover the transect (Fig. 2c) with a grand mean and standard deviation of 1.41 0.33 yr-l. This corresponds to an average time of 259 d for a leaf to achieve maximum height. No statistically significant trends were noted in FREQ along the transect (r = 0.250, p > 0.05; t = 1.00, p > 0.05).FREQ values within each zone were comparable to those in others as was the FREQ at 1590 m (1.37 yr-l). AVE BIOM ranged from 427 g m-2 at 50 m to 172 g m-' at 1590 m (Fig. 2d). The mean and standard deviation for alI locations were 307 72 g m-'. A statistically significant correlation was noted (r = -0.531, p < 0.05), and the regression slope was nonzero (t = 2.43, p < 0.05). This may have been a consequence of minimum and maximum values at opposite ends of the transect rather than a real decrease with distance. For example, the penultimate locations had biomasses of 317 g m-' (90 m) and 290 g m-2 (1490 m) which were close to the mean, and the second highest biomass was at 790 m. Emphasis in this study was placed on the production of Juncus roemerianus, but other species contribute to the total above-ground standing crop and production of the marsh community. Biomass of other species near the end of the growing season (Sep 1986) ranged from 67 g m-' at 50 m to 1398 g m-' at 1590 m with an average of 524 t 385 g m-' (Fig. 3a). These other species (Spar-
+
+
400
cn v
m loo
DISTANCE FROM EDGE (m)
*
'E
'0
Q
o
200 400 600 800 1000 1200 1400 1600
DISTANCE FROM EDGE (m)
tina patens, DistichLis spicata, Fimbristylis spadicea, Panicum virgatum) become dominant toward the interior of the marsh. However, our study sites were intentionally selected for areas where J, roemerianus was visibly dominant or at least plentiful. Thus these estimates may underestimate the importance of other species to a zone. Cohorts 1 and 6 were tagged as young leaves ca 1 yr apart (Mar 1986 and May 1987).The ANPPs for Cohort 1 (1986) at 190, 490, 790, 1190, and 1590 m were 784, 981, 1259, 863, and 720 g m-2 yr-l, respectively. The respective ANPP values for Cohort 6 (1987) were 1411, 1212, 1483, 1511, and 495 g m-2 yrrl. Thus interannual differences in ANPP may be large. The summer of 1986 was considerably drier than that of 1987. At 800 m, for example, the percent of time flooded in summer was 59 % in 1986 and 86 % in 1987. At 1600 m, corresponding flooding time was 8 % in 1986 and 27 % in 1987. This or some other environmental factor may have led to these differences in ANPP.
Senescence and longevity The biomass of senescing leaves was obtained from the matrix of biomasses of size class categories. All live leaves in which the green height category was shorter than the total height category were considered senescing. At 15 of 17 locations biomass of senescing leaves exceeded that of growing leaves (Fig. 3b compared to Fig. 2d). Biomass of senescing leaves ranged from 247 g m-' at 1590 m to 723 g m-' at 50 m. Larger biomasses were found near the marsh edge and from 490 to 990 m. Overall mean senescing biomass was 411 108 g m-' compared to 307 72 g m-' for growing biomass.
+
+
142
Mar. Ecol. Prog. Ser. 68: 137-145, 1990
n
1400
800
/--.
' E 1200
N
F"0
(J,
~ 1 0 0 0
.-
800
F