k-PathA: k -shortest Path Algorithm (pronounce as “Qu´e Pasa”)
Alexander Ullrich
Christian V. Forst
Chair for Bioinformatics University of Leipzig Leipzig, Germany Email:
[email protected]
Department of Clinical Sciences University of Texas Southwestern Medical Center Dallas, TX U.S.A. E-mail:
[email protected]
Abstract—One important aspect of computational systems biology includes the identification and analysis of functional response networks within large biochemical networks. These functional response networks represent the response of a biological system under a particular experimental condition which can be used to pinpoint critical biological processes. For this purpose, we have developed a novel algorithm to calculate response networks as scored/weighted sub-graphs spanned by k-shortest simple (loop free) paths. The k-shortest simple path algorithm is based on a forward/backward chaining approach synchronized between pairs of processors. The algorithm scales linear with the number of processors used. The algorithm implementation is using a Linux cluster platform, MPI lam and mpiJava messaging as well as the Java language for the application. The algorithm is performed on a hybrid human network consisting of 45,041 nodes and 438,567 interactions together with gene expression information obtained from human cell-lines infected by influenza virus. Its response networks show the early innate immune response and virus triggered processes within human epithelial cells. Especially under the imminent threat of a pandemic caused by novel influenza strains, such as the current H1N1 strain, these analyses are crucial for a comprehensive understanding of molecular processes during early phases of infection. Such a systems level understanding may aid in the identification of therapeutic markers and in drug development for diagnosis and finally prevention of a potentially dangerous disease. Index Terms—Biological and numerical parallel computing; k-shortest path; response network; host response; infectious disease; systems biology, influenza virus
I. I NTRODUCTION Systems biology addresses a novel approach to study, analyze and, finally, control biological systems. Unlike traditional research that typically focus on single genes, systems biology, as coined by Leroy Hood, President and Director of the Institute for Systems Biology, studies complex interaction of all levels of biological information; genes, transcription factor binding sites on genomic DNA, RNAs, proteins, protein complexes, information and biochemical networks. With the plethora of interaction and network information available, new high-performance analysis tools are required to study such large and complex data-sets with 100,000s components and connections. Research in Systems Biology is aiming at the understanding
and modeling of biological processes and systems by a multilevel/multi-science approach. One particular emphasis within system biology lies on the understanding of the molecular ’omic’ foundation of a phenomenological systems response. One particular molecular ’omic’ dataset encompasses transcriptomic expression data. With advanced techniques for concentration measurements of macromolecules being developed, time series of mRNA concentrations for whole organisms are now available. A potential phenomenological systems response could be the host response against viral infection, as it will be introduced as application in section III. One particular goal within systems biology is to develop the capability for analyzing biological interaction networks as they record the response of a biological system to different external conditions. These so called functional response networks represent the response of a biological system under a particular experimental condition which can be used to pinpoint critical biological processes. Groundwork with respect to the analysis of such response networks has been laid in seminal contributions from Ideker et al. [8], [9] and Zien et al. [18]. This capability is of great importance for the understanding of system behavior. We have developed these approaches further by including mathematical methods for the comparative analysis of response networks between different experimental conditions [3]. Algorithmically, our original approach is based on solving the k-shortest simple path problem originally introduced by Hershberger and coworkers (2003) [6]. The kshortest path problem tries to find a set of paths, beginning from the shortest (k = 1), second shortest (k = 2) up to the k-shortest paths, between a pair of nodes in a network. These paths can be weighted and may or may not be loop free. The stricter version of the k-shortest simple path problem prohibits loops along such paths. We have successfully applied the method of response network calculations in the case of stress and drug response (ibidem) as well as fatty-acid metabolism in the microbial pathogen Mycobacterium tuberculosis [13]. Genomic technology is now following a faster version of ’Moore’s law’ for advances in semiconductor technology, with the resolution for a given cost doubling in less than a year. These advances in technology have induced an incredible increase of available sequence information alone. The National
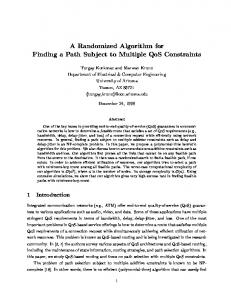
Center of Biotechnology Information (NCBI) at NIH reports to house almost 100 million sequences contributing to 100 billion DNA base pairs1 . Complete genome information of more than 800 organisms is available. With respect to other “omic” information, almost 400,000 gene-expression samples have been submitted to the Gene Expression Omnibus (GEO) repository at NCBI2 . PathGuide [2], a pathway resource and interaction database tracking site, reports almost 160,000 small molecules and 21 million genes and proteins interacting in 139,000 pathways and 35 million interactions3 . Thus there exists the dire need for high-throughput analysis algorithms that are able to process this plethora of available sequence and interaction information. The k-shortest paths problem is a well known network optimization problem whereby the k shortest paths between two nodes of a network are ranked. Numerous approaches for k-shortest path algorithms are available in the literature, also implementations in parallel exist [5], [15]. Our program, which is constrained to loopless paths, is unique by allowing for remote parallel computation without the need of a shared memory between the different processors. The paper is structured as follows. It will present a new method for analyzing biological response data, such as those from gene-expression arrays, by combining it with computationally derived network information. This method utilizes a weighted k-shortest simple path algorithm. The paper will discuss a particular implementation of this algorithm in a parallel computing environment. Specifically, it will introduce methods for constructing network maps from “omic” data (Section II-A), discuss how seed nodes for the computation of a subnetwork are chosen, evaluated and optimized (Section II-B). Finally, the paper elucidate the algorithm for finding k-shortest simple paths (Section II-C) and issues of the parallel implementation (Section II-D). The impact of these studies will be the identification of response networks in very large network maps with potential applications for biological systems modeling and analysis. II. M ETHOD AND I MPLEMENTATION In the following, we give an overview of the architecture of our approach (see Figure 1) and describe the different aspects of the algorithm to compute response subnetworks by spanning k-shortest simple paths and its implementation in parallel (also see Figure 3). A. Network Construction The systems that we want to investigate, e.g. interactions in cells responding to viral infects, stress or drug targets, can be represented as networks. Thus, the first step is to construct these networks using several kinds of data about the system. Biochemical networks have been represented by different notations across science disciplines. Particularly the representation of metabolic pathways, with nodes presenting chemicals and edges referring to chemical transformation catalyzed by 1 http://www.ncbi.nlm.nih.gov/Genbank/genbankstats.html 2 http://www.ncbi.nlm.nih.gov/geo/query/browse.cgi 3 http://www.pathguide.org/statistics.php
Fig. 1. Overview of the architecture of our approach. The origin and constitution of the “Omics”-Data is explained in Section II-A
enzymes, has been used in textbooks for decades. For example, the ornitine cycle that is responsible for urea synthesis in living cells has been discovered by Krebs and Henseleit in 1932 [11]. Alternative, more recent, representations include enzyme centered networks with enzyme as nodes and utilized chemicals as edges between corresponding enzyme pairs have been defined [17]. More comprehensive representations of metabolic networks are based on Petri-Nets [14] or hypergraphs [17]. In this study, we are considering enzymes and other proteins as the most relevant objects for the response network computation. Hence, nodes in the network represent proteins in the respective observed system. The information about the abundance of proteins in a system can be gathered from sources for protein-protein interactions or metabolic reactions. Further, there are three types of interactions/relations between those proteins that we determined as important for the task of finding response networks. Thus, we regard three different types of links which will be annotated as particular edge property in the network. Having different types of labeled interactions in the network is of significant advantage compared to typical protein interaction networks that do not provide further information on the type of interactions.
Links of the first type are protein-protein interactions between the proteins represented by connected nodes. The information about these interactions is extracted from sources in literature, e.g. by automated or curated natural language processing systems, such as iHOP by Hoffmann et al. [7], and special interaction databases BioGRID4 ) [16], (DIP5 , IntAct [10], or derived from annotated genomes. Proteinprotein interactions play vital roles in most processes of living cells, e.g. kinases in signal transduction as a special case. The latter have been identified by predicting in vivo kinasesubstrate relationships, that augment consensus motifs with context for kinases and phosphoproteins. Another interesting relation between proteins is their cooperation in metabolic pathways. Therefore, we use data about metabolic reactions from specialized databases (BioCyc6 , KEGG7 ) to form the links of the second type. For the network, this implies that two nodes are connected if their respective proteins have one or more metabolites in common. Finally, we consider also gene-regulatory interactions from a variety of data-sources8 by focusing on causal relationships such as “activation” and “inhibition”. Considering all different types of connections, as mentioned above, potentially induces more than one edge between a pair of proteins. For example, between the “v-yes-1 Yamaguchi sarcoma viral related oncogene homolog” (Lyn) and “hematopoietic cell-specific Lyn substrate 1” (Hcls1) are seven interactions reported; one protein interaction identified by AffinityCapture Western and reported by BioGRID, three interactions recorded by IntAct - physical association by 2-hybrid and anti bait co-immuno precipitation, one co-localization by imaging techniques and one direct interaction by a pull down experiments. The seventh interaction has been predicted by computational methods with directional information and has been reported by NetworKin; a phosphorization of the phosphoprotein Hcls1 by the Tyrosine-protein kinase Lyn. Some of the extracted information described above is discarded before constructing the network. For each proteinprotein interaction a Z-score, indicating similarity between the two proteins, is calculated. Links are only added to the network if they are below the threshold Z ≤ 2. Also the set of metabolic reactions is reduced before implementing them as links. If two proteins have a highly abundant metabolite, such as ATP or Water, as their only common substrate, this link will not be further regarded. To be exact, we have removed all chemicals from reactions between enzymes that do not transfer carbon-atoms, according to Ma & Zeng [12] and Arita [1]. The next step of the network construction is the addition of weights for nodes and links. The information for the weights is thereby derived from gene expression data from cells of the observed system. Ideally, two different measures are processed, a reference sample with normal conditions 4 http://www.thebiogrid.org/ 5 http://dip.doe-mbi.ucla.edu/dip/ 6 http://biocyc.org/ 7 http://www.genome.jp/kegg/ 8 http://www.pathguide.org/
and the comparison sample that was collected under special conditions, e.g. stress, drug insertion, or viral infection. The latter sample type can be a single measurement or a timeseries of gene expression measurements. The values of the comparison sample are normalized relative to the reference sample, i.e. values are equal or greater than zero; values below 1 indicate down-regulation; values above 1 indicate up-regulation. The normalized expression values, i.e. foldchanges, are used directly as node weights. For the edge weights, expression values for both adjacent nodes are taken into account. If only one value per node is available, a simple log cost is used, which is the logarithm of the sum of the two values (Equation 1). Some more complex cost functions can be chosen, but are not explained here. For time-series as values, the Pearson correlation (Equation 2) defines the cost function for the edge weights. Sometimes it is useful to use forward or backward Pearson correlations (Equation 3, 4). LC(X, Y ) = log(|X + Y |) P C(X, Y ) =
(E(XY ) − E(X)E(Y )) p V ar(X)V ar(Y )
(1)
(2)
F P C(X, Y ) = P C(X (2,n) Y (1,n−1) )
(3)
BP C(X, Y ) = P C(Y (2,n) X (1,n−1) )
(4)
Definition A network here is a directed, weighted graph G = (V, E, f, g) comprising a set of vertices (nodes) V and edges (links) E ⊆ V × V . Here f : V → R is a mapping that assigns each node v ∈ V its normalized expression value (or the mean of its values) as weight. The mapping g : E → R defines for each edge e = (v, w) ∈ E a weight according to the expression values of its nodes. For this mapping one of the above functions (LC,PC,FPC,BPC) is chosen. Some additional data structures are build up during the network construction. For every node in the network the cheapest incoming and outgoing links and pathways are stored. Hence we have four maps with information for all nodes. The maps for links and pathways contain similar information in the beginning, but the pathway map is updated during the pathway generation algorithm (Section II-C). The number of cheapest links and pathways that is stored is defined by the user. B. Sub-network Choice, Evaluation and Optimization Since we do not want to regard the entire network, we choose a set of corner points which we will call seed nodes. The set of seed nodes either stems from a prior analysis of the network or an arbitrary number of nodes with the highest node weights is chosen, which is then further improved. From these seed nodes we will span the sub-network. For this aim, we build all possible pairs of seed nodes and generate the kshortest simple pathways between them (Section II-C). Those pathways are then used to build up one particular sub-network of the original network.
As described above (Section II-A) all links are assigned weights from which we can calculate the pathway cost, as we will see in Section II-C. To obtain a score for the subnetwork, the costs of all relevant pathways that make up the sub-network are summed up. Assigning scores to the sub-networks allows for comparison of sub-networks spanned from different seed node sets. The first use of this will be to check to what extent the current seed nodes contribute to the sub-network score. If the contribution of a node is zero, this node will be discarded from the seed node set. Further, we can apply evolutionary optimization algorithms, such as simple hill-climbing, Monte Carlo Search or Genetic Algorithms on the seed node set, using the subnetwork cost as the fitness function. Seed nodes with low contributions will be exchanged with nodes apart from the seed nodes. If the new sub-network has a higher score, the replacement becomes permanent. Repeating in this way, the optimal sub-network can be found.
(a)
(b)
(c)
(d)
(e)
(f)
C. k-shortest simple Path Algorithm After determining the seed nodes and building all-to-all pairs, the k-shortest simple pathways (see Definition below) are generated in a forward/backward chaining approach. Starting from two opposite nodes, the seed and the target node, we expand the pathways that span between them (Figure 2b). In the network construction step (Section II-A) we created sets with shortest outgoing and incoming connections. From the seed node we will expand all links from the outgoing set. Accordingly, for the target we expand by the incoming link set. The nodes that were added during insertion of links to the seed node are now checked with all nodes connected to the target node. If a node is found that is part of pathways to both, seed and target node, then those pathways are connected, evaluated and stored (Figure 2c). In the next steps this procedure is repeated until no new nodes can be added anymore or the pathway lengths reach a certain user-defined threshold (Figure 2c-e). In each step the number of pathways from the seed or to the target, respectively, is reduced to a certain number, that is again specified by the user, before starting the next expansion cycle. Only the nodes added in the previous step are considered for the expansion. Further it is ensured that no duplicate nodes are inserted into a pathway. If a common node is found by the forward chaining from the source and the backward chaining from the target, all possible combinations between pathways from source to the common node and pathways from the common node to the target node are generated. This means, if we have m pathways ending in the common node and n pathways originating from the common node, m ∗ n complete pathways are produced. Redundant pathways are avoided by assigning unique pathway ID’s. The ID of a complete pathway is a combination of the ID’s of its two intermediary pathways, from source to common node and from the common node to the target, respectively. The check for duplicate nodes is done implicitly. During the expansion steps it is always ensured that the
Fig. 2. k-shortest simple Path Algorithm. Dark Red = Seed Node, Dark Blue = Target Node, Red = Expanded Nodes (forward), Blue = Expanded Nodes (backward), Light Red = Added Nodes (forward), Light Blue = Added Nodes (backward), Green = Common Node / Pathway Node. (a) The constructed network; (b) First Step: Expansion from Source and Target; (c) Second Step: Reduction to k’-shortest pathways (k’=4) and Expansion, first Common Node (green) found; (d) Third Step: Reduction + Expansion, Common Node found; (e) Fourth Step: Reduction, no new Expansion; (f) The four weighted shortest pathways through the network.
Fig. 3. Overview of tasks and message passing. In circles are the different process roles. Numbered are the tasks for each role. Edges describe the content and direction of the passed messages.
intermediary pathways do not contain duplicate nodes. Additionally, by determining common nodes in the forward and backward chaining procedures we make sure that the common node is the only intersection of the two pathways that are being combined. Hence, we generate simple (loop free) pathways. Finally, the cost of all pathways is calculated and the pathways are sorted by their cost. The cost of a pathway p is computed from the sum of the costs of all its links l ∈ Lp , divided by the pathway length (|L|, the number of links). Optionally, the former term can be divided by a power |L|k , with the pathway length as the base and a real number k > 0 as the exponent, if longer pathways (k > 1) or shorter pathways (k < 1) are preferred. P l∈Lp LinkCost(l) (5) P athwayCost(p) = |L|k From the final sorted list of pathways, the top k pathways are returned to the sub-network handling. D. Parallel Implementation The kPathA program is implemented in Java, using mpiJava for the communication between the parallel processing nodes. It is written for the use on Linux clusters, but works on several other platforms as well. The requirements for the platforms are working LAM/MPI or MPICH/MPI packages and the restrictions of the respective packages. The information exchange between the processes is done exclusively by message passing, thus, no shared memory is needed. Therefore, kPathA allows for real remote and distributed computing. Although kPathA can be run on an arbitrary number of parallel processes, a minimum of three processes is suggested, since three different roles will be assigned for the three distinct parts of the algorithm. These parts are
the sub-network handling (Section II-B) and the forward and backward chaining routines (Section II-C). There is one master process responsible for the sub-network handling and all other processes will be assigned either a forward chaining task or a backward chaining task. The network construction (Section II-A) is executed by all processes in the beginning. The communication between the single processes can be described as follows (Figure 3). After the computation of the seed node pairing, the master process assigns the task by sending to each process the information about its appointed role (forward or backward chaining), the seed nodes for this process and the corresponding partner process, as well as the address of the partner process for the further message interaction between forward and backward process. In return it receives acknowledgments of start and end of the computation from the respective processes. Using this information, the master process builds up and maintains lists of free and busy processes needed for the next round of assigning seed node pairs. After all pathway generation tasks are done, every process sends the k-shortest simple pathways, stored throughout the computation, to the master process.As the final step, the single k-shortest pathway sets are combined into one graph representing the response network. Additional communication is performed between the process pairs, i.e. the process responsible for the forward chaining part (source) and the corresponding process for backward chaining (target). After receiving the necessary information about the appointed task, as described above, the processes generates and expands the k-shortest simple pathways. With each expansion cycle, the backward chaining process sends all newly discovered nodes, one by one, to the partner process. The forward chaining process then checks if the received nodes occur in any of its pathways. It returns all found pathways in separate messages, or one message stating that no pathway was found. Finally the backward chaining process sends a notification message to its partner when it is done with the expansion, such that both process can stop their computation. III. A PPLICATION We have applied the algorithm to analyze response networks with respect to human host response against avian flu infections. For this purpose, Normal Human Bronchial Epithelial Cells (NHBE) have been infected by H5N1 influenza virus with a Multiplicity Of Infection (MOI) of 0.01. Gene expression data has been obtained by using an Agilent DNA chip 24h after Mock infection (no influenza infection baseline) and after infection with H5N1 virus. Gene expression values have been normalized and p-values calculated using a onesample Student’s t-test according to Agilent. Only data with p-values below a certain cutoff value were deemed to be statistically significant. The cutoff value was chosen such that less than one false positives can be expected per experiment. As outlined in section II-A, we used normalized expression values between 0h and 24h (fold-changes) as node weights
Fig. 4. Human response network after 24h of H5N1 influenza infection measured against Mock infection. The cell cycle controlling genes cdk2 and the cdc genes are prominently expressed and up-regulated by virus mediation, whereas the anti-inflammatory response genes f os/jun are down-regulated. Red nodes refer to up-regulated genes, blue nodes denote down-regulated genes, white nodes indicate genes with no changes in gene-expression. Yellow edges refer to high edge scores. Arrows denote metabolic reactions, no arrow-tips stand for protein-protein binding, diamonds indicate activation, Ts indicate inhibition of gene expression, circles refer to phosphorylation.
in the constructed human network. In the case that gene expression for a particular gene has not been measured or the measurement has been determined to be insignificant, a foldchange of 1, i.e. no change between baseline and measurement was assigned for this particular gene in the network. As we were focusing on a single normalized measurement at 24h, we were using a simple log cost (Eq. 1) to assign edge weights. Figure 4 shows a simple response network using this data after calculation by kPathA. The network has been pruned by allowing a maximum of k = 3 paths between each pair of seed nodes and by restricting the maximum weighted path length l to 13 or shorter. The response network identifies two well known processes affected by viral infections - immune response and cell cycle activation. The cell division cycle regulators (Cdc6, Cdca5 and Cdc45l) are prominently activated together with the minichromosome maintenance proteins (Mcm10, Mcm6, Mcm2). It is know that influenza virus infec-
tion modulates the cell cycle control and induces apoptosis by cell cycle arrest. The transcription factors Egr1, Jun and Fos are early responders during infection, inflammation and other cellular stress. Influenza infection seems to inhibit the early immune response triggered by this group of defense genes. A similar response has been reported by Djavani et al. (2007) after infection with the lymphocytic choriomeningitis virus (LCMV) in a monkey model for Lassa fever [4]. Interested to report with this respect is a regulatory network identified by Djavani et al. that includes Egr1, Egr2, Fos, Jun and Ptgs2 (Figure 5). In contrast to Djavani et al., Ptgs2, Il1ra and Il1rl19 are up-regulated. These results indicate moderately different host responses during different viral infections even for such a compact and highly connected network of major host responding genes. 9 Not
shown: as well as Il1r2
Fig. 5. A sub-network of the response network from Figure 4 (upper left corner) reveals interactions between the major gene products affected by virulent infections. This network is in accordance with Figure 5 of Djavani et al. (2007) [4]. In contrast to Djavani et al., Ptgs2, Il1ra and Il1rl1 (not shown: as well as Il1r2) are up-regulated. Egr1, Egr2, Fos, Fosb are transcription factors. Ptgs2 encodes prostaglandin-endoperoxide synthase 2, IL1A/B code for interleukin 1 and Il1rl1 belongs to the interleukin 1 receptor family. Color coding is according to Figure 4. Oval nodes refer to Gene Ontology terms of the “Biological Processes” sub-ontology with dashed arrows to the corresponding genes.
1000 l=8 l = 10 l = 12
computation time in s
800
600
400
200
0
3
4
5
6
7
8
9 10 # processors
11
12
13
14
15
Fig. 6. The reduction of computation time by parallel computation. For extensive computations, e.g. larger pathway length (green), the speedup is almost linear. However, it is limited by the message passing. Hence the flattening at the end of all curves.
IV. C ONCLUSION This paper has described the first strictly parallel implementation for solving the k-shortest simple path problem, .i.e., finding k-shortest loop-free paths between a pair of nodes in a network. We were motivated to develop this high performance computational method for the identification and analysis of weighted, so called, response networks in large biochemical network maps. The algorithm is versatile insofar, by accom-
modating weighted directional networks with different types of interactions. Weights have been calculated from experimental expression data by utilizing a variety of scoring functions, including arithmetic and geometric mean between expression levels of connected genes or correlation functions in the case of time-resolved expression data. The kPathA program has been implemented in Java, using mpiJava for the communication between the parallel processing nodes. It has been written for the use on Linux clusters, but can easily be implemented on several other platforms through LAM/MPI or MPICH/MPI as well. The information exchange between the processes is done exclusively by message passing, thus, no shared memory is needed. Therefore, kPathA allows for real remote and distributed computing such as Grid Computing, for example. We have tested the algorithm on a Fedora Linux compute cluster with up to 15 CPUs 10 (2x3.0 GHz and 4GB). Data for the computation originates from a hybrid human network consisting of 45,041 nodes and 438,567 interactions and gene expression information obtained from human cell-lines infected by influenza virus. Speedup of the computation is linear for large cut-off values for the maximal path-length l (Figure 6). For shorter cut-off values the processes spend most of their time in message passing and negotiating with the master node due to unsuccessful path-connection between the forward and backward chaining processes. Overall, we have developed a novel algorithm, kPathA, for the k-shortest simple path problem that is capable to identify response networks in large biochemical network maps. We have tested kPathA on a large human network together with human host response against viral influenza infection recorded by gene expression experiments. These response networks provide a window into potential cellular processes during the early innate immune response and virus triggered processes within human bronchial epithelial cells (Figure 4), e.g. for the identification of essential regulatory networks during early virus infection response (Figure 5. Especially under the imminent threat of a pandemic caused by novel influenza strains, such as the current H1N1 strain, these analyses are crucial for a comprehensive understanding of molecular processes during early phases of infection. Such a systems level understanding will aid in the identification of therapeutic markers and in drug development for diagnosis and finally prevention of a potentially dangerous disease. ACKNOWLEDGMENT The original version of the parallel algorithm has been implemented by Electra Sutton, who we gratefully acknowledge. We thank the VolkswagenStiftung for financial support. R EFERENCES [1] M. Arita, “The metabolic world of Escherichia coli is not small,” Proc. Nat. Acad. Sci. USA, vol. 101, pp. 1543–1547, 2004. [2] G. D. Bader, M. P. Cary, and C. Sander, “Pathguide: a pathway resource list,” Nucleic Acids Res., vol. 1, no. 34, pp. D504–506, 2006. 10 Results
computed on a larger number of CPUs are available upon request.
[3] L. Cabusora, E. Sutton, A. Fulmer, and C. V. Forst, “Differential network expression during drug and stress response,” Bioinformatics, vol. 21, no. 12, pp. 2898–2905, 2005. [4] Djavani MM, Crasta OR, Zapata JC, Fei Z, Folkerts O, Sobral B, Swindells M, Bryant J, Davis H, Pauza CD, Lukashevich IS, Hammamieh R, Jett M, , Salvato MS, “Early Blood Profiles of Virus Infection in a Monkey Model for Lassa Fever” J. Virol., vol. 81, no. 15, pp. 7960–7973, 2007. [5] F. Guerriero and R. Musmanno, “Parallel asynchronous algorithms for the k shortest paths problem,” JOTA, vol. 104, no. 1, pp. 91–108, 2000. [6] J. Hershberger, M. Maxel, and S. Suri, “Finding the k shortest simple paths: A new algorithm and its implementation,” in 5th Workshop on Algorithm Engineering and Experiments, ser. SIAM Conferences, 2003. ¨ gene network for navigating the literature” [7] Hoffmann R, Valencia A, A Nat. Genetics, vol. 36, pp. 664, 2004. [8] T. Ideker, O. Ozier, B. Schwikowski, and A. F. Siegel, “Discovering regulatory and signalling circuits in molecular interaction networks,” Bioinformatics, vol. 18 Suppl. 1, pp. S233–S240, 2002. [9] T. Ideker, V. Thorsson, J. A. Ranish, R. Christmas, J. Buhler, J. K. Eng, R. Bumgarner, D. R. Goodlett, R. Aebersold, and L. Hood, “Integrated genomic and proteomic analyses of a systematically perturbed metabolic network,” Science, vol. 292, pp. 929–934, 2001. [10] Kerrien S, Alam-Faruque Y, Aranda B, Bancarz I, Bridge A, Derow C, Dimmer E, Feuermann M, Friedrichsen A, Huntley R, Kohler C, Khadake J, Leroy C, Liban A, Lieftink C, Montecchi-Palazzi L, Orchard S, Risse J, Robbe K, Roechert B, Thorneycroft D, Zhang Y, Apweiler R, Hermjakob H, “IntAct Open Source Resource for Molecular Interaction Data,” Nucleic Acids. Res. vol. 35, pp. D561–D565, 2006.
[11] H. A. Krebs, “Urea formation in the animal body,” Z. physiol. Chem., vol. 210, pp. 33–66, 1932. [12] H. Ma, and A.-P. Zeng, “Reconstruction of metabolic networks from genome data and analysis of their global structure for various organisms,” Bioinformatics, vol. 19, pp. 270–277, 2003. [13] K. G. Mawuenyega, C. V. Forst, K. M. Dobos, J. T. Belisle, J. Chen, E. M. Bradbury, A. R. Bradbury, and X. Chen, “Mycobacterium tuberculosis functional network analysis by global subcellular protein profiling,” Mol. Biol. Cell, vol. 16, pp. 396–404, 2005. [14] V. N. Reddy, M. L. Mavrovouniotis, and M. N. Liebman, “Petri Net Representations in Metabolic Pathways,” in Proceedings of the 1st International Conference on Intelligent Systems for Molecular Biology, ISCB. AAAI Press, pp. 328–336, 1993. [15] E. Ruppert, “Finding the k shortest paths in parallel,” Algorithmica, vol. 28, no. 2, pp. 242–254, 2000. [16] Stark C, Breitkreutz BJ, Reguly T, Boucher L, Breitkreutz A, Tyers M, “BioGRID: a general repository for interaction datasets,” Nucleic Acids Res., vol. 34, pp. D535–D539, 2006. [17] A. Wagner, and D. A. Fell, “The small world inside large metabolic networks,” Proc. R. Soc. Lond. B, vol. 268, pp. 1803–1810, 2001. [18] A. Zien, R. K¨uffner, R. Zimmer, and T. Lengauer, “Analysis of gene expression data with pathway scores,” in Proceedings of ISMB’00, ISCB. American Association for Artificial Intelligence, pp. 407–417, 2000.