Karlsruhe Reports in Informatics 2011,16 Edited by Karlsruhe Institute of Technology, Faculty of Informatics ISSN 2190-4782
Defining and Quantifying Elasticity of Resources in Cloud Computing and Scalable Platforms
Michael Kuperberg, Nikolas Herbst, Joakim von Kistowski, Ralf Reussner
2011 KIT – University of the State of Baden-Wuerttemberg and National Research Center of the Helmholtz Association
Please note: This Report has been published on the Internet under the following Creative Commons License: http://creativecommons.org/licenses/by-nc-nd/3.0/de.
Defining and Quantifying Elasticity of Resources in Cloud Computing and Scalable Platforms Michael Kuperberg1 , Nikolas Herbst1 , Joakim von Kistowski1 , Ralf Reussner1 Informatics Innovation Center Karlsruhe Institute of Technology Karlsruhe, Germany
[email protected],
[email protected],
[email protected],
[email protected]
Abstract. Elasticity is the ability of a software system to dynamically scale the amount of the resources it provides to clients as their workloads increase or decrease. Elasticity is praised as a key advantage of cloud computing, where computing resources are dynamically added and released. However, there exists no concise or formal definition of elasticity, and thus no approaches to quantify it have been developed so far. Existing work on cloud computing is limited to the technical view of implementing elastic systems, and definitions or scalability have not been extended to cover elasticity. In this report, we present a detailed discussion of elasticity, propose techniques for quantifying and measuring it, and outline next steps to be taken for enabling comparisons between cloud computing offerings on the basis of elasticity. We also present preliminary work on measuring elasticity of resource pools provided by the Java Virtual Machine.
1
Introduction
In cloud computing [CA11], resources and services are made available over a network, with the physical location, size and implementation of resources and services being transparent. With its focus on flexibility, dynamic demands and consumptionbased billing, cloud computing enables on-demand infrastructure provisioning and “asa-service” offering of applications and execution platforms. Cloud computing is powered by virtualization, which enables an execution platform to provide several concurrently usable (and independent) instances of virtual execution platforms, often called virtual machines (VMs). Virtualization itself is a decades-old technique [CA11,EN05], and it has matured over many generations of hardware and software, e.g. on IBM System z mainframes [Spr10,TV04]. Virtualization comes in many types and shapes: hardware virtualization (e.g. PR/SM), OS virtualization (e.g. Xen, VMware ESX), middleware virtualization (e.g. JVM) and many more. Virtualization is a technique which has become very popular in industry and academia, leading to a large number of new products, business models and publications. Mature cloud computing platforms promise to approximate performance isolation: a struggling VM with saturated resources (e.g. 100% CPU load) should only minimally affect the performance of VMs on the same native execution platform. To implement this behaviour, a virtual execution platform can make use of a predefined maximum
2
allowed share of the native platform’s resources. Some platforms even provide facilities for runtime adaptation of these shares, and Cloud computing platforms which feature runtime and/or demand-driven adaptation of provided resources are often called elastic. Elasticity is the feature of automated, dynamic, flexible and frequent resizing of resources that are provided to an application by the execution platform. Elasticity can be considered as a key benefit of the cloud computing. In our definition, “application” can be an entire virtual machine and the corresponding execution platform would then be the hypervisor respectively host OS. Elasticity carries the potential for optimizing system productivity and utilization, while maintaining SLAs and QoS as well as saving energy and costs. The aim of this report is to offer a clear definition of resource elasticity in the context of cloud computing. Current research literature (e.g. [Chi10,CVRM+ 10,Woo01,JW00]) does not provide a definition of elasticity for the computing domain, and this report provides an initial step of doing so. Our strategic goal is to use resource elasticity metrics for achieving comparability between different cloud environments and offerings. The actuality and relevance of researching this topic can be confirmed by the Gartner study “Five refining Attributes of Public an Private Cloud Computing” [Gar09], where elasticity of virtual resources is stated as one central highlight of the modern cloud computing technology. Also, while the space of choices between cloud computing providers is getting wider, the means for comparing their features and service qualities are not yet finally developed. The term “elasticity” itself is already often used in advertisings of cloud infrastructure providers, as in Amazon’s “Elastic Compute Cloud - EC2” [vV11]. As an example for automated resizing actions, Amazon offers an automated scaling API for their EC2 clients, which is described in detail in [Ama10]. The client can control the number of virtual machine instances via policies, which observe the average CPU usage in an scaling group of virtual machine instances. The usefulness of these scaling features is demonstrated in a number of use cases within the manual, but Amazon has not yet published any numbers on how fast scaling actions are executed. Additionally, the scaling automatism is restricted to only control the number of VMs in a group by observing CPU usage. From a customer’s point of view, a finer granularity of automated/programmable scaling actions could be useful in the Amazon cloud, like resizing a VM’s virtual resources at runtime. The contribution of this report is the definition of resource elasticity based on the more general term of scalability. Until now, research on system scalability did not consider dynamic adaptation and also disregarded the temporal aspect. Our research builds on existing scalability metrics by additionally observing reaction times, extent and behaviour of automated virtual machine resizing activities. Scalability metrics have already been proposed by M. Woodside et al. in 2000 [JW00] by evaluating a system’s productivity at different levels of scale. These proposed metrics cannot express elasticity since they do not take the temporal aspect of automated scaling actions into account. The viewpoint of dynamic and adaptive scalability demands further observation and metrics on how often, how fast and how significantly scaling of a system’s provided resources can be executed. The remainder of this report is structured as follows: Sec. 2 introduces a more precise terminology for scalability and Sec. 3 defines elasticity. Sec. 4 presents our ap-
3
proach for measuring elasticity, with preliminary results shown in Sec. 5. Sec. 6 concludes and presents future work.
2
Scalability
Scalability is a term that can be applied both to applications and to execution platforms. In this section, we introduce a more precise terminology for scalability and discuss existing approaches to measuring it. Application scalability is a property which means that the application maintains its performance goals/SLAs even when an its workload increases (up to a certain workload bound). This upper workload bound defines a scalability range and highlights the fact that scalability is not endless: above a certain workload, the application won’t be able to maintain its performance goals/SLAs. Application scalability is limited by application’s design and by the use of execution platform resources by the application. In addition to a performance-savvy implementation (effective resource use, minimization of waiting and thrashing, etc.), application scalability means that the application must be able to make use of more/additional resources (e.g. CPU, network connections, threads in a thread pool) as the demand-driven workload increases. For example, an application which is only capable of actively using 2 CPU cores will not scale to an 8-core machine, as long as the CPU core is the limiting (“bottleneck”) factor. Of course, to exercise its scalability, the application must be “supported” by the execution platform, which must be able to provide the resources needed by an application. This means that when establishing metrics for quantifying scalability, the scalability metric values are valid for a given amount of resources and a given amount/range of service demand. One can then determine speedup for the same service demand with additional resources and efficiency as a measure of how good the application is using the provided resources. Correspondingly, platform scalability is the ability of the execution platform to provide as many (additional) resources as needed (or explicitly requested) by an application. In our terminology, an execution platform comprises hardware and/or software layers that an application needs to run. An example application can be an operating system (where the execution system comprises hardware and possibly a hypervisor) or web shop (where the execution platform comprises middleware, operating system and hardware). Other examples of execution platforms include IBM System z (for running z/OS and other operating systems), cloud environment (e.g. IBM CloudBurst [Clo10]) or a “stack” encompassing hardware and software (e.g. LAMP [Lee03]). The execution platform can be visible as a single large “black box” (the internal composition is not visible from outside) or as a set of distinguishable layers/components. There are two “dimensions” of platform scalability, and a system can be scalable in none, one or both of them: Scale vertically or scale up means to add more resources to a given platform node, like CPU cores or memory in a way that the platform node can handle a larger workload. By scaling up a single platform node, physical limits that impact bandwidth, computational power etc. are often reached quite fast.
4
Scale horizontally or scale out means adding new nodes (e.g. virtual machine instances or physical machines) to a cluster or distributed system in a way that the entire system can handle bigger workloads. Depending on the type of the application, the high I/O performance demands of the single instances that work on shared data often increase communication overheads and prevent the emergence of substantial performance gains, especially when adding nodes at bigger cluster sizes. In some scenarios, scaling horizontally may even result in performance degradation. Note that this definition of platform scalability does not include the temporal aspect: when scaling means that additional resources are requested and used, the definition of scalability does not specify how fast, how often and how significantly the needed resources are provisioned. Additionally, scalability is not a constant property: the state of the execution platform and the state of the application (and its workload) are not considered. In fact, scalability can depend on the amount of already provided resources, on the utilization of these resources, and on the amount of service demand (such as number of requests per second). Fig. 1 sketches a simplified, synthetic example of how a fixed allocation of available resources (i.e. no platform scalability) means that the response time rises with increasing workload intensity and diminishes when the workload intensity does the same. In Fig. 1, the response time rises monotonically with the workload intensity (and falls monotonically while workload intensity diminishes), but the reality may be more complicated.
Fig. 1. Schematic example of a scenario where execution platform is not scalable: the (idealized) correlation between application workload intensity and application response time
Fig. 2 in turn sketches how, on a scalable execution platform and with a fixed workload, the performance metric (response time) should be affected positively by addi-
5
tional resources. Note that in Fig. 2, the response time decreases monotonically with additional resources.
Fig. 2. Schematic example of a scenario with a fixed application workload and scalable execution platform: the (idealized) correlation between amount of resources provided by the platform and application response time
Jogalekar and Woodside [JW00] established a scalability metric based on productivity. To define scalability, they use a scale factor k (which is not further explained in [JW00]), and observe the three following metrics: – λ(k): throughput in responses/second at scale k, – f (k): average value of each response, calculated from its quality of service at scale k, – C(k): costs at scale k, expressed as a running cost (per second, to be uniform with λ) Productivity F (k) is calculated in [JW00] as the throughput delivered per second, divided by the cost per second: F (k) = λ(k)∗f (k)/C(k). Then, Jogalekar and Woodside postulate that “if productivity of a system is maintained as the scale factor k changes, the system is regarded as scalable”. Finally, the scalability metric ψ relating systems at two different scale factors is then defined as the ratio of their productivity figures: F (k2 ) ψ(k1 , k2 ) = F (k1 ) . While this definition of scalability allows to compare the scalability from the workload (or application) view, it does not allow to compare execution platforms, as the metric is specific for a given workload. Additionally, the definition assumes a “stable state” and does not consider the actual process of scaling, where resource allocations are being adapted.
6
Therefore, our definition of elasticity will not be based on the scalability definition in [JW00]. In the next section, we present a platform-centric definition of elasticity which considers temporal and quantitative aspects of execution platform scaling.
3
Elasticity
When service demand increases, elastic cloud platforms dynamically add resources (or make more resources available to a task). Thus, elasticity adds a dynamic component to scalability - but how does this dynamic component look? On an ideal elastic platform, as application workload intensity increases, the distribution of the response times of an application service should remain stable as additional resources are made available to the application. Such an idealistic view is shown by the synthetic example in Fig. 3, which also includes dynamic un-provisioning of resources as the application workload decreases. Note that the dynamic adaptation is a continuous (non-discrete) process in Fig. 3.
Fig. 3. Schematic example of an (unrealistically) ideal elastic system with immediate and fullycompensating elasticity:
However, in reality, resources are actually measured and provisioned in larger discrete units (i.e. one processor core, one page of main memory, etc.), so a continuous idealistic scaling/elasticity cannot be achieved. On an elastic cloud platform, the performance metric (here: response time) will rise as workload intensity increases until a certain threshold is reached at which the cloud platform will provide additional resources. Until the application detects additional resources and starts making use of them, the performance will recover and improve - for example, response times will drop. This means that in an elastic cloud environment with changing workload intensity, the response time is in fact not as stable as it was in Fig. 3.
7
Now that we have determined a major property of elastic systems, the next question is: how to quantify elasticity of a given execution platform? The answer to this question is provided by Fig. 4 - notice that it reflects the previously mentioned fact that the performance increases at certain discrete points. When quantifying to define and to measure elasticity, we have to quantify the temporal and quantitative properties of those points at which performance is increased.
Fig. 4. Schematic example of an elastic system
3.1
A Definition of Elasticity
Changes in resource demands or explicit scaling requests trigger runtime adaptations of the amount of resources that an execution platform provides to applications. The magnitude of these changes depends on the current and previous state of the execution platform, and also on the current and previous behaviour of the applications running on that platform. Consequently, elasticity is a multi-valued metric that depends on several runtime factors. This is reflected by the following definitions, which are illustrated by Fig. 5: Elasticity of execution platforms consists of the temporal and quantitative properties of runtime resource provisioning and unprovisioning, performed by the execution platform; execution platform elasticity depends on the state of the platform and on the state of the platform-hosted applications. Reconfiguration point is a timepoint at which platform adaptation (resource provisioning or unprovisioning for an application) becomes effective to that application. A reconfiguration point is preceded by a reconfiguration phase, which may or may not be visible to the application.
8
Fig. 5. Three aspects of the proposed elasticity metric
Note that a reconfiguration point is different from (and later than) an eventual triggering point (which starts the reconfiguration phase), and also note that the effects of the reconfiguration may become visible some time after the reconfiguration point, since an application needs time to adapt to the changed resource availability. Also note that while reconfiguraiton points and the timepoint of visibility of effects may be measurable, the triggering points may not be directly observable. There are several characteristics of resource elasticity, which (as already discussed above) are parametrised by the platform state/history, application state/history and workload state/history: Effect of reconfiguration is quantified by the amount of added/removed resources and thus expresses the granularity of possible reconfigurations/adaptations. Temporal distribution of reconfiguration points describes the density of reconfiguration points over a possible interval of a resource’s usage amounts or over a time interval. Reaction time is the time interval between the instant when a reconfiguration has been triggered/requested and until the adaptation has been completed. An example for reaction time would be the time between the request for an additional thread and the instant of actually holding it. An example matrix describing elasticity characteristics of an execution platform is given in Fig. 6 for a hypothetical cloud platform. Each resource is represented by a vector of the three aforementioned key elasticity characteristics. 3.2
Possibilities of a single-valued Elasticity Metric
An open question is whether a single metric that captures the three key elasticity characteristics is possible and meaningful. One challenge of defining such a metric would be to capture state dependencies, as well as selecting a value range that would maintain the applicability of the metric to future, more powerful and more complex systems.
9
Fig. 6. Elasticity matrix for an example platform
A unified (single-valued) metric for elasticity of execution platforms could possibly be achieved by a weighted product of the three characteristics. To get intuitively understandable values, elasticity could be measured and compared on the basis of percentage values. 0% resource elasticity would stand for no existing reconfiguration points, high or infinite reaction times (which would mean just manual reconfiguration) and very high effects of resizing actions, e.g. new instantiations, when performance problems have already been discovered or reported) near 100% resource elasticity would hint towards a high density of reconfiguration points, low reaction time and small effects. In the optimal case the virtualized system’s usage appears to be constant, while the number of users and resource demand vary. This could achieve optimal productivity concerning costs or energy consumption in a cloud environment. We currently consider further research on a unified elasticity metric as future work. If such a metric can be established, elasticity of cloud platforms could easily be compared. A proactive system which implements resource provisioning techniques like described in [CEM+ 10,HWIL09,KKK10,ZA10,MIK+ 10] should exhibit better values of resource elasticity than a simple reactive system which triggers resource requests or releases by events and which does not perform workload prediction or analysis.
4
Towards Measuring Elasticity
In general, the effects of scalability are visible to the user via observable response times or throughput values at a certain system size. On the other hand, the elasticity, namely the resource resizing actions, may be invisible to the user due to their shortness or due to the transparency of resource provisioning in cloud computing. Therefore, measuring resource elasticity from a client’s perspective is likely to require indirect measurements and approximations, whereas measuring the resource elasticity on the “server side” (i.e. directly on the execution platform) is more promising. 4.1
Need for Intelligently Designed Workloads
Intelligently designed workloads are extremely important when trying to witness elastic effects. A constant workload for example will never produce elastic effects on its own. In order to witness elastic effects workloads have to push the boundary of what already
10
provisioned resources can offer them, only then will a drop in performance and after that an increase be visible. One important aspect of designing workloads for elasticity benchmarking is to understand in which way the targeted execution platform scales and the triggering events which lead to elasticity. One example focusing on IBM Workload Manager (WLM) application can be found in [TV04]: When a low-priority process p1 is working alone on the execution platform, it can consume (almost) all available resources. Yet when a process p2 with a higher priority begins execution and demands resources currently used by process p1, the execution platform will re-assign resources to p2. Thus, the elasticity benchmark needs to explore the interplay between processes with different priorities. Additionally, as the resource demands of p2 rises, p1 will also have to release more and more of its resources to be assigned to p2. In this case we can witness elastic effects as p2’s service demand and performance rise at the same time when new resources are provided to p2. Until now, existing benchmarks did not provide the functionality of workloads with the purpose of increasing workloads specifically to force resource reallocation. 4.2
An Approach for Measuring Resource Elasticity of Thread Pools
The evaluation concept of resource elasticity can be applied to various kinds of resources, even to virtualized ones that are not directly mapped to hardware resources. As a starting point and a proof-of-concept, we are now researching the elasticity behaviour of Java thread pools. Thread pools are an implementation of the pooling pattern, which is based on a collection (pool) of same-typed, interchangeable resources that are maintained continuously. Thread pools are heavily used in databases, application servers and other middleware/applications handling many concurrent requests. Similar to thread pools, connection pools (in DBMS drivers, such as JDBC) implement the pooling pattern with the same rationale. In a resource pool, even when a given resource instance in the pool is not needed, it is not released immediately because it is assumed that the instance may be needed in the near future: the runtime costs of releasing and (later) re-acquiring that resource are significantly higher than the costs of keeping an idle instance. After a certain time interval, the resource can be released when it hasn’t been used - this “disposal delay” can be often be set in the implementations of the pool pattern. Beyond “disposal delay”, further configuration options are the minimum pool size (often called “core size”), the maximum pool size and the length of the queue that resides “in front of” the pool. For this report, we use the default thread pool implementation provided by the Java SE platform API, and the threads have to perform non-communicating, CPU-bound computation-only tasks in parallel. These task that form a configurable, multi-phased workload which we describe further below. The tasks consist of carefully-defined Fibonacci computation, with randomly-chosen starting values (to prevent function inlining as constant values), and with evaluation of the computation result (to prevent dead code elimination). We are especially interested in situations where the thread pool size increases in a “preventive” way, i.e. a pool where all threads are busy, and one arriving tasks triggers the addition of two new threads to the pool, even though just one new thread would be
11
sufficient. We are also interested in situations with a “fully-busy” where the arrival of a new task and the finish of another task’s execution are temporally close, to see whether the pool immediately “overreacts” by allocating a new thread instance and accepts the task from the queue, rather than waiting for a (short) time in the hope that another task will be finished. In line with the elasticity metrics defined in Sec. 3.1, we want to measure the decreases/increases of the thread pool size (effects of reconfiguration) and the temporal aspects of the adaptation (delays, provisioning duration, etc.). At the beginning of each measurement, we run a warmup period of the task and measurement methods to avoid effects of Java Just-In-Time compiler (JIT) optimisations and method inlining. Once the maximum thread pool size has been reached, if all instances in the pool are busy performing work and the queue is full, rejection of incoming tasks will occur. In our implementation, rejections of tasks are logged and taken into account when interpreting measurement results. Our tooling includes the functionality to calibrate the problem size of a single Fibonacci task so it takes a certain duration (e.g. 50 ms). The calibration allows us to run the same workload on several with (approximately) same duration of the task. The workload is composed from tasks by specifying inter-task arrival times, as well as grouping tasks in batches (with separate specification of intra-batch and inter-batch arrival times). We measure and protocol task arrival times and task finish times using fine-granular wall-clock timer (selected in a platform-specific way using [KKR09]). A separate “measurer” thread outside of the thread pool runs with the maximum priority, and records the state of the thread pool and the state of its queue. While the measurer runs in a loop, only changes in the thread pool state are recorded, keeping the logs small. One of the challenges consists in capturing the changes in the thread pool state - this requires a tight measurer loop and short (or no) intervals between measurements, while eliminating longer pauses (e.g. those caused by the Java Garbage Collection).
5
Preliminary Results
In this section, we present our results of measuring elasticity of the thread pool resource, following the approach presented in Sec. 4.2. We used the high-resolution time provided by the sun.misc.Perf class, which has an accuracy of 1 ns on the used computer. We permitted the benchmark to allocate up to 900 MB of Java heap memory to minimize interference, and used the standard thread pool implementation of the Java platform API, found in the java.util.concurrent package. The Java thread pool is set up with a synchronous blocking queue of length 2, a core size of 2 threads and a maximum pool size of 80. The core size of the thread pool is not equal to the minimum or initial pool size: even if the core size is set to 2, the JVM may initialize the pool to have 1 active thread. The official Java platform API documentation explains that when “a new task is submitted [...], and fewer than corePoolSize threads are running, a new thread is created to handle the request, even if other worker threads are idle. If there are more than corePoolSize
12
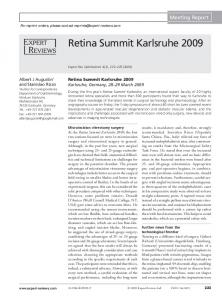
but less than maximumPoolSize threads running, a new thread will be created only if the queue is full” [Ora10]. The measured workload is a series of batches and is designed as follows: the initial batch size is 2 tasks, with inter-task wait time of 10 ms. After an inter-batch wait time of 40 ms, the second batch with three tasks and the same inter-task wait time is started. For each next batch, the number of tasks increases by one, the inter-batch wait time increases by 4 ms, and the inter-task wait time stays the same. The workload intensity reaches its peak when the batch contains 12 tasks, and afterwards decreases again. Each decrease is characterised by making the batch size less by one, and decreasing the interbatch wait time by 4 ms. The last batch of the workload again contains two tasks. Recall that by design of the thread pool, the number of actively processed tasks is equal to or smaller than the number of the threads in the pool. Fig. 7 show the results of measurements on a computer with a 2.8 GHz Intel Core 2 Duo CPU (T9600), 4 GB of RAM, running Mac OS X 10.6.4 and Apple Java HotSpotTM 64-Bit Server VM (build 19.1-b02-334, mixed mode). The individual measurements (“dots”) have been connected by a line to improve readability, even though the measurements are of course non-continuous. Correspondingly, in Fig. 7, the number of threads in the pool is the upper (red) line and the number of tasks processed by the pool is the lower (blue) line. In Fig. 7, elasticity is characterized by the space between the two curves (the number of threads in the pool and the number of tasks processed by the pool). The elasticity of the thread pool is clearly visible, since the size of the pool grows and decreases depending on the workload, i.e. on the number of tasks to be processed. At the beginning (until around 500 ms on the x axis), the pool contains just one thread and a few tasks are coming in, with enough time between them for the single thread to finish them so that no concurrent task processing is needed. Shortly after 500 ms, two tasks are to be processed by the pool at the same time, so that the number of the threads in the pool increases. Note that the thread pool size increases from one thread to two threads before the second task starts being processed - here, it can be seen that it takes the pool some time between the pool size increase and the second task’s acceptance - it should be noted that the second task was staying in the pool queue until the second thread became available. Since we record the timestamp of a task’s initialisation and submission to the thread pool, we know the timepoint of the triggering action and we are able to measure both the time between the triggering point and the reconfiguration point, and the time between the reconfiguration point and the timepoint of visibility (when the second task starts to be processed by the pool). Another important thing to note from Fig. 7 is that the thread pool is not overly elastic: between 500 ms and 1,000 ms, we see several recordings of the number of actively processed tasks in the pool falling from two to one, while the thread pool size stays at two. Also, note that the “scaling down” of the pool is not strictly a delay-determined behaviour. For example, compare the very first time when the number of tasks falls from two to one (at ca. 700 ms), and the very first time when the number of tasks falls from four to three (at ca. 1,100 ms). When the number of tasks falls from four to three,
0
1
2
3
4
5
6
7
8
9
10
11
12
13
0
250
500
750
1.000
1.250
1.500
1.750
2.000
2.250
2.500
3.000
3.250
3.500
7_tasks_active
Wall-clock time in milliseconds 4_threads_pool_size_at_runtime
2.750
3.750
Thread pool size vs. number of active tasks
4.000
4.250
4.500
4.750
5.000
5.250
5.500
5.750
6.000
6.250
13
Fig. 7. Elasticity of a Java thread pool on a MacBook laptop. Legend: the upper (red) line is the number of threads in the pool; the lower (blue) line is the number of tasks processed by the pool.
Thread pool size vs. number of active tasks
14
the thread pool size follows after a certain delay - however, even after the same delay has passed in the case where the number of tasks falls from two to one, the thread pool keeps its size at 2, and does not “scale down”. The delayed “scaling down” is visible over the entire course of the measurement. Considering “scaling up”, the conservative and economical thread pool size adjustment is clearly visible: the thread pool size grows only by one thread, never by two or more threads. Also, with the exception of the “overallocation” of 11 threads (at ca. 3,500 ms, where 10 threads would have sufficed), the thread pool size is always “matched” by the number of tasks. In other words, the overallocation only occurs at that instant, which is happens to be the maximum pool size. In Figure 8, the same workload has been measured on an IBM z10 mainframe [z1010], running in a z/OS 1.12 logical partition (LPAR). The LPAR makes use of 5 CPUs (running at 3,5 GHz) and 5120 MB of main memory, and the thread pool code was the only workload in this LPAR during measurements. It can be seen in Figure 8 that not only the total running time changes (due to a faster CPU), but also the thread provisioning behaviour is different. For example, the maximum number of threads on z10 is 22, whereas on the MacBook laptop it is only 11. It remains to be researched whether increasing the degree of concurrency by “flooding” the pool with more task would lead to a more “generous” (over-)allocation of threads in the pool. Likewise, we will present statistics on the elasticity metrics in future work.
6
Conclusion and Future Work
In this report, we have presented a definition of resource elasticity in the context of cloud computing and virtualization. Starting with a definition of scalability, we have added temporal and quantitative aspects to define elasticity, and have presented the challenges of measuring elasticity in real-world scenarios. Finally, we have used thread pools as an elastic resource of the Java Virtual Machine, and presented preliminary results of running a novel elasticity benchmark which showcases the elastic behaviour of the thread pool resource. As follow-up on the presented initial research, we plan to perform in-depth measurements of elasticity values for thread pools and other elastic resources/platforms, incl. resources in cloud computing environments. We plan to study elasticity on industrygrade computers, such as the IBM System z mainframe of the Informatics Innovation Center. In this context, we are investigating the capabilities of IBM Workload Manager (WLM) and similar tools. Our particular attention will be on the “parameter space” of resources/platforms, and also on how the state/history of resources and state/history of the workload affects the elasticity. Additionally, we will take costs into impact so that elasticity-cost tradeoffs can be identified and studied. The planned elasticity benchmarks will also explore the boundaries of elasticity and scalability. We will also look into possible negative performance effects of elasticity, e.g. when the additional resource is only needed for a short time, but adding that resource instance (e.g. a CPU core) incurs such an overhead that the overall performance decreases. For
0
1
2
3
4
5
6
7
8
9
10
11
12
13
14
15
16
17
18
19
20
21
22
23
24
0
100
200
300
400
500
600
700
800
900
1.000
1.100
1.400
1.500
1.600
7_tasks_active
Wall-clock time in milliseconds
1.300
4_threads_pool_size_at_runtime
1.200
1.700
Thread pool size vs. number of active tasks
1.800
1.900
2.000
2.100
2.200
2.300
2.400
2.500
2.600
2.700
2.800
2.900
15
Fig. 8. Elasticity of a Java thread pool using a z/OS LPAR on IBM z10 mainframe. Legend: the upper (red) line is the number of threads in the pool; the lower (blue) line is the number of tasks processed by the pool.
Thread pool size vs. number of active tasks
16
example, we will look into (negative and/or positive) caching effects which are relevant when adapting the memory allotment of an application/VM at runtime. One of the challenges we will need to address is the frequent impossibility of direct resource measurements: while we were able to query the Java thread pool about its state (number of tasks and threads), this may not be the case for other resources or for commercial cloud software vendors. Thus, we will need to make use of inference algorithms such as Kalman filters. As cloud computing relies on virtualization, we will study the impact of virtualizing an elastic resource or an elastic platform. For example, assume that for platform technology A, a Java thread pool is mapped to native or “artificial” threads/processes in a given way - however, running an instance of A as a guest (virtual machine) on host that is of platform technology B may affect the mapping of (now virtualized) threads. Studying the impact of virtualization on elastic resources/platforms will help to answer the deployment or relocation questions that are asked by people in industry and academia. We also plan to apply our research to commercial “cloud hosters”, such as Amazon EC2 [vV11]. In the long term, we target a configurable benchmark suite with a workload mix, so that different “cloud hosters” can be compared in terms of elasticity. Acknowledgements: we would like to thank Fabian Brosig, Nikolaus Huber and Samuel Kounev for their helpful reviews and comments. The installation of the z10 mainframe at the Informatics Innovation Center in Karlsruhe has been made possible by IBM B¨oblingen Research & Development GmbH, and we thank Thomas Klein, G¨unter Fehrenbach, Erich Amrehn, Ingrid Schwarz-Hartmann, Martin M¨ahler and Uwe Denneler for their continuing support.
References [Ama10]
Amazon Web Services. Auto Scaling Developer Guide (API Version 2010-08-01) http://docs.amazonwebservices.com/AutoScaling/latest/DeveloperGuide/, 2010. [CA11] Massimo Cafaro and Giovanni Aloisio. Grids, Clouds and Virtualization. Computer Communications and Networks. Springer-Verlag London Limited, London, 2011. [CEM+ 10] Clovis Chapman, Wolfgang Emmerich, Ferm´ın Gal´an M´arquez, Stuart Clayman, and Alex Galis. Software architecture definition for on-demand cloud provisioning. In Proceedings of the 19th ACM International Symposium on High Performance Distributed Computing, HPDC ’10, pages 61–72, New York, NY, USA, 2010. ACM. [Chi10] David Chiu. Elasticity in the cloud. ACM Crossroads, 16:3–4, March 2010. [Clo10] IBM CloudBurst V2.1 on Power Systems helps IT organizations rapidly provide dynamic cloud services, 2010. http://www03.ibm.com/systems/power/solutions/cloud/cloudburst/, last consulted on May 23rd, 2011. [CVRM+ 10] Juan Ciceres, Luis M. Vaquero, Luis Rodero-Merino, Alvaro Polo, and Juan J. Hierro. Service scalability over the cloud. In Borko Furht and Armando Escalante, editors, Handbook of Cloud Computing, pages 357–377. Springer US, 2010. [EN05] James E.Smith and Ravi Nair. Virtual machines : versatile platforms for systems and processes. Morgan Kaufmann, San Francisco, CA, 2005.
17 [Gar09]
[HWIL09]
[JW00] [KKK10]
[KKR09]
[Lee03] [MIK+ 10]
[Ora10]
[Spr10]
[TV04] [vV11] [Woo01]
[z1010] [ZA10]
Gartner. Five refining attributes of public and private cloud computing, 2009. http://www.gartner.com/DisplayDocument?doc cd=167182, last consulted on May 23rd, 2011. Ye Hu, Johnny Wong, Gabriel Iszlai, and Marin Litoiu. Resource provisioning for cloud computing. In Proceedings of the 2009 Conference of the Center for Advanced Studies on Collaborative Research, CASCON ’09, pages 101–111, New York, NY, USA, 2009. ACM. Prasad Jogalekar and Murray Woodside. Evaluating the scalability of distributed systems. IEEE Trans. Parallel Distrib. Syst., 11:589–603, June 2000. Hyukho Kim, Woongsup Kim, and Yangwoo Kim. Predictable cloud provisioning using analysis of user resource usage patterns in virtualized environment. In Tai-hoon Kim, Stephen S. Yau, Osvaldo Gervasi, Byeong-Ho Kang, and Dominik Stoica, Adrian, editors, Grid and Distributed Computing, Control and Automation, volume 121 of Communications in Computer and Information Science, pages 84– 94. Springer Berlin Heidelberg, 2010. Michael Kuperberg, Martin Krogmann, and Ralf Reussner. TimerMeter: Quantifying Accuracy of Software Times for System Analysis. In Proceedings of the 6th International Conference on Quantitative Evaluation of SysTems (QEST) 2009, 2009. Brent Lee, James B. ; Ware. Open source Web development with LAMP : using Linux, Apache, MySQL, Perl, and PHP. Addison-Wesley, Boston, Mass., 2003. Xiaoqiao Meng, Canturk Isci, Jeffrey Kephart, Li Zhang, Eric Bouillet, and Dimitrios Pendarakis. Efficient resource provisioning in compute clouds via vm multiplexing. In Proceeding of the 7th international conference on Autonomic computing, ICAC ’10, pages 11–20, New York, NY, USA, 2010. ACM. Oracle Corporation. Documentation of the class java.util.concurrent.ThreadPoolExecutor, 2010. http://download.oracle.com/javase/1.5.0/docs/api/java/util/concurrent/ThreadPoolExecutor.html; last consulted on May 23rd, 2011. Wilhelm G. Spruth. System z and z/OS unique Characteristics. Technical report, Universit¨at T¨ubingen, 2010. http://tobias-lib.uni-tuebingen.de/volltexte/2010/4710, last consulted on May 23rd, 2011. M. Teuffel and R. Vaupel. Das Betriebssystem z/OS und die zSeries. Oldenbourg Wissenschaftsverlag GmbH, 2004. Jurg van Vliet. Programming Amazon EC2. OReilly, 1st edition, 2011. Murray Woodside. Scalability metrics and analysis of mobile agent systems. In Tom Wagner and Omer Rana, editors, Infrastructure for Agents, Multi-Agent Systems, and Scalable Multi-Agent Systems, volume 1887 of Lecture Notes in Computer Science, pages 234–245. Springer Berlin / Heidelberg, 2001. System z10 BC Data Sheet, 2010. http://www03.ibm.com/systems/z/hardware/z10bc/, last consulted on May 23rd, 2011. Qian Zhu and Gagan Agrawal. Resource provisioning with budget constraints for adaptive applications in cloud environments. In Proceedings of the 19th ACM International Symposium on High Performance Distributed Computing, HPDC ’10, pages 304–307, New York, NY, USA, 2010. ACM.