Internet of Things and Big Data. ... deal with heterogeneous concept drift, i.e different drift types ... learning, it is assumed that the complete task specific data is.
KNN Classifier with Self Adjusting Memory for Heterogeneous Concept Drift Viktor Losing∗† , Barbara Hammer∗ and Heiko Wersing† ∗ Bielefeld
† HONDA
University, Universit¨atsstr. 25, 33615 Bielefeld Research Institute Europe, Carl-Legien-Str. 30, 63073 Offenbach am Main
Abstract—Data Mining in non-stationary data streams is gaining more attention recently, especially in the context of Internet of Things and Big Data. It is a highly challenging task, since the fundamentally different types of possibly occurring drift undermine classical assumptions such as data independence or stationary distributions. Available algorithms are either struggling with certain forms of drift or require a priori knowledge in terms of a task specific setting. We propose the Self Adjusting Memory (SAM) model for the k Nearest Neighbor (kNN) algorithm since kNN constitutes a proven classifier within the streaming setting. SAM-kNN can deal with heterogeneous concept drift, i.e different drift types and rates, using biologically inspired memory models and their coordination. It can be easily applied in practice since an optimization of the meta parameters is not necessary. The basic idea is to construct dedicated models for the current and former concepts and apply them according to the demands of the given situation. An extensive evaluation on various benchmarks, consisting of artificial streams with known drift characteristics as well as real world datasets is conducted. Thereby, we explicitly add new benchmarks enabling a precise performance evaluation on multiple types of drift. The highly competitive results throughout all experiments underline the robustness of SAM-kNN as well as its capability to handle heterogeneous concept drift.
I.
I NTRODUCTION
In the classical batch setting of data mining / machine learning, it is assumed that the complete task specific data is all time available and can be accessed simultaneously without any restriction regarding the processing time. Furthermore, the i.i.d. property as well as stationary environments are presumed. State of the art machine learning methods are able to obtain very accurate results within this framework. However, an ever growing field of real world applications generates data in streaming fashion at increasing rate, requiring large-scale and real-time processing. Streaming data is prevalent in domains such as health monitoring, traffic management, financial transactions, social networks [1], [2] and is the foundation of the Internet of Things [3] technology. Supplementing streaming data with non-stationary environments leads to one of the recent key areas in data mining research: Learning in streams under concept drift. Here, algorithms are challenged by a variety of possible forms of drift under strict limitations in terms of memory consumption and processing time. In recent years, a few algorithms have been published able to handle specific types of drift such as abrupt [4], incremental [5] as well as reoccurring [6] drift. Even though some methods can be used for several types of drift by an according setting of their meta parameters, this requires explicit prior knowledge about the task at hand. However, it is still unclear
how to identify the type of drift in a given real world data stream. Furthermore, in real world applications, data usually do not change only in one specific form, but instead multiple, sometimes even concurrent, types of drift are taking place at various rates. One example is the field of personalized assistance, in which individual user behavior is taken into account to provide appropriate assistance in various situations [7]. But, individual behavior in particular can change in arbitrary ways. Systems anticipating only certain forms of drift, will perform sub-optimal at best, or fail completely at worst, when unexpected forms of change occur. Our Self Adjusting Memory (SAM) in combination with the k Nearest Neighbor (kNN) classifier [8] is able to cope with heterogeneous concept drift and can be easily applied in practice without any parametrization. It exhibits several analogies to the structure of the human memory as we explicitly partition knowledge among a short- and long-term memory. To enable a proper analysis of algorithms in terms of suitability for certain forms of drift we do not only contribute new artificial benchmarks with ground truth drift type but also vision based real world datasets recorded outdoors: An environment where concept drift is naturally present. Our extensive evaluation on these as well as on common benchmarks demonstrates the gain of SAM-kNN in comparison to current state of the art approaches. It exclusively achieves highly competitive results throughout all experiments, demonstrating its robustness and the capability of handling heterogeneous concept drift.
II.
F RAMEWORK
Our focus is data stream classification under supervised learning for incremental/on-line algorithms. The aim in supervised classification is to predict a target variable y ∈ {1, . . . , c} given a set of features x ∈ Rn . In the classical batch setting an algorithm generates a model h based on a training set Dtrain = {(xi , yi ) | i ∈ {1, . . . , j}}. For convenience we alternatively use the notation y(xi ) = yi . In the subsequent test phase the model is applied on another set Dtest = {(xi , yi ) | i ∈ {1, . . . , k}}, whose labels are kept hidden. The model predicts a label yˆi = h(xi ) for every point xi ∈ Dtest and the 0-1 loss L(ˆ yi , yi ) = 1(ˆ yi 6= yi ) is calculated.
A. Streaming data Data stream classification is usually evaluated in the online learning setting, often called Interleaved Test-Train. A potentially infinite sequence S = (s1 , s2 , . . . , st . . .) of tuples si = (xi , yi ) arrives one after another. As t represents the current time stamp, the learning objective is to predict the corresponding label yt for a given input xt , which is supposed to be unknown. The prediction yˆt = ht−1 (xt ) is done according to the previously learned model ht−1 . Afterwards, the true label is revealed and the loss L(ˆ yt , yt ) determined. Before proceeding with the next example, the applied learning algorithm generates a new model ht on the basis of the current tuple st and the previous model ht−1 : ht = train(ht−1 , st ). The Interleaved Test-Train error for a sequence up to the current time t is given by: t
E(S) =
1X 1(hi−1 (xi ) 6= yi ). t i=1
(1)
Algorithms applied for streaming data face the challenge of anytime model adaption, furthermore, the examples have to be processed in incoming order, often violating the assumption of sample independence. Methods handling concept drift are, in addition, coping with non-stationary environments, characterized by a change of the underlying data generation process. B. Concept Drift Concept drift [9] occurs when the joint distribution Pt (x, y) changes for at least two time steps t0 and t1 : ∃ x : Pt0 (x, y) 6= Pt1 (x, y), The joint distribution can also be written as: Pt (x, y) = Pt (x)Pt (y|x), where Pt (x) is the distribution of the features and Pt (y|x) the posterior probability of the classes. The term real drift is used to specify that the relation between observation and labels Pt (y|x) varies over time. Virtual drift is present when the feature distribution Pt (x) changes without affecting the posterior of the classes Pt (y|x). Furthermore, the rate at which drift is taking place can be classified either as abrupt, resulting in a severe shift within the distribution, e.g. caused by a malfunctioning sensor, or incremental, an evolving change over time, e.g. evoked by a slowly degrading sensor. In the context of seasonal effects, drift is often characterized as reoccurring to describe that previous concepts are repeatedly emerging. III.
R ELATED W ORK
Algorithms dealing with concept drift can be roughly divided in active and passive approaches [10]. Active approaches explicitly detect the time of change t and usually discard the accumulated knowledge up to this point. Often statistics of windows, covering different time periods, are analyzed for significant deviations. The most common statistic is the classification error [4], [11] but measures as the Kullback Leibler divergence, evaluating the distance between
the probability distributions of two different windows [12], are used as well. ADaptive sliding WINdowing (ADWIN) [11] efficiently monitors the binary error history (it could be any i.i.d. value between 0 and 1) in a window containing all values since the last detected change. The window is repeatedly partitioned into two sub-windows of various size. Whenever the difference of their average error exceeds a threshold, depending on the size of the sub windows and a confidence parameter, a change is detected and the older window is dropped. Active approaches are often combined with a sliding window containing the most recent examples, as these are assumed to be the most valuable for current predictions. Hereby, the size is a trade-off between fast adaptation (small window) and good generalization in stable phases without drift (large window). To achieve both properties at the same time the size is adjusted dynamically. In the Probabilistic Adaptive Windowing (PAW) [13] examples from the window are removed randomly leading to a mix of recent and older instances. The window size is not strictly bounded and varies around a target size. ADWIN is used as change detector and the window is cleared accordingly. This approach is coupled with the kNN classifier and achieves a low error rate in the experiments. The size of the sliding window can also be adapted by using a heuristic [14], or by minimizing the amount of errors in the past: Klinkenberg et al. present a theoretically well founded approach for Support Vector Machines (SVM) in [15]. They adapt the size such that an estimation of the Leave-one-out error is minimized without any parametrization. Active methods are able to detect abrupt drift quickly, however, they struggle with incremental change, which may be not significant enough and remains undetected. Another weakness is that knowledge either slowly fades out or is discarded in case of detected drift. Although the most recent examples are usually the most valuable for current predictions, there are also cases in which older data carries crucial information, e.g. reoccurring drift. Here, the methods have to relearn former concepts and produce more mistakes than necessary. Our approach explicitly preserves information of former concepts and increases the conservation time span by repeated compression, allowing the access to former knowledge when necessary. Passive approaches continuously adapt their model without explicit awareness of occurring drift. This prevents pitfalls such as missed or false detected drifts on the one hand, but the adaption speed is more or less constant leading to costly delays in the case of abrupt drift, on the other hand. Passive algorithms are dominated by ensembles, consisting usually of tree based models such as The Very Fast Deciscion Tree (VFDT) [16] 1 : A very fast anytime decision tree algorithm with asymptotic guarantees for its output, which incrementally adds splits based on the Hoeffding bound. Ensemble members are continuously updated with incoming examples using techniques such as Bagging. Furthermore, new knowledge can be additionally incorporated by the integration of new members, whereas irrelevant information is discarded by the deletion of corresponding old classifier. However, one major drawback is the comparably high computational effort. Jaber et al. presented Dynamic Adaption to Concept Changes (DACC) in [17], an algorithm inspired by the Dynamic 1 The
VFDT is often called Hoeffding Tree (HT)
Weighted Majority [5] method. A classifier of the worst half of the pool is removed randomly after a predefined number of examples and replaced by a new one. Newly generated classifier are excluded for a predefined time from this elimination process. Predictions for incoming examples are solely done by the best classifier within the pool, having the highest accuracy in the past. This intuitive approach performed well within incremental and abrupt drift scenarios. In [18] Bifet et al. propose to increase the randomization of Online Bagging [19] and thereby the diversity of the ensemble. This is done by a higher λ value for the Poisson distribution and the usage of output detection codes. Additionally, ADWIN is used as change detector for every ensemble member such that every detected change leads to the replacement of the worst classifier by a new one. The resulting active-passive method Leveraging Bagging (LVGB) achieves accurate results on streaming data containing drift. Learn++.NSE [6] processes incoming examples in chunks with a predefined size. A base classifier is trained for each chunk and added to the ensemble. The loss on recent chunks is averaged with a sigmoid function to compute the weight of each member. Similar to AdaBoost [20], instances are weighted such that misclassified inputs have a higher impact on the calculated loss. In contrast to other methods, here members are not continuously learning but preserve their initial state. This fact is used to revive former members in the presence of reoccurring drift. Passive approaches can deal with incremental drift, but their inherent adaption speed has to be adjusted to the task specific drift speed. In case of abrupt drift, the adaption delay is usually more pronounced than in active methods. Even though, ensembles allow more flexibility in form of addition and deletion of new members, the fundamental issues remain, albeit somewhat weakened. Our approach is also an ensemble, but it distinguishes itself by the explicit generation of dedicated classifiers for current and past knowledge. Members are neither added nor removed, instead the ensemble is used to instantly switch the knowledge basis for current predictions. This allows flexible adaption to real and virtual drift at various rates without any parametrization. We couple the proposed architecture with the kNN classifier as one of the most popular nonparametric models. KNN has already been applied in the streaming scenario, mainly with the goal to provide an efficient search [21] or a compressed representation [22]. It was also considered for drifting data streams [13], [23]. But one of its key advantages, the simple editing of the data, has not been exploited as extensively as in our method, enabling the preservation of more relevant data for future prediction. IV.
A RCHITECTURE OF THE S ELF A DJUSTING M EMORY (SAM)
In the research field of human memory the dual-store model [24], consisting of the Short-Term and Long-Term memory (STM & LTM), is largely accepted. Sensory information arrives at the STM and is joined by context relevant knowledge from the LTM. Information getting enough attention by processes such as active rehearsal is transfered into the LTM in form of Synaptic Consolidation [25]. The capacity of the STM is quite limited and information is kept up to one minute, whereas the LTM is able to preserve it for years
STM LTM
t
Fig. 1. Illustration of the general approach. The STM contains only the current concept, while the LTM preserves only knowledge which is consistent in regard to the STM.
[26]. Immediate processing e.g. remembering the beginning of a read sentence, largely uses the STM. Whereas knowledge recalled from the past either explicitly requires the LTM e.g. consciously remembering events in life, or in an implicit way e.g. how to ride a bike. The SAM architecture is partly inspired by this model and exhibits the following analogies: •
Explicit separation of current and past knowledge, stored in dedicated memories.
•
Different conservation spans among the memories.
•
Transfer of filtered knowledge from the STM to the LTM.
•
Situation dependent usage.
The basic idea is to combine dedicated models for the current concept Pt (x, y) and all former ones Pt−1 (x, y), . . . , P1 (x, y) in such a way that the prediction accuracy is maximized. This is a very general concept, which could be coupled with different type of models, requiring a different realization. In case of dedicated parametric models, for example, a proper management of the distribution parameters would be necessary. However, in this paper we realize our approach with the nonparametric method kNN and therefore construct two different memories: The Short-Term Memory (STM), containing data of the current concept and the Long-Term Memory (LTM), maintaining knowledge of past concepts. Figure 1 illustrates this approach. We share the general assumption of new data being more relevant for current predictions. Hence, we remove those information from former concepts which is in conflict with the current one, but we explicitly preserve the rest in compressed fashion. We avoid any parametrization, by exploiting the minimization of the error on recent data at various steps. Our architecture is depicted in Figure 2 and described below in detail. A. Model definition Memories are represented by sets MST , MLT , MC . Each memory is a subset in Rn × {1, . . . , c} of varying length, adjusted during the adaptation process. The STM represents the
Model parameter: During the adaption phase we adjust the following parameters: •
The size m of the STM.
•
The data points in the LTM.
•
The weights wST , wLT , wC .
The model has the subsequent hyperparameters, which can be robustly chosen and do not require a task specific setting:
Fig. 2. SAM architecture: Incoming examples are stored within the STM. The cleaning process keeps the LTM all-time consistent with the STM. Whenever, the STM is reduced in size, its discarded knowledge is transfered into the LTM. Accumulated knowledge is compressed each time the available space is exhausted. Both models are considered during prediction, depending on their past performances.
•
The number of neighbors k.
•
The minimum length Lmin of the STM.
•
The maximum number of stored examples Lmax (STM and LTM combined).
We used for all experiments k = 5, Lmin = 50, Lmax = 5000. B. Model adaption
current concept and is a dynamic sliding window containing the most recent m examples of the data stream: MST = {(xi , yi ) ∈ Rn ×{1, . . . , c} | i = t−m+1, . . . , t}. (2) The LTM preserves all former information which is not contradicting those of the STM in a compressed way. In contrast to the STM the LTM is neither a continuous subpart of the data stream nor given by exemplars of it, but instead a set of p points: MLT = {(xi , yi ) ∈ Rn × {1, . . . , c} | i = 1, . . . , p}. The combined memory (CM) is the union of both memories with size m + p: MC = MST ∪ MLT . Every set induces a classifier, in our case a distance weighted kNN : Rn 7→ {1, . . . , c}, kNNMST , kNNMLT , kNNMC . The kNN function assigns a label for a given point x based on a set Z = {(xi , yi ) ∈ Rn × {1, ..., c} | i = 1, . . . , n}: kNNZ (x) = arg max{ cˆ
X
1 d(xi , x)
|ˆ c = 1, . . . , c},
The adaption comprises every memory as well as the corresponding weights. We denote a data point at time t as (xt , yt ) and the corresponding memories MSTt , MLTt , MCt . 1) Adaption of the Short Term Memory: The STM is a dynamic sliding window containing the most recent examples. Every incoming example of the stream gets inserted such that the STM grows continuously. Its role is to exclusively contain data of the current concept. Therefore, its size has to be reduced, whenever the concept changes such that examples of the former concept are dropped. However, we do not explicitly detect a concept change, but instead we adjust the size such that the Interleaved Test-Train error of the remaining STM is minimized. This approach relies on the fact that a model trained on internally consistent data yields less errors and we assume the remaining instances to represent the current concept or being sufficiently ”close” to it. Formally, we evaluate differently sized STMs and adopt the one with minimum Interleaved Test-Train error (see equation 1). To compare only a logarithmic number, we use bisection for the selection of the window size. Tested windows are: Ml = {(xt−l+1 , yt−l+1 ), . . . , (xt , yt )}, where l ∈ {m, m/2, m/4 . . .} and l ≥ Lmin .
xi ∈Nk (x,Z)|yi =ˆ c
where d(x1 , x2 ) is the Euclidean distance between two points and Nk (x, Z) returns the set of k nearest neighbors of x in Z. Weights wST , wLT , wC are representing the accuracy of the corresponding model on the current concept and are determined as described in section IV-B4. The prediction of our complete model relies on the sub-model with the highest weight1 and is defined for a given point x as: kNNMST (x) if wST ≥ max(wLT , wC ) x 7→ kNNMLT (x) if wLT ≥ max(wST , wC ) kNNMC (x) if wC ≥ max(wST , wLT ). This model is adapted incrementally for every time t as described in section IV-B. 1 In case of ties, we prioritize the models in the following order: kNN MST , kNNMLT , kNNMC
MSTt+1 =
arg min
E(S).
S∈{Mm ,Mm/2 ,...}
Whenever the STM is shrunk, the set of discarded examples Ot is defined as Ot = MSTt \ MSTt+1 .
(3)
We choose the Interleaved Test-Train error because it has various advantages in the streaming setting over the commonly used cross validation error. The latter is applied on random splits of the data and requires multiple repetitions to deliver a stable estimation of the error, which significantly increases the computational cost. Whereas the former is efficiently using every example for test and training in the original order and therefore is a stable and natural choice in the setting of incremental learning. Our way to adapt the size of the STM has similarities with [15]. However, the approach is based on SVM specific estimates of
the leave one out error and it is not indicated how to choose evaluated window sizes. Whereas we propose to directly determine the Interleaved Test-Train error on recursively bisected windows, which is applicable for arbitrary models. 2) Cleaning and Transfer: The LTM contains all data of former concepts that is consistent with the STM. This requires a cleaning of the LTM according to every seen example. In addition, whenever the STM is reduced in size, we do not simply discard the sorted out data, since it still may contain valuable information for future prediction. One example for such a situation is reoccurring drift, as methods preserving knowledge in this case do not have to relearn former concepts and therefore produce fewer errors. Instead, we transfer as much knowledge as possible into the LTM. Before doing so, we delete examples from the separated set Ot (see equation 3) which are contradicting those in MSTt+1 . This adaption is formalized by two operations. 1)
We clean a set A by another set B regarding an example (xi , yi ) ∈ B clean : (A, B, (xi , yi )) 7→ Aˆ where A, B, Aˆ ⊂ Rn × {1, . . . , c} and (xi , yi ) ∈ B. Aˆ is defined in two steps. (1) We determine the k nearest neighbors of xi in B \ (xi , yi ) and select the ones with label yi . These define the threshold θ = max{d(xi , x))|x ∈ Nk (xi , B \ (xi , yi )}, y(x) = yi ). (2) The k nearest neighbors of xi ∈ A which are inconsistent to B are cleaned based on the threshold, yielding the result of this operation: Aˆ = A \ {(xj , y(xj ))|xj ∈ Nk (xi , A), d(xj , xi ) ≤ θ, y(xj ) 6= yi }.
2)
Furthermore, we require a cleaning operation for the full set B clean : (A, B) 7→ Aˆ|B| where A, B, Aˆ|B| ⊂ Rn × {1, . . . , c}. This is defined iteratively by applying the former cleaning for all (xi , yi ) ∈ B = {(x1 , y1 ), . . . , (x|B| , y|B| )} as Aˆ0 Aˆt+1
= A = clean(Aˆt , B, (xt+1 , yt+1 )).
The adaption of the LTM takes place at two different steps. To ensure a consistent model at any time, cleaning takes place according to every incoming sample (xt , yt ) ˜ LT = clean(MLT , MST , (xt , yt )). M t t t Whenever the STM is shrunk, the discarded set Ot is transferred into the LTM after cleaning, i.e. the LTM becomes � ˜ ∪ clean(Ot , MST ) if STM is shrunk M t+1 MLTt+1 = ˜ LTt MLTt otherwise
3) Compression of the LTM: In contrast to the FIFO principle of the STM, instances are not fading out as soon as the size limit of the LTM is reached. Instead, we condense the available information to a sparse knowledge representation via clustering. This enables a far longer conservation than possible with simple out fading. Formally, for every class label cˆ we group the corresponding data points in the LTM MLTcˆ = {xi |(xi , cˆ) ∈ MLT }. We use the clustering algorithm kMeans++2 with |MLTcˆ |/2 ˆ LT represent the comclusters. The resulting prototypes M c ˆ pressed original data. The LTM is given by the union of all prototypes [ ˆ LT } MLT = {(xi , cˆ)|x ∈ M c ˆ cˆ
This process is repeated each time the size limit is reached leading to a self-adapting level of compression. 4) Model weight adaption: The weight of a memory is its accuracy averaged over the last mt samples, where mt = |MSTt | is the size of the current STM. Hence, the weight of the LTM at time stamp t equals t wLT =
|{i ∈ {t − mt + 1, . . . , t} | kNNMLTi (xi ) = yi }| mt
and analogously for STM and CM. C. Time Complexity The adaption of the STM is by far the most time consuming process of SAM and upper bounds the complexity of the algorithm. Therefore, we exclusively give a complexity analysis of this part and neglect the others. Given a query point, the determination of its k nearest neighbors within a pool of m examples is linear O(m). Each time, max we are evaluating up to log L Lmin differently sized STMs, where Lmin and Lmax are the minimum and maximum lengths of the STM. The complete calculation of the error for one STM is upper bounded by O(L2max ). This results in the overall worst max case complexity of O(nL2max log L Lmin ) for n examples. There is a lot of room to reduce this complexity, for instance, the calculation of the error can be done incrementally whenever the following condition is met: Given an exemplary STM St−1 (defined as in equation 2). If its successor St is simply an extension of St−1 , such that St = [St−1 , (xt , yt )], the corresponding error is given by E(St ) =
(t − 1)E(St−1 ) + 1(ht−1 (xt ) 6= yt ) . t
This is the case whenever an STM simply is growing by the current example, which happens frequently in practice and clearly dwindles the time complexity of the method. We are currently experimenting with approximations of the error to reduce the complexity further. 2 We used kMeans++ [27] because of its efficiency and scalability to larger datasets.
TABLE I. Dataset SEA Concepts Rotating Hyperplane Moving RBF Interchanging RBF Moving Squares Transient Chessboard Mixed Drift
E VALUATED ARTIFICIAL DATASETS . #Samples
#Feat.
#Class
Drift type
50K 200K 200K 200K 200K 200K 600K
3 10 10 2 2 2 2
2 2 5 15 4 8 15
real abrupt real incremental real incremental real abrupt real incremental virtual reoccurring abr/incr/virt
V.
DATASETS
We used well known artificial as well as real world datasets for the experiments. Links to all datasets and algorithms, including our own, are available at GitHub3 . In the following we describe the data more detailed.
A. Artificial Data Artificial datasets have the advantage that any desired drift behavior can be explicitly simulated. They are often 2dimensional to enable a straightforward visualization. We considered published benchmarks or used generators from Massive Online Analysis (MOA) [28] with common parametrization. We also added four new datasets allowing an extensive evaluation on specific drift types, including virtual drift, which is often ignored in the community. Table I shows their main characteristics. SEA Concepts This dataset was proposed in [29] and consists of 50000 instances with three attributes of which only two are relevant. The two class decision boundary is given by f1 + f2 = θ, where f1 , f2 are the two relevant features and θ a predefined threshold. Abrupt drift is simulated with four different concepts, by changing the value of θ every 12500 samples. Also included are 10% of noise. Rotating Hyperplane A hyperplane in d-dimensional space is defined by the set of points x that satisfy P d i=1 wi xi = w0 . The position and orientation of the hyperplane are changed by continuous addition of a term δ to the weights wi = wi + δ. We used the Random Hyperplane generator in MOA with the same parametrization as in [13] (10 dimensions, 2 classes, δ=0.001). Moving RBF Gaussian distributions with random initial positions, weights and standard deviations are moved with constant speed v in d-dimensional space. The weight controls the partitioning of the examples among the Gaussians. We used the Random RBF generator in MOA with the same parametrization as in [13] (10 dimensions, 50 Gaussians, 5 classes, v=0.001). Interchanging RBF Fifteen Gaussians with random covariance matrices are replacing each other every 3000 samples. Thereby, the number of Gaussians switching their position increases each time by one until all are simultaneously changing their location. This 3 https://github.com/vlosing
TABLE II.
C ONSIDERED REAL WORLD DATASETS .
Dataset Weather Electricity Cover Type Poker Hand Outdoor Rialto
#Samples
#Feat.
#Class
18159 45312 581012 829200 4000 82250
8 5 54 10 21 27
2 2 7 10 40 10
allows to evaluate an algorithm in the context of abrupt drift with increasing strength. Altogether 67 abrupt drifts are occurring within this dataset. Moving Squares Four equidistantly separated, squared uniform distributions are moving in horizontal direction with constant speed. The direction is inverted whenever the leading square reaches a predefined boundary. Each square represents a different class. The added value of this dataset is the predefined time horizon of 120 examples before old instances may start to overlap current ones. This is especially useful for dynamic sliding window approaches, allowing to test whether the size is adjusted accordingly. Transient Chessboard Virtual drift is generated by revealing successively parts of a chessboard. This is done square by square randomly chosen from the whole chessboard such that each square represents an own concept. Every time after four fields have been revealed, samples covering the whole chessboard are presented. This reoccurring alternation penalizes algorithms tending to discard former concepts. To reduce the impact of classification by chance we used eight classes instead of two. Mixed Drift The datasets Interchanging RBF, Moving Squares and Transient Chessboard are arranged next to each other and samples of these are alternately introduced. Therefore, incremental, abrupt and virtual drift are occurring at the same time, requiring a local adaptation to different drift types. B. Real World Data A few real world drift benchmarks are available of which we considered the largest ones. We contribute two new challenging datasets obtained from visual data. The characteristics are given in Table II. Weather Elwell et al. introduced this dataset in [6]. In the period of 1949-1999 eight different features such as temperature, pressure wind speed etc. were measured at the Offutt Air Force Base in Bellevue, Nebraska. The target is to predict whether it is going to rain on a certain day or not. The dataset contains 18159 instances with an imbalance towards no rain (69%). Electricity market dataset This problem is often used as a benchmark for concept drift classification. Initially described in [30], it was used thereafter for several performance comparisons [31], [32], [13], [4]. A critical note to its suitability as a benchmark can be found in [33]. The dataset holds information of the Australian New South Wales Electricity Market, whose prices
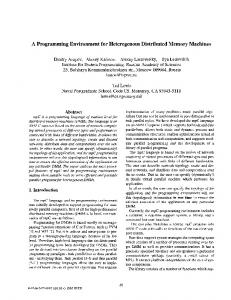
Fig. 3. Objects, positioned in a garden, are approached by a mobile robot under different lighting conditions. Each row shows the first, fifth and tenth image of one approach.
are affected by supply and demand. Each sample, characterized by attributes such as day of week, time stamp, market demand etc., refers to a period of 30 minutes and the class label identifies the relative change (higher or lower) compared to the last 24 hours. Forest Cover Type Assigns cartographic variables such as elevation, slope, soil type, . . . of 30 × 30 meter cells to different forest cover types. Only forests with minimal human-caused disturbances were used, so that resulting forest cover types are more a result of ecological processes. It is often used as a benchmark for drift algorithms [13], [34], [35]. Poker Hand One million randomly drawn poker hands are represented by five cards each encoded with its suit and rank. The class is the resulting poker hand itself such as one pair, full house and so forth. This dataset has in its original form no drift, since the poker hand definitions do not change and the instances are randomly generated. However, we used the version presented in [13], in which virtual drift is introduced via sorting the instances by rank and suit. Duplicate hands were also removed. Outdoor Objects We obtained this dataset from images recorded by a mobile in a garden environment. The task is to classify 40 different objects, each approached ten times under varying lighting conditions affecting the color based representation (see Figure 3). Each approach consists of 10 images and is represented in temporal order within the dataset. The objects are encoded in a normalized 21-dimensional RG-Chromaticity histogram. Rialto Bridge Timelapse Ten of the colorful buildings next to the famous Rialto bridge in Venice are encoded in a normalized 27-dimensional RGB histogram. We obtained the images from time-lapse videos captured by a webcam with fixed position. The recordings cover 20 consecutive days during may-june 2016. Continuously changing weather and lighting conditions affect the representation as can be seen in Figure 4. We generated the labels by manually masking the corresponding buildings and
Fig. 4. Images of the Rialto bridge recorded at different times of day. The color based representation of the buildings changes significantly during each of the 20 recorded days. Source of the images: https://www.skylinewebcams.com. TABLE III. T HE COMPARED ALGORITHMS AND THE CHOSEN HYPERPARAMETER . E NSEMBLES CONSISTED OF 10 MEMBERS . W E USED A MAXIMUM WINDOW SIZE OF 5000 SAMPLES AND k WAS SET TO 5 FOR ALL K NN BASED METHODS . Abbr.
Classifier
Parameter
L++.NSE DACC LVGB KNNS KNNWA SAM
Learn++.NSE with CART DACC with HT LVGB with HT KNN with fixed size sliding window KNN with PAW+ADWIN Self adjusting memory-kNN
chunk-size = optimized n = 10 n = 10 Lmax = 5000, k = 5 Lmax = 5000, k = 5 Lmax = 5000, k = 5
excluded overnight recordings since they were too dark for being useful.
VI.
E XPERIMENTS
We compare our STM-LTM approach with well-known state of the art algorithms for handling drift in streaming data. Implementations of the original authors or those available in MOA have been used to conduct the experiments. Table III gives an overview of the algorithms as well as the chosen hyperparameter. Next to the method already discussed in III, we compare against a distance weighted kNN classifier with a sliding window of fixed size. Learn++.NSE is combined with Classification and Regression Trees (CART) [36] as it is done by its author. Window based approaches were allowed to store 5000 samples (we also report results for a size of 1000 samples) but never more than 10% of the whole dataset.4 This rather large amount gives the approaches a high degree of freedom and prevents the concealment of their qualities with a too restricted window. L++.NSE requires a setting of its crucial chunk size parameter, which plays a similar role as the size of sliding windows. To avoid any disadvantage we evaluated several sizes and report the best result. No further dataset specific hyperparameter tuning was done, since we wanted to provide as little prior knowledge as possible. 4 Regarding our approach, the available space is shared between the STM and LTM.
TABLE IV. I NTERLEAVED T EST-T RAIN ERROR RATES OF ALL EXPERIMENTS . W INDOW BASED APPROACHES ARE CONSIDERED WITH THE MAXIMUM SIZE OF 5000 EXAMPLES FOR THE RANKING . F OR EACH DATASET THE LOWEST VALUE IS MARKED IN BOLD . Dataset
Window size 5000 Window size 1000 L++.NSE DACC LVGB kNNS kNNWA SAM kNNS kNNWA SAM 11.69 12.53 44.84 6.11 12.17 17.95 26.29
SEA Concepts Rotating Hyperplane Moving RBF Interchanging RBF Moving Squares Transient Chessb. Mixed Drift
14.48 15.58 44.50 27.52 65.90 1.98 40.37
15.68 18.20 54.34 1.40 1.17 43.21 61.06
Artificial ∅ Artificial ∅ Rank
30.05 4.00
27.87 18.80 29.05 23.48 9.81 21.24 21.99 9.78 4.57 2.86 4.29 3.57 1.71 -
Weather Electricity Cover Type Poker Hand Outdoor Rialto
22.88 27.24 15.00 22.14 57.80 40.36
26.78 16.87 10.05 20.97 35.65 28.93
Real world ∅ Real word ∅ Rank
30.90 5.33
23.21 23.50 18.03 20.87 15.40 17.10 20.44 15.88 4.17 3.17 2.33 4.00 2.00 -
Overall ∅ Overall ∅ Rank
30.44 4.62
25.72 20.97 23.96 22.27 12.39 19.33 21.28 12.60 4.38 3.00 3.38 3.77 1.85 -
21.89 16.78 9.07 13.65 39.97 39.64
13.83 16.00 20.36 45.92 68.87 7.36 31.00
21.53 28.61 4.21 17.08 13.98 22.74
13.39 16.16 24.04 8.56 61.01 14.44 26.75
23.11 26.13 6.76 27.94 16.30 24.96
12.50 13.31 15.30 5.70 2.30 6.25 13.33
21.74 17.52 4.8 18.45 11.25 18.58
13.96 18.44 12.89 10.15 59.24 13.72 20.27
22.09 24.74 3.96 17.08 14.02 20.72
13.22 18.02 17.3 8.56 56.52 16.34 23.99
23.40 23.30 6.51 27.94 16.90 24.61
13.44 14.53 12.12 2.60 2.30 11.27 12.22
22.45 17.46 5.85 19.77 11.52 18.21
A. Results We evaluated the methods by measuring the Interleaved Test-Train error. The error rates of all experiments are shown in Table IV. The proposed method SAM-kNN outperforms the others quite significantly by having nearly half the error rate in average compared to the second best method LVGB. Even more important is in our eyes the fact that other methods struggle at one or another dataset but our approach delivers robust results without any hiccup. All drift types are handled better or at least competitive. This is particularly clarified in the large gap achieved within the Mixed Drift dataset, which contains incremental, abrupt and virtual drift at the same time. The methodically most similar method to ours is kNNWA , since it also uses kNN and actively manages its window. However, it performs worse in all experiments. To clarify that this is not due to the distance weighting, we repeated the experiments with SAM-kNN using majority voting instead and got an overall average error rate of 14.72%. For the sake of completeness, we also report the error rates of all window based approaches with a window size of 1000 samples as done in [13]. We can see that especially the results of kNNS and kNNWA are significantly better with the smaller window. SAM also profits sometimes, e.g. Moving RBF dataset, albeit clearly weakened. The reason for the higher performance is that samples of former concepts are fading out faster of the smaller window and are, therefore, less often contradicting the current concept in the case of real drift. Hence, the smaller window conceals the issue that the methods now and than fail to shrink the window appropriately. Therefore, we chose the larger and more informative size of 5000 samples for the ranking. Our results confirm the fact that kNN is in general a very competitive algorithm in the streaming setting. It is quite surprising that the simple sliding window approach kNNS performs comparably well or even better than more sophisticated methods such as DACC or L++.NSE.
Fig. 5. Illustrations of the Interchanging RBF dataset. Only a part of the dataset is depicted for the sake of clarity. Top: The size adaption of the STM is shown on the left. Dashed vertical lines mark the moments of abruptly changed concepts. The delay of the model shrinks with increasing strength of drift. Only the STM is used for prediction (right). Bottom: Snapshots of the STM and LTM. Points of the LTM that are in accordance with the STM are preserved. Different classes are represented by different colors.
B. Memory behaviour In this section we illustrate the adaptation of the memories as well as their task specific roles. Figure 5 depicts on the top left the size adjustment of the STM during the Interchanging RBF experiment. The algorithm reliably reduces the window size after each abrupt drift. However, we also observe a certain delay, during which wrong predictions are likely to be done. This delay is due to two reasons. Firstly, a certain amount of examples is required to reliably predict the new concept. Secondly, the more examples of the former concept are contained in the STM, the more stable is its representation and the more examples of the new concept are required to deteriorate the overall accuracy sufficiently. Hence, the delay illustrates a self-adjusting tradeoff between adaption speed to new concepts and the robustness against noise, governed by the stability of both concepts. The adaption delay decreases with increasing drift strength. The selective cleaning of the LTM is also visible in Figure 5. Points interfering with the STM were deleted as can be seen by the empty spots within the clusters. Whereas samples around are harmless and consequently kept in memory. As already mentioned, the Moving Squares dataset is constructed in such a way that the squares may overlap each other if more than 120 of the recent examples are kept in memory. Hence, the best strategy for this problem is to keep the window as small as possible and to use only the most recent examples for prediction. Figure 6 shows how the size of the STM is most of the time kept between 50 and 100 samples, allowing a nearly perfect prediction. This is also clarified by its
Fig. 8. Fig. 6. Depictions of the Moving Squares benchmark. Top: The STM size is most of the time kept below 120 samples and avoids the overlap of current points by outdated ones. The STM is exclusively used for prediction (right). Bottom: Snapshots of the STM and LTM. Classes do not overlap within both memories.
Model selection for the datasets Rialto (left) and Weather (right).
beneficial information from the past. Its snapshot reveals the compressed preservation of the whole chessboard. The task dependent relevance of both memories is exemplified with real world data in Fig.8: While the LTM is the preferred prediction model in the Weather dataset, it is the STM that classifies most of the instances of the Rialto task. VII.
Fig. 7. Illustrations of the Transient Chessbord dataset. Top: Each 1000 examples the square by square revelation (blue background) is alternated by samples covering the whole chessboard(white background). The STM tracks the current concept: It shrinks after each revealed field in the first phase and grows during the second phase to contain the whole chessboard. Only a part of the dataset is depicted for the sake of clarity. Bottom: The LTM preserves the whole chessboard in compressed fashion, whereas only the current concept is contained in the STM.
snapshot, illustrating the absence of overlapping instances. The parameter controlling the minimum size of the STM prevents a size reduction below 50 examples, otherwise an even better result is possible. In contrast to the previous two datasets, which basically do not require the LTM, we see in Figure 7 its importance during the prediction of the Transient Chessboard task. The STM is used alone whenever the data is presented square by square because it contains solely relevant information for the current square and produces less mistakes than in combination with the LTM. But during the periods in which examples are distributed over the whole board, the LTM is heavily used since it contains
C ONCLUSION
In this paper we presented the Self Adjusting Memory (SAM) architecture, especially designed to handle heterogeneous concept drift within streaming data. It explicitly separates the current concept from former ones and preserves both in dedicated memories combining them according to the demands of the current situation. Thereby, it omits a common weakness of available methods that simply discard former knowledge and, therefore, produce more mistakes in case of reoccurring drift. Our method is easy to use in practice, since it requires neither meta-parameterization nor related prior knowledge about the task at hand. We compared this approach in an extensive evaluation with current state of the art methods. As the only algorithm in the field, it demonstrated consistently accurate results for heterogeneous drift types: virtual versus real drift, abrupt versus incremental drift. We also showed that the different memory types take over different functions in the overall model. While the STM represents the actual concept, the LTM conserves established knowledge as long as it is consistent with the STM. This decomposition proved to be particularly effective to simultaneously deal with heterogeneous drift types in real world streaming data. We want to pursue our promising approach further and especially consider a spacial decomposition to enable a more fine-grained combination of the memory models. This allows a reaction to different concurring drift types for different locations in space. Furthermore, the generality of the proposed architecture permits a combination with alternative models such as memory and time efficient parametric probabilistic models or incremental/decremental SVMs. We already conducted some experiments with the Naive Bayes algorithm and the first results are very promising.
R EFERENCES [1]
[2]
[3] [4]
[5]
[6]
[7]
[8]
[9]
[10]
[11] [12]
[13]
[14]
[15] [16]
[17]
[18]
[19]
[20]
[21]
[22]
L. S, “The age of big data,” New York Times, 2012. [Online]. Available: http://www.nytimes.com/2012/02/12/sunday-review/ big-datas-impact-in-the-world.html? r=2&scp=1&sq=Big%20Data& st=cse M. Chen, S. Mao, and Y. Liu, “Big data: A survey,” Mobile Netw. and Appl., vol. 19, no. 2, 2014. [Online]. Available: http://dx.doi.org/10.1007/s11036-013-0489-0 L. Atzori, A. Iera, and G. Morabito, “The internet of things: A survey,” Computer networks, vol. 54, no. 15, pp. 2787–2805, 2010. J. Gama, P. Medas, G. Castillo, and P. Rodrigues, “Learning with drift detection,” in Advances in artificial intelligence–SBIA 2004. Springer, 2004, pp. 286–295. J. Z. Kolter and M. A. Maloof, “Dynamic weighted majority: An ensemble method for drifting concepts,” The Journal of Machine Learning Research, vol. 8, pp. 2755–2790, 2007. R. Elwell and R. Polikar, “Incremental learning of concept drift in nonstationary environments,” IEEE Transactions on Neural Networks, vol. 22, no. 10, pp. 1517–1531, Oct 2011. S. Schiaffino, P. Garcia, and A. Amandi, “eteacher: Providing personalized assistance to e-learning students,” Computers & Education, vol. 51, no. 4, pp. 1744–1754, 2008. S. A. Dudani, “The distance-weighted k-nearest-neighbor rule,” Systems, Man and Cybernetics, IEEE Transactions on, no. 4, pp. 325–327, 1976. ˇ J. Gama, I. Zliobait˙ e, A. Bifet, M. Pechenizkiy, and A. Bouchachia, “A survey on concept drift adaptation,” ACM Computing Surveys (CSUR), vol. 46, no. 4, p. 44, 2014. G. Ditzler, M. Roveri, C. Alippi, and R. Polikar, “Learning in nonstationary environments: A survey,” Computational Intelligence Magazine, IEEE, vol. 10, no. 4, pp. 12–25, 2015. A. Bifet and R. Gavalda, “Learning from time-changing data with adaptive windowing.” in SDM, vol. 7. SIAM, 2007, p. 2007. T. Dasu, S. Krishnan, S. Venkatasubramanian, and K. Yi, “An information-theoretic approach to detecting changes in multidimensional data streams,” in In Proc. Symp. on the Interface of Statistics, Computing Science, and Applications. Citeseer, 2006. A. Bifet, B. Pfahringer, J. Read, and G. Holmes, “Efficient data stream classification via probabilistic adaptive windows,” in Proceedings of the 28th Annual ACM Symposium on Applied Computing, ser. SAC ’13. New York, NY, USA: ACM, 2013, pp. 801–806. [Online]. Available: http://doi.acm.org/10.1145/2480362.2480516 G. Widmer and M. Kubat, “Learning in the presence of concept drift and hidden contexts,” Machine learning, vol. 23, no. 1, pp. 69–101, 1996. R. Klinkenberg and T. Joachims, “Detecting concept drift with support vector machines.” in ICML, 2000, pp. 487–494. P. Domingos and G. Hulten, “Mining high-speed data streams,” in Proceedings of the sixth ACM SIGKDD international conference on Knowledge discovery and data mining. ACM, 2000, pp. 71–80. G. Jaber, A. Cornu´ejols, and P. Tarroux, “Online learning: Searching for the best forgetting strategy under concept drift,” in Neural Information Processing. Springer, 2013, pp. 400–408. A. Bifet, G. Holmes, and B. Pfahringer, “Leveraging bagging for evolving data streams,” in Machine learning and knowledge discovery in databases. Springer, 2010, pp. 135–150. N. C. Oza, “Online bagging and boosting,” in Systems, man and cybernetics, 2005 IEEE international conference on, vol. 3. IEEE, 2005, pp. 2340–2345. Y. Freund, R. Schapire, and N. Abe, “A short introduction to boosting,” Journal-Japanese Society For Artificial Intelligence, vol. 14, no. 771780, p. 1612, 1999. P. Zhang, B. J. Gao, X. Zhu, and L. Guo, “Enabling fast lazy learning for data streams,” in Data Mining (ICDM), 2011 IEEE 11th International Conference on. IEEE, 2011, pp. 932–941. Y.-N. Law and C. Zaniolo, “An adaptive nearest neighbor classification algorithm for data streams,” in Knowledge Discovery in Databases: PKDD 2005. Springer, 2005, pp. 108–120.
[23]
[24]
[25] [26]
[27]
[28]
[29]
[30] [31]
[32]
[33] [34]
[35]
[36]
E. S. Xioufis, M. Spiliopoulou, G. Tsoumakas, and I. Vlahavas, “Dealing with concept drift and class imbalance in multi-label stream classification,” in Proceedings of the Twenty-Second International Joint Conference on Artificial Intelligence - Volume Volume Two, ser. IJCAI’11. AAAI Press, 2011, pp. 1583–1588. [Online]. Available: http://dx.doi.org/10.5591/978-1-57735-516-8/IJCAI11-266 R. C. Atkinson and R. M. Shiffrin, “Human memory: A proposed system and its control processes,” The psychology of learning and motivation, vol. 2, pp. 89–195, 1968. Y. Dudai, “The neurobiology of consolidations, or, how stable is the engram?” Annu. Rev. Psychol., vol. 55, pp. 51–86, 2004. G. A. Miller, “The magical number seven, plus or minus two: some limits on our capacity for processing information.” Psychological review, vol. 63, no. 2, p. 81, 1956. D. Arthur and S. Vassilvitskii, “k-means++: The advantages of careful seeding,” in Proceedings of the eighteenth annual ACM-SIAM symposium on Discrete algorithms. Society for Industrial and Applied Mathematics, 2007, pp. 1027–1035. A. Bifet, G. Holmes, R. Kirkby, and B. Pfahringer, “Moa: Massive online analysis,” The Journal of Machine Learning Research, vol. 11, pp. 1601–1604, 2010. W. N. Street and Y. Kim, “A streaming ensemble algorithm (sea) for large-scale classification,” in Proceedings of the Seventh ACM SIGKDD International Conference on Knowledge Discovery and Data Mining, ser. KDD ’01. New York, NY, USA: ACM, 2001, pp. 377–382. [Online]. Available: http://doi.acm.org/10.1145/502512.502568 M. Harries and N. S. Wales, “Splice-2 comparative evaluation: Electricity pricing,” 1999. ´ M. Baena-Garcıa, J. del Campo-Avila, R. Fidalgo, A. Bifet, R. Gavalda, and R. Morales-Bueno, “Early drift detection method,” in Fourth international workshop on knowledge discovery from data streams, vol. 6, 2006, pp. 77–86. L. I. Kuncheva and C. O. Plumpton, “Adaptive learning rate for online linear discriminant classifiers,” in Structural, Syntactic, and Statistical Pattern Recognition. Springer, 2008, pp. 510–519. I. Zliobaite, “How good is the electricity benchmark for evaluating concept drift adaptation,” arXiv preprint arXiv:1301.3524, 2013. J. Gama, R. Rocha, and P. Medas, “Accurate decision trees for mining high-speed data streams,” in Proceedings of the ninth ACM SIGKDD international conference on Knowledge discovery and data mining. ACM, 2003, pp. 523–528. N. C. Oza and S. Russell, “Experimental comparisons of online and batch versions of bagging and boosting,” in Proceedings of the seventh ACM SIGKDD international conference on Knowledge discovery and data mining. ACM, 2001, pp. 359–364. L. Breiman, J. Friedman, R. Olshen, and C. Stone, Classification and Regression Trees. Monterey, CA: Wadsworth and Brooks, 1984.