Knowledge Discovery in DNA Microarray Data of Cancer Patients with Emergent Self Organizing Maps Alfred Ultsch, David Kämpf DataBionics Research Lab, Department of Computer Science University of Marburg, D-35032 Marburg, Germany
[email protected] DNA microarrays provide a powerful means of monitoring thousands of gene expression levels at the same time. They consist of high dimensional data sets which challenge conventional clustering methods. The data’s high dimensionality calls for Self Organizing Maps (SOMs) to cluster DNA microarray data. This paper shows that a precise estimation of the variables’ variances is, however, the key to successful clustering of such data with SOMs. We propose PDEplots to verify the estimation of variances. PDEplots are probability density estimations based on information optimal sets. This paper demonstrates the application of PDEplots for clustering DNA microarray data of leukemia with the U-Matrix. Our approach reveals new insights into the structure of the leukemia dataset: PDEplots show two different distributions in the raw data. Three new subclasses are found with the U-Matrix.
1
Introduction
Fast and accurate diagnosis is vitally important for cancer patients. With DNA microarrays a new tool has been developed which could lead to a new era in cancer diagnosis. The intrinsic problem of a typical data set produced by DNA microarrays is the small sample size and the high dimensionality of the data set. The leukemia data described in chapter 2 consists of expression values for 7192 genes from 72 patients. In such a constellation (high dimensionality and small sample size) we propose the use of Emergent Self Organizing Maps (ESOMs [1], [2]) with their ability of appropriately representing high dimensional structures and finding new classes. We have successfully applied ESOMs combined with the U–Matrix and the machine learning tool sig* to classification of DNA Array Data from neuroblastoma patients [2]. This paper gives an overview of the databionic methods and shows their usefulness on the leukemia data set.
2
DNA microarray data of leukemia
The dataset we used for this paper consists of 7192 gene expressions (slides) for 72 leukemia cancer patients (cases). It is publicly available on the internet from http://www.broad.mit.edu/cgi-bin/cancer/datasets.cgi/. The dataset was produced using a high-density oligonucleotide Affymetrix chip. For every gene there is a quantitative expression value. There is an existing (clinical) classification of the data set into two groups: acute lymphoblastic leukemia (ALL) and acute myeloid leukemia (AML). The discrimination between theses two types of leukemia is crucial because there are important differences in the treatment of ALL and AML. A supervised approach for the classification has been suggested by Golub et al [3]
3
Estimation of dispersion for DNA microarray data
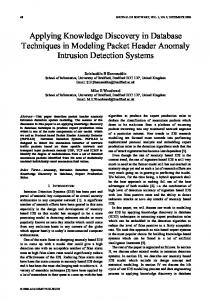
Statistical methods for identifying differentially expressed genes as well as clustering methods require a precise estimation of the dispersion of the gene expressions (see [4] and [7]). In many studies the empirical variance s2 is used which is problematical for DNA microarray data. This can be seen using a PDEplot. PDEplots are plots of the probability density estimation using a special kernel for density estimation [5]. In Figure 1 a PDEplot of one patient’s gene expressions is depicted in comparison to a Gaussian distribution N(m,s) with m as empirical mean and s as empirical variance (dashed line in Figure 1). It can be seen that most of the values are located around zero. However there is a substantial proportion of very large and very small expression values (“fat tail” phenomena). The empirical means and variance therefore result in a highly inadequate description of the data set. In Figure 2 the variances of the gene expression values for each case of the leukemia dataset are displayed. It visualizes the problem described in the previous paragraph: for a meaningful comparison of the variables their variances have to be compensated. 2700
v aria nc e s o f ge n e e x p re s s io n va lu es
2650
2600
2550
2500
2450
2400
2350
2300
2250 slides
Figure 1 PDEplot of a gene expression
Figure 2 variances of gene expressions
Appropriate trimming methods and robust estimations for means and variances are necessary to get better estimates. This estimation derives the variance from the inter ) quartile range as follows: s = min(s, IQR 1.349) with the empirical standard deviation s and the inter quartile range IQR [6]. Using these methods for the estimation of location and dispersion the data can be normalized to mean 0 and variance 1. Figure 3 shows a PDEplot of the normalized expressions of all patients. The empirical Gauss (in dashed line in Figure 3) is a much better description of the data.
Figure 3 PDEplots of the leukemia data set The PDEplots of the leukemia data set in Figure 3 show two different types of distributions for the gene expression values. The two types do not correspond to the leukemia type (AML/ALL). Dudoit et al. [7] remark, that the expressions were measured in different labs at different times. Different experimental conditions might be the cause of the different distributions.
4
Identification of interesting genes
Golub et al. [3] used a minor variant of a linear discriminate analysis for multivariate normal class density schemes. They identified 50 genes to be interesting for the ALL/AML discrimination. The number of genes is however, mostly derived from plausibility considerations. See Figure 4 for a plot of these genes’ expression values. We used the machine learning algorithm sig* [8 ] to identify genes that are significant for the AML / ALL classification. This is a robust variant of the t-statistics used elsewhere in the form of adjusted p-values [9]. Sig* identified 45 genes to be significant for the ALL/AML discrimination. See Figure 5 for an overview on expression values for these genes.
5
ESOM clustering of the interesting genes
Emergent SOMs (ESOMs), which are characterized by their size (typically 103 – 106 and more neurons) and their ability to discover new sub- classes, are used for clustering. The toroid map structure we use avoids borderline effects and leads to a classification which is following the input data’s intrinsic structure. Visualization and clustering is done with the U–Matrix which depicts the distances of the n – dimensional data space (see [8] and [10]). We trained a 64*64 ESOM for 30 learning epochs with the 45 genes calculated by sig*. The U–Matrix shows 4 classes. Figure 7 shows the 4 classes projected into the U-Matrix. These 4 classes consist of 2 major classes. One of these major classes contains 3 subclasses. It is the tiled view of an ESOM with toroid topology which leads to an image which shows every structure of the U–Matrix 4 times but has the advantage to show border crossing clusters [11]. A projection of the existing classification into AML / ALL is diagrammed in Figure 6. The pre- classification into acute lymphoblastic leukemia (ALL) and acute myeloid leukemia (AML) is also manifested in the ESOM structure. We stress this point because the separation of these two groups is vitally important for the treatment. In addition to that it is a reassurance that the classes produced by the ESOM are reasonable. In addition to the reproduction of the AML / ALL classes the U–Matrix divides AML into 3 subclasses. These sub- classes of AML can be easily seen in the plot of the expression values for all 45 genes in Figure 5. From left to right the 3 subclasses for ALL are shown followed by the class for AML. At the right end of the plot there are two outliers. The genes found by Golub et al. [3] are shown in Figure 4. A comparison of both plots shows that the sub- classes found by the U-Matrix can also be found in the gene set proposed by Golub et al.
Figure 4 expression values of the 50 genes found by Golub et. al
Figure 5 expression values for 45 genes calculated by sig*
Figure 6 Classes from ESOM and U-Matrix match AML / ALL diagnosis
Figure 7 U-Matrix shows 4 different classes
6
Conclusion
Emergent Self Organizing maps are a very capable way of finding structures in high dimensional spaces. A pre-condition for successful clustering with ESOMs is a sensible distance measure which is depending on the data’s variances. This paper has shown that conventional calculations of variance and mean are not appropriate for DNA array datasets. Therefore we propose the PDEplot to get an estimation of robust values for location and dispersion. The PDEplot is then the basis for further distance based clustering methods in high dimensional data sets. The leukemia data set is a good example for the superiority of the PDEplot because conventional methods do not detect the underlying two different distributions but rather eliminate these differences. If the data’s variances are compensated in an adequate way the Emergent Self Organizing can detect not only existing (known) clusters but also discover new classes.
7
References
[1] A. Ultsch, “Data Mining and Knowledge Discovery with Emergent Self-Organizing Feature Maps for Multivariate Time Series”. in: Oja, E., Kaski, S. (Eds.): Kohonen Maps, pp. 33 – 46, 1999 [2] A.Ultsch, M.Eilers, “DNA Microarrays of tumors diagnosed with databionic methods“ ( in German) in Kooperationspartner in Forschung und Innovation, pp 19- 20, Wiesbaden, 2002 [3] T.R. Golub et al, “Molecular Classification of Cancer: Class Discovery and Class Prediction by Gene Expression Monitoring”, Science Vol. 286, pp 531-537, 1999 [4] J. Quackenbush, “Computational Analysis of Microarray Data”, Nat. Rev. Genet. 2, pp. 418 -427, 2001 [5] A. Ultsch, “Pareto Density Estimation: Probability Density Estimation for Knowledge Discovery“, Proc. Conf. Soc. for Information and Classification, Cottbus, 2003 [6] J.P. Keating and D.W. Scott, “A Primer on Density Estimation for the Great Home Run Race of 98”, Stats #25, pp. 16-22, 1999 [7] S. Dudoit et al, “Comparison of discrimination methods for the classification of tumors using gene expression data.”, Journal of the American Statistical Association, Vol. 97, No. 457, p. 77-87, 2002 [8] A. Ultsch, “Self-Organizing Neural Networks for Visualization and Classification“, Proc. Conf. Soc. for Information and Classification, Dortmund, April 1992 [9] S. Dudoit et al, “Statistical methods for identifying differentially expressed genes in replicated cDNA microarray experiments”, Statistica Sinica, Vol. 12, No. 1, p. 111-139, 2002 [10] J. Vesanto et al., ”Self-organizing map in matlab: the SOM toolbox”, Proceedings of the Matlab DSP Conference, pp 35-40, Espoo, Finland, 1999 [11] A.Ultsch, “Maps for the Visualization of high-dimensional Data Spaces”, Proc. Workshop on Self Organizing Maps WSOM03, pp 225-230, 2003