Hindawi Scientific Programming Volume 2018, Article ID 6325635, 12 pages https://doi.org/10.1155/2018/6325635
Research Article Knowledge Graph Representation via Similarity-Based Embedding Zhen Tan
, Xiang Zhao
, Yang Fang, Bin Ge, and Weidong Xiao
Science and Technology on Information Systems Engineering Laboratory, National University of Defense Technology, Changsha, Hunan 410073, China Correspondence should be addressed to Zhen Tan;
[email protected] and Xiang Zhao;
[email protected] Received 16 March 2018; Revised 27 April 2018; Accepted 13 May 2018; Published 15 July 2018 Academic Editor: Juan A. Gomez-Pulido Copyright © 2018 Zhen Tan et al. This is an open access article distributed under the Creative Commons Attribution License, which permits unrestricted use, distribution, and reproduction in any medium, provided the original work is properly cited. Knowledge graph, a typical multi-relational structure, includes large-scale facts of the world, yet it is still far away from completeness. Knowledge graph embedding, as a representation method, constructs a low-dimensional and continuous space to describe the latent semantic information and predict the missing facts. Among various solutions, almost all embedding models have high time and memory-space complexities and, hence, are difficult to apply to large-scale knowledge graphs. Some other embedding models, such as TransE and DistMult, although with lower complexity, ignore inherent features and only use correlations between different entities to represent the features of each entity. To overcome these shortcomings, we present a novel low-complexity embedding model, namely, SimE-ER, to calculate the similarity of entities in independent and associated spaces. In SimE-ER, each entity (relation) is described as two parts. The entity (relation) features in independent space are represented by the features entity (relation) intrinsically owns and, in associated space, the entity (relation) features are expressed by the entity (relation) features they connect. And the similarity between the embeddings of the same entities in different representation spaces is high. In experiments, we evaluate our model with two typical tasks: entity prediction and relation prediction. Compared with the stateof-the-art models, our experimental results demonstrate that SimE-ER outperforms existing competitors and has low time and memory-space complexities.
1. Introduction Knowledge graph (KG), as an important part of the artificial intelligence, is playing an increasingly more essential role in different domains [1]: question answer system [2, 3], information retrieval [4], semantic parsing [5], named entity disambiguation [6], biological data mining [7, 8], and so on [9, 10]. In knowledge graphs, facts can be denoted as instances of binary relations (e.g., PresidentOf (DonaldTrump, American)). Nowadays, a great number of knowledge graphs, such as WordNet [11], Freebase [12], DBpedia [13], YAGO [14], and NELL [15] usually do not appear simultaneously. Instead, they were constructed to describe the structured information in various domains [16], and all of them are fairly sparse. Knowledge representation learning [17–19] is considered as an important task to extract the latent features from associated space. Recently, knowledge embedding [20, 21], an effective method of feature extraction [22], was proposed to
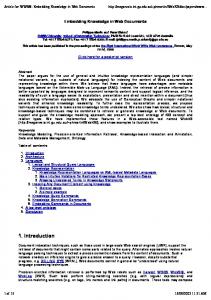
compress a high-dimensional and sparse space into a lowdimensional and continuous space. Knowledge embedding can be used to derive new unknown facts from known knowledge bases (e.g., link prediction) and to determine whether a triplet is correct or not (e.g., triplets classification) [23]. Moreover embedding representation [24] has been used to support question answer systems [25] and machine reading [26]. However, almost all embedding models only use the features and attributes in knowledge graph to represent entities and relations, which omits the fact that entities and relations are projections of the facts in independent space. Besides, almost all of them have high time and memory-space complexities and cannot be used in large-scale knowledge graphs. In this research, we propose a novel similarity-based knowledge embedding model, namely, SimE-ER, which calculates the entity and relation similarities between two spaces (independent and associated spaces). A sketch of the model framework is provided in Figure 1. The basic idea
2
Scientific Programming
e1
Similarity e1 e2 Steve Jobs e3
Similarity e2 Similarity
America e3 Apple Inc.
Laurene Powell Independent Space
Associated Space
Figure 1: Framework of our model. America
y lit na tio Na
Tim Cook
CoupleOf
FoundOf
Jack Ma
e3 Apple Inc.
Sundar Pichai
Jack Ma
r1
Apple Inc. Alibaba
Google Alipay
Laurene Powell
Entity Pairs
Figure 2: Motivation in associated space.
of this paper is that independent and associated spaces are used to represent the irrelevant and interconnected entities (relations) features, respectively. In independent space, the features of entities (relations) are independent and irrelevant. By contrast, the features of entities (relations) in associated space are interconnected and interacting, and the entities and relations can be denoted by the entities and relations connected with them. Plus, the similarities of the same entities (relations) with different spaces are high. In Figure 1, we can see that, in independent space, the features of 𝑒1 are only constructed by themselves, but, in associated spaces, the entity 𝑒1 is denoted by other entities and relations which can be described as blue points (lines). We want the features of 𝑒1 in independent and associated spaces to be similar. Besides, vector embedding is used to represent knowledge graphs. In associated space, take as an example the entity which Steve Jobs has multiple triplets, such as (Steve Jobs, Apple Inc., FoundOf ), (Steve Jobs, America, Nationality), and (Steve Jobs, Laurene Powell, CoupleOf ). If we combine all corrupt triplets with the same missing entity, such as (. . ., Apple Inc., FoundOf ), (. . ., America, Nationality), and (. . ., Laurene Powell, Couple), it is easy to locate that the missing entity 𝑒3 is Steve Jobs. Similarly, if we combine all the corrupt triplets with the same relation, such as (Steve Jobs, Apple Inc., . . .), (Jack Ma, Alibaba, . . .), and (Sundar Pichai, Google, . . .), we can obtain that the missing relation 𝑟1 is FoundOf. The scenario is shown in Figure 2. Hence using correlation between different
entities to represent features is an effective method. However, in practice, it is unsuitable to only use the correction between different entities and omit the inherent features entities have, such as the attributes of each entity which are hard to represent with the correlations between different entities. Therefore, we construct the independent space which can preserve the inherent features each entity has. We combine both independent and associated spaces to represent overall features of entities and relations, which can in turn represent the knowledge graph more comprehensively. The motivation of employing both types of spaces is to model correlation while reserving individual specificity. Compared with other embedding models, vector embedding has evident advantages on time and memory-space complexities. We evaluate SimE-E and SimE-ER on the popular tasks of entity prediction and relation prediction. The experiment results validate the competitive results achieved by the proposed method compared with previous models. Contributions. To summarize, the main contributions of this paper are as follows: (i) We propose a similarity-based embedding model, namely, SimE-ER. In SimE-ER, we consider the entity and relation similarities of different spaces simultaneously, which can extract the features of entities and relations comprehensively. (ii) Compared with other embedding models, our model has lower time and space complexity, which improves
Scientific Programming the effectiveness of processing large-scale knowledge graphs. (iii) Through thorough experiments on real-life datasets, our approach is demonstrated to outperform the existing state-of-the-art models in entity prediction and relation prediction tasks. Organization. We discuss related work in Section 2 and then introduce our method, along with the theoretical analysis, in Section 3. Afterwards, experimental studies are presented in Section 4, followed by conclusion in Section 5.
2. Related Work In this section, we introduce several related works [19] published in recent years which get the state-of-the-art results. According to the relation features, we divide embedding models into two parts: matrix-based embedding models [27] and vector-based embedding models [28]. 2.1. Matrix-Based Embedding Models. In this part, matrices (tensors) are used to describe relation features. Structured Embedding. Structured Embedding Model (SE) [29] considers that head and tail entities are overlapping in a specific-relation space R𝑛 where the triplet (ℎ, 𝑟, 𝑡) exists. It uses two mapping matrices M𝑟ℎ and M𝑟𝑡 to extract feature from ℎ and 𝑡. Single Layer Model. Compared with SE, Single Layer Model (SLM) [30] uses a nonlinear activation function to translate the extracted features and considers the features after activation to be orthogonal with relation features. The extracted features are comprised of the entities’ features after mapping and a bias of their relation. Neural Tensor Network. Neural Tensor Network (NTN) [30, 31] is a more complex model and considers that the tensor can be regarded as better feature extractor compared with matrices. Semantic Matching Energy. The basic idea of Semantic Matching Energy (SME) [32] is that if the triplet is correct, the feature of head entity and tail entity is orthogonal. Similar to SLM, the features of head (tail) entity are comprised of the entities’ features after mapping and a bias of their relation. There are two methods to extract features, i.e., linear and nonlinear. Latent Factor Model. Latent Factor Model (LFM) [33, 34] assumes that features of head entity are orthogonal with those of tail entity when the head entity is mapped in specificrelation space. Its score function can be defined as 𝑓𝑟 (ℎ, 𝑡) = hT Mr t, where h, Mr , t denote the features of head entity, relation, and tail entity, respectively. 2.2. Vector-Based Embedding Models. In this part, relations are described as vector rather than matrix to improve the effectiveness of representation models. Translation-Based Model. The basic idea of translationbased model, TransE [23, 35, 36], is that the relation r is a translation vector between h and t. The score function is 𝑓𝑟 (h, t) = ‖h + r − t‖𝐿 1 /𝐿 2 , where h, r, and t denote
3 the head entity, relation, and tail entity embeddings, respectively. Because TransE only processes simple relations, other translation-based models [37–39] are proposed to improve TransE. Combination Embedding Model. CombinE [40] describes the relation features with the plus and minus combination of each pair. Compared with other translation-based models, CombinE can represent relation features in a more comprehensive way. Bilinear-Diag Model. DistMult [41] uses a formulation of bilinear model to represent entities and relations and utilizes the learned embedding to extract logical rules. Holographic Embedding Model. HOLE [42] utilizes a compositional vector space based on the circular correlation of vectors, which creates fixed-width representations. The compositional representation has the same dimensionality as the representation of its constituents. Complex Embedding Model. ComplEx [43] divides entities and relations into two parts, i.e., real part and imaginary part. Real part denotes the features of symmetric relation, and imaginary part denotes the features of asymmetric relations. Project Embedding Model. ProjE [44], a shared variable neural network model, uses two-diagonal matrix to extract the entity and relation features and calculate the similarity between features and candidate entity. In training, the correct triplets have high similarity. Convolutional Embedding Model. ConvE [45] transfers the features into 2D space and uses convolutional neural network to extract the entity and relation features. Compared with matrix-based embedding models, vectorbased models have obviously advantages on time and memory-space complexities. In these vector-based models, TransE is a classical baseline and has been applied on many applications, TransR is an improved method of TransE which solves the complex relation types, and DistMult and ComplEx use probability-based method to represent knowledge and achieve state-of-the-art results.
3. Similarity-Based Model Given a training set 𝑆+ of triplets, each triplet (ℎ, 𝑟, 𝑡) has two entities ℎ, 𝑡 ∈ E (the set of entities) and relationship 𝑟 ∈ R (the set of relationship). Our model learns the entities embeddings (hi , ti , ha , ta ) and relationship embeddings (ri , ra ) to represent the feature of entities and relations, where the subscripts 𝑖, 𝑎 denote the independent and associated space. The entity embedding and relation embedding take value in R𝑑 , where 𝑑 is the dimension of entity and relation embedding spaces. 3.1. Our Models. The basic idea of our model is that, for each entity (relation), the features are divided into two parts. The first part describes inherent features of entities (relations) in independent space. The feature embedding vectors can be denoted as hi , ri , ti . The second part signs triplet features in associated space, and the feature embedding vectors can be denoted as ha , ra , ta . In independent space, the feature vectors are described as the inherent features entities (relations) have. In associated space, the features of ha are comprised
4
Scientific Programming
of other entities and relations which connect with entity ha . The entities (relations) in associated space are projections of entities (relations) in independent space. Hence the representation features of the same entity in independent and associated space are similar, while the representation features of different entities are not similar. The formula can be described as follows: h i ≈ r a ⊙ ta ,
(1)
r i ≈ ha ⊙ ta ,
(2)
ti ≈ ha ⊙ ra ,
(3)
where ⊙ denotes element-wise product. In detail, in (1), if we combine the features of ra and ta , we can obtain part of the hi features. That is to say, the hi features are similar with ra ⊙ta . In this paper, we use Cosine to calculate the similarity between different spaces. Taking head entity as an example, the Cosine similarity between different spaces can be denoted as 𝐷𝑜𝑡 (h , r ⊙ t ) 𝑆𝑢𝑚 (h ⊙ r ⊙ t ) cos (hi , ra ⊙ ta ) = i a a = i a a (4) hi ra ⊙ ta hi ra ⊙ ta
where Dot denotes the dot-product and Sum denotes the summation over the vector element. 𝑆𝑢𝑚(hi ⊙ra ⊙ta ) calculates the similarity, and ‖hi ‖ ‖ra ⊙ ta ‖ constrain the length of features. To reduce the training complexity, we just consider the numerator and use regularization items to replace the denominator. Hence the similarity of head entity features in independent and graph spaces can be described as 𝑆𝑖𝑚 (ℎ) = 𝑆𝑢𝑚 (hi ⊙ ra ⊙ ta ) .
3.2. Training. To learn the proposed embedding and encourage the discrimination between golden triplets and incorrect triplets, we minimize the following logistic ranking loss function over the training set: ∑ log (1 + exp (−𝑌ℎ𝑟𝑡 𝑆𝑖𝑚 (ℎ, 𝑟, 𝑡; Θ))) ,
𝐿=
(h,r,t)∈𝑆
where Θ corresponds to the embeddings hi , ha , ri , ra , ti , ta ∈ R𝑑 and 𝑌ℎ𝑟𝑡 is a label of triplet. 𝑌ℎ𝑟𝑡 = 1 denotes that (ℎ, 𝑟, 𝑡) is positive and 𝑌ℎ𝑟𝑡 = −1 denotes that (ℎ, 𝑟, 𝑡) is negative. 𝑆 is a triplets set [28] which contains both positive triplets set 𝑆+ and negative triplets set 𝑆− . 𝑆− = {(ℎ , 𝑟, 𝑡) | ℎ ∈ 𝐸} ∪ {(ℎ, 𝑟, 𝑡 ) | 𝑡 ∈ 𝐸} ∪ {(ℎ, 𝑟 , 𝑡) | 𝑟 ∈ 𝑅} .
= 𝑆𝑢𝑚 (hi ⊙ ra ⊙ ta ) + 𝑆𝑢𝑚 (ha ⊙ ra ⊙ ti ) .
∀hi , ti ∈ |𝐸| , ri ∈ |𝑅| , hi = 1, ri = 1, ti = 1,
(5)
𝑆𝑖𝑚 (ℎ, 𝑟, 𝑡) = 𝑆𝑖𝑚 (ℎ) + 𝑆𝑖𝑚 (𝑟) + 𝑆𝑖𝑚 (𝑡) = 𝑆𝑢𝑚 (hi ⊙ ra ⊙ ta ) + 𝑆𝑢𝑚 (ha ⊙ ri ⊙ ta )
∀ha , ta ∈ |𝐸| ,
(7)
+ 𝑆𝑢𝑚 (ha ⊙ ra ⊙ ti ) . The embedding model based on the similarity of entity and relation is named as SimE-ER.
(10)
ra ∈ |𝑅| , ha ⊙ ra = 1, ha ⊙ ta = 1, ra ⊙ ta = 1.
(6)
The embedding model based on the similarity of head and tail entities is named as SimE-E. On the basis of entity similarity, we need to consider relation similarity, which can enhance the representation of relation features. The comprehensive model, which considers all the similarities of entity (relation) features in different spaces, can be described as
(9)
The set of negative triplets, constructed according to (9), is composed of training triplets with either head (tail) entity or relation replaced by a random entity or relation. Only one entity or relation is replaced for each corrupted triplet with the same probability. To prevent overfitting, some constraints are considered when minimizing the loss function 𝐿:
We expect that the value of hi ⊙ ra ⊙ ta is larger when hi and ra ⊙ta denote the same head entity, while the value of hi ⊙ra ⊙ta is smaller otherwise. To represent entities in a more comprehensive way, we consider the similarity of head and tail entities simultaneously. The score function can be denoted as 𝑆𝑖𝑚 (ℎ, 𝑡) = 𝑆𝑖𝑚 (ℎ) + 𝑆𝑖𝑚 (𝑡)
(8)
Equation (10) is to constrain the length of entity (relation) features for SimE-E and SimE-ER. We convert it to the following loss function by means of soft constraints: 𝐿=
∑ log (1 + exp (−𝑌ℎ𝑟𝑡 𝑆𝑖𝑚 (ℎ, 𝑟, 𝑡; Θ)))
(h,r,t)∈𝑆
+
𝜆 ‖Θ‖22
(11) ,
where 𝜆 is a hyperparameter to weigh the importance of soft constraints. We utilize the improved stochastic gradient descent (Adagrad) [46] to train the models. Comparing with SGD, Adagrad shrinks learning rate effectively when the number of iterations increases, which means that it is insensitive to learning rate.
Scientific Programming
5 Table 1: Complexities of representation models.
Model NTN RESCAL SE SLM LFM TransR DistMult ComplEx TransE SimE-E SimE-ER
Relation Parameters 𝑊𝑟 ∈ R𝑑×𝑑×𝑘 , 𝑀𝑟1 , 𝑀𝑟2 ∈ R𝑑×𝑑 𝑀𝑟 ∈ R𝑑×𝑑 𝑀𝑟ℎ , 𝑀𝑟𝑡 ∈ R𝑑×𝑑 𝑀𝑟1 , 𝑀𝑟2 ∈ R𝑑×𝑑 𝑀𝑟 , ∈ R𝑑×𝑑 𝑟 ∈ R𝑑 , 𝑀𝑟 ∈ R𝑑×𝑑 𝑟 ∈ R𝑑 𝑟 ∈ R𝑑 𝑟 ∈ R𝑑 𝑟 ∈ R𝑑 𝑟 ∈ R𝑑
Memory-Space Complexity 𝑂(𝑛𝑒 𝑑 + 𝑛𝑟 𝑑2 𝑘 + 2𝑛𝑟 𝑑2 + 𝑛𝑟 𝑑) 𝑂(𝑛𝑒 𝑑 + 𝑛𝑟 𝑑2 ) 𝑂(𝑛𝑒 𝑑 + 2𝑛𝑟 𝑑2 ) 𝑂(𝑛𝑒 𝑑 + 2𝑛𝑟 𝑑2 + 2𝑛𝑟 𝑑) 𝑂(𝑛𝑒 𝑑 + 𝑛𝑟 𝑑2 ) 𝑂(𝑛𝑒 𝑑 + 𝑛𝑟 𝑑2 + 𝑛𝑟 𝑑) 𝑂(𝑛𝑒 𝑑 + 𝑛𝑟 𝑑) 𝑂(2𝑛𝑒 𝑑 + 2𝑛𝑟 𝑑) 𝑂(𝑛𝑒 𝑑 + 𝑛𝑟 𝑑) 𝑂(2𝑛𝑒 𝑑 + 𝑛𝑟 𝑑) 𝑂(2𝑛𝑒 𝑑 + 2𝑛𝑟 𝑑)
Time Complexity 𝑂(𝑑2 𝑘) 𝑂(𝑑2 ) 𝑂(𝑑2 ) 𝑂(𝑑2 ) 𝑂(𝑑2 ) 𝑂(𝑑2 ) 𝑂(𝑑) 𝑂(𝑑) 𝑂(𝑑) 𝑂(𝑑) 𝑂(𝑑)
Table 2: Dataset statistics. Dataset WN18 FB15K FB40K
#Entity 40,934 14,951 37,591
#Relation 18 1,345 1,317
3.3. Comparison with Existing Models. To compare the time and memory-space complexities between different models, we show the results in Table 1, where 𝑑 represents the dimension of entity and relation embeddings, 𝑘 is the number of tensor’s slices, and 𝑛𝑒 and 𝑛𝑟 are the numbers of entities and relations, respectively. The comparison results are showed as follows: (i) Except for DistMult and TransE, the baselines use relation matrix to project entities’ features into relation space, which makes these models have high memory-space and time complexities. Compared with these models, SimE-E and SimE-ER have lower time complexity. SimE-E and SimE-ER can be used on large-scale knowledge graphs more effectively. (ii) In comparison to TransE, SimE-E and SimE-ER can dynamically control the ratio of positive and negative triplets. It enhances the robustness of representation models. (iii) Compared with SimE-E and SimE-ER, DistMult is a special case of them when we only consider single similarity of entity or relation. That is to say, SimEE and SimE-ER can extract the features of entities (relations) more comprehensively.
4. Experiments and Analysis In this section, our models SimE-E and SimE-ER are evaluated and compared with several baselines which have been shown to achieve state-of-the-art performance. Firstly, two classical tasks are adopted to evaluate our models: entity prediction and relation prediction. Then, we use cases to verify the effectiveness of our models. Finally, according to the practical experimental results, we analyze the time and memory-space costs.
#Train 141,442 483,142 325,350
#Valid 5,000 50,000 5,000
#Test 5,000 59,071 5,000
4.1. Datasets. We use two real-life knowledge graphs to evaluate our method: (i) WordNet (https://wordnet.princeton.edu/download), a classical dictionary, is designed to describe correlation and semantic information between different words. Entities are used to describe the concepts of different words, and relationships are defined to describe the semantic relevance between different entities, such as instance hypernym, similar to, and member of domain topic. The data version we use is the same as [23] where triplets are denoted as (sway 2, has instance, brachiate 1) or (felis 1, member meronym, catamount 1). A subset of WordNet is adopted, named as WN18 [23]. (ii) Freebase (code.google.com/p/wiki-links), a huge and continually growing knowledge graph, describes large amount of facts in the world. In Freebase, entities are described by labels, and relations are denoted by a hierarchical structure, such as “/𝑡V/𝑡V𝑔 𝑒𝑛𝑟𝑒/ 𝑝𝑟𝑜𝑔𝑟𝑎𝑚𝑠” and “/𝑚𝑒𝑑𝑖𝑐𝑖𝑛𝑒/𝑑𝑟𝑢𝑔 𝑐𝑙𝑎𝑠𝑠/𝑑𝑟𝑢𝑔𝑠”. We employ two subsets of Freebase, named as FB15K and FB40K [23]. We show the statistics information of datasets in Table 2. From Table 2, we see that, compared with WN18, FB15K and FB40K have more relationships and can be regarded as the typical large-scale knowledge graphs. 4.2. Experiment Setup Evaluation Protocol. For each triplet in the test set, each item of triplets (head entity or tail entity or relation) is removed and replaced by items in the dictionary in turn, respectively. Using score function to calculate these corrupted triplets and sorting the scores by ascending order, the rank of the
6
Scientific Programming
correct entities or relations is stored. For relation in each test triplet, the whole procedure is repeated. In fact, we need to consider that some correct triplets are generated in the process of removing and replacement. Hence, we filter out the correct triplets from corrupted triplets which actually exist in training and validation sets. The evaluation measure before filtering is named as “Raw”, and the measure after filtering is named as “Filter”. We used two evaluation measures to evaluate our approach which is similar to [42]: (i) MRR is an improved measure of MeanRank [23] which calculates the average rank of all the entities (relations) and calculates the average reciprocal rank of all the entities (relations). Compared with MeanRank, MRR is less sensitive to outliers. We report the results using both Filter and Raw rules. (ii) Hits@𝑛 reports the ratio of correct entities in Topn ranked entities. Because the number of entities is much larger than that of relations, we take Hits@1, Hits@3, Hits@10 for entity prediction task and take Hits@1, Hits@2, Hits@3 for relation prediction task. A state-of-the-art embedding model should have higher MRR and Hits@𝑛. Baselines. Firstly, we compare the proposed methods with CP which uses canonical polyadic decomposition to extract the entities and relation features; then we compare the proposed methods with TransE which considers that tail entity features are close to the combined features of head entity and relation. Besides TransR [47], ER-MLP [48], DistMult [41], and ComplEx [43] are also used for comparison with our methods. We train CP [49], DistMult, ComplEx, TransE, and TransR using the codes provided by authors. We choose the length of dimension 𝑑 among {20, 50, 100, 200}, the weight of regularization 𝜆 among {0, 0.003, 0.01, 0.1, 0.5, 1}, the learning rate among {0.001, 0.01, 0.1, 0.2, 0.5}, and the ratio of negative and correct samples 𝛾 among {1, 5, 10, 50, 100}. The negative samples in different epochs are different. Implementation. For experiments using SimE-E and SimE-ER, we select the dimension of the entity and the relation 𝑑 among {50, 100, 150, 200}, the weight of regularization 𝜆 among {0, 0.01, 0.1, 0.5, 1}, the ratio of negative and correct samples 𝛾 among {1, 5, 10, 50, 100}, and the mini-batch size 𝐵 among {100, 200, 500, 1,000}. We utilized the improved stochastic gradient descent (Adagrad) [46] to train the loss function. With the iteration epoch increasing, the learning rate in Adagrad is decreases, and Adagrad is insensitive to learning rate. The initial values of both SimE-E and SimEER are generated by Random function, and the range is (−6/√𝑑, 6/√𝑑), where 𝑑 is the dimension of feature vector. Training is stopped using early stopping on the validation set MRR (using the Filter measure), computed every 50 epochs with a maximum of 2000 epochs. In SimE-E model, the optimal configurations on validation set are (i) 𝜆 = 1, 𝛾 = 10, 𝑑 = 150, 𝐵 = 100 on WN18, (ii) 𝜆 = 1, 𝛾 = 20, 𝑑 = 200, 𝐵 = 200 on FB15K,
(iii) 𝜆 = 1, 𝛾 = 20, 𝑑 = 300, 𝐵 = 100 on FB40K. In SimE-ER model, the optimal configurations on validation set are (i) 𝜆 = 1, 𝛾 = 10, 𝑑 = 150, 𝐵 = 100 on WN18, (ii) 𝜆 = 1, 𝛾 = 20, 𝑑 = 200, 𝐵 = 200 on FB15K, (iii) 𝜆 = 1, 𝛾 = 20, 𝑑 = 300, 𝐵 = 100 on FB40K. T-test. In experiments, for each model, we run 15 times independently and calculate the mean and standard deviation. Then we use Student’s t-test with 𝑝 − V𝑎𝑙𝑢𝑒 = 0.95 to compare the performance between different models, and the t-test can be shown as follows [50, 51]. 𝜇1 and 𝑠1 are mean and standard deviation on model 1 with run 𝑛1 times; 𝜇2 and 𝑠2 are mean and standard deviation on model 2 with 𝑛2 times. Then we can construct the hypothesis: 𝐻0 : 𝜇1 − 𝜇2 ≤ 0,
(12)
𝐻1 : 𝜇1 − 𝜇2 > 0. And the t-test can be described as 𝑡=
𝜇1 − 𝜇2 √1/𝑛1 + 1/𝑛2 √(𝑛1 𝑠1 2 + 𝑛2 𝑠2 2 ) / (𝑛1 + 𝑛2 − 2)
.
(13)
The degree of freedom (𝑑𝑓) in t-distribution can be shown as follows: 𝑑𝑓 =
(𝑠1 2 /𝑛1 + 𝑠2 2 /𝑛2 ) 2
2 2
(1/ (𝑛1 − 1)) (𝑠1 2 /𝑛1 ) + (1/ (𝑛2 − 1)) (𝑠2 2 /𝑛2 )
(14)
In entity and relation prediction tasks, we calculate mean and standard deviation of MRR and Hit@𝑛 and compare their performance with t-test. 4.3. Link Prediction. For link prediction [52–54], we tested two subtasks—entity prediction and relation prediction. Entity prediction aims to predict the missing ℎ or 𝑡 entity from the fact triplet (ℎ, 𝑟, 𝑡); similarly, relation prediction is to determine which relation is more suitable for a corrupted triplet (ℎ, ∗, 𝑡). Entity Prediction. This set of experiments tests the models’ ability to predict entities. Experimental results of mean and plus/minus standard deviation on both WN18 and FB15K are shown in Tables 3, 4, and 5, and we can observe the following: (i) On WN18, a small-scale knowledge graph, ComplEx achieves state-of-the-art results on MRR and Hits@𝑛. However, on FB15K and FB40K, two large-scale knowledge graphs, SimE-E and SimE-ER achieve excellent results on MRR and Hits@𝑛, and the values of Hits@10 are up to 0.868 and 0.889, respectively. The outstanding results prove that our models can represent different kinds of knowledge graphs effectively, especially on large-scale knowledge graphs.
Scientific Programming
7 Table 3: Experimental results of entity prediction on WN18. WN18
Model CP DistMult ER-MLP TransE TransR ComplEx SimE-E SimE-ER
MRR Filter 0.065 ±0.002 0.821 ±0.003 0.712 ±0.002 0.445 ±0.002 0.415 ±0.002 0.936 ±0.003 0.823 ±0.003 0.821±0.002
Raw 0.051 ±0.001 0.530 ±0.002 0.508 ±0.003 0.318 ±0.002 0.414 ±0.003 0.575 ±0.002 0.572 ±0.002 0.576 ±0.002
1 0.043 ±0.002 0.728 ±0.002 0.626 ±0.002 0.081 ±0.002 0.378 ±0.002 0.933±0.001 0.726 ±0.001 0.726 ±0.002
Hits@𝑛 3 0.069 ±0.001 0.914 ±0.002 0.775 ±0.002 0.801 ±0.001 0.635 ±0.003 0.939 ±0.001 0.917 ±0.002 0.914 ±0.002
10 0.107 ±0.002 0.930 ±0.001 0.863 ±0.003 0.937 ±0.003 0.724 ±0.001 0.940±0.001 0.938±0.001 0.940 ±0.002
Table 4: Experimental results of entity prediction on FB15K. FB15K Model CP DistMult ER-MLP TransE TransR ComplEx SimE-E SimE-ER
MRR Filter 0.333 ±0.003 0.650 ±0.003 0.288 ±0.002 0.481 ±0.004 0.376 ±0.003 0.691 ±0.003 0.740 ±0.002 0.727 ±0.003
Raw 0.153 ±0.002 0.242 ±0.003 0.155 ±0.002 0.220 ±0.002 0.201 ±0.004 0.241 ±0.002 0.259±0.002 0.261 ±0.002
1 0.229 ±0.004 0.537 ±0.004 0.173 ±0.005 0.259 ±0.005 0.245 ±0.002 0.596 ±0.003 0.666±0.002 0.636 ±0.003
Hits@𝑛 3 0.381 ±0.003 0.738 ±0.003 0.317 ±0.005 0.651 ±0.002 0.435 ±0.002 0.752 ±0.002 0.795 ±0.003 0.797±0.002
10 0.531±0.004 0.828 ±0.003 0.501±0.001 0.813±0.002 0.634 ±0.003 0.838 ±0.003 0.860 ±0.003 0.868±0.003
Table 5: Experimental results of entity prediction on FB40K. FB40K Model CP DistMult ER-MLP TransE TransR ComplEx SimE-E SimE-ER
MRR Filter 0.448 ±0.002 0.573 ±0.003 0.296 ±0.001 0.574 ±0.003 0.355 ±0.001 0.680 ±0.001 0.816 ±0.001 0.810 ±0.001
Raw 0.274 ±0.002 0.407 ±0.003 0.167 ±0.004 0.383 ±0.001 0.198 ±0.001 0.408 ±0.002 0.439 ±0.002 0.445 ±0.002
(ii) ComplEx is better than SimE-ER on WN18, and the reason is that ComplEx can distinguish symmetric and antisymmetric relationship contained in the relation structure of WN18. However, on FB15K and FB40K, SimE-E and SimE-ER are better than ComplEx. The reason is that the number of relations is much larger than WN18, and the relation structure is more complex and hard to represent, which has obvious influence on the representation ability of ComplEx. (iii) The results of SimE-E and SimE-ER are similar to each other. The largest margin is filtered MRR on FB15K at 0.013. The phenomenon demonstrates that
1 0.392 ±0.003 0.493 ±0.002 0.181 ±0.001 0.422 ±0.002 0.224 ±0.002 0.586 ±0.002 0.781 ±0.002 0.756 ±0.002
Hits@𝑛 3 0.479 ±0.002 0.613 ±0.002 0.332 ±0.003 0.687 ±0.003 0.441 ±0.002 0.753 ±0.002 0.848 ±0.002 0.852 ±0.002
10 0.549±0.002 0.720±0.003 0.498±0.003 0.808±0.001 0.612±0.001 0.837±0.002 0.874±0.002 0.889±0.002
both SimE-E and SimE-ER can extract the entity features in knowledge graph and predict the missing entities effectively. (iv) Compared with DistMult, the special case of our models, SimE-E and SimE-ER achieve better results, especially on FB15K, and the filter MRR is up to 0.740. The results can prove that our models which use irrelevant and interconnected features to construct independent and associated spaces can represent the entities and relations features more comprehensively. We use t-test to evaluate the effectiveness of our models, and the evaluation results can prove that on FB15K
8
Scientific Programming Table 6: Experimental results of relation prediction on WN18. WN18
Model CP DistMult ER-MLP TransE TransR ComplEx SimE-E SimE-ER
MRR Filter 0.551 ±0.003 0.731 ±0.003 0.707 ±0.002 0.739 ±0.002 0.415 ±0.003 0.866 ±0.003 0.812±0.002 0.814 ±0.002
Raw 0.550 ±0.002 0.730 ±0.002 0.513 ±0.002 0.739 ±0.001 0.414 ±0.003 0.865 ±0.003 0.812 ±0.001 0.814 ±0.001
1 0.405 ±0.002 0.535 ±0.002 0.614 ±0.001 0.622 ±0.002 0.378 ±0.003 0.830±0.001 0.770±0.002 0.775 ±0.001
Hits@𝑛 2 0.540 ±0.002 0.922 ±0.002 0.815 ±0.003 0.729 ±0.002 0.635 ±0.002 0.953 ±0.002 0.954±0.002 0.955 ±0.002
3 0.629±0.001 0.938 ±0.002 0.877 ±0.002 0.811 ±0.002 0.724 ±0.001 0.961±0.002 0.962±0.001 0.965±0.001
Table 7: Experimental results of relation prediction on FB15K. FB15K Model CP DistMult ER-MLP TransE TransR ComplEx SimE-E SimE-ER
MRR Filter 0.361 ±0.002 0.309 ±0.003 0.412 ±0.003 0.245 ±0.002 0.416 ±0.002 0.566 ±0.002 0.579±0.002 0.593 ±0.002
Raw 0.308 ±0.001 0.285 ±0.003 0.268 ±0.002 0.281 ±0.002 0.343 ±0.002 0.490 ±0.001 0.523 ±0.001 0.534 ±0.001
1 0.240 ±0.002 0.116 ±0.002 0.236 ±0.003 0.275 ±0.003 0.270 ±0.001 0.371 ±0.002 0.321±0.002 0.331±0.002
Hits@𝑛 2 0.347 ±0.002 0.289 ±0.002 0.573 ±0.003 0.339 ±0.002 0.448 ±0.002 0.646 ±0.001 0.708±0.002 0.737±0.001
3 0.411 ±0.002 0.412 ±0.004 0.631 ±0.003 0.381 ±0.003 0.573 ±0.002 0.701 ±0.002 0.823 ±0.002 0.842±0.002
Table 8: Experimental results of relation prediction on FB40K. FB40K Model CP DistMult ER-MLP TransE TransR ComplEx SimE-E SimE-ER
MRR Filter 0.295 ±0.002 0.470 ±0.002 0.377 ±0.002 0.461 ±0.001 0.431 ±0.002 0.576 ±0.002 0.589 ±0.002 0.603 ±0.002
Raw 0.192 ±0.002 0.407 ±0.001 0.257 ±0.002 0.373 ±0.002 0.312 ±0.003 0.496 ±0.003 0.513 ±0.002 0.531 ±0.003
and FB40K, compared with other baselines, our results achieve significant improvements, e.g., on the Hits@10 results of ComplEx and SimE-ER, 𝑡 = 26.45 which is larger than 𝑡0.95 (28) = 1.701. The t-test results can prove that, on FB15K and FB40K, our experimental results achieve significant improvement compared with other baselines. Relation Prediction. This set of experiments tests the models’ ability to predict relations. Tables 6, 7, and 8 show the prediction performance on WN18 and FB15K. From the tables, we discover the following: (i) Similar to the results in the entity prediction, on WN18, ComplEx achieves better results on MRR and Hits@1, and SimE-ER obtains better results
1 0.231 ±0.002 0.310 ±0.002 0.231 ±0.002 0.245 ±0.001 0.263 ±0.001 0.329 ±0.003 0.326 ±0.003 0.336 ±0.003
Hits@𝑛 2 0.300 ±0.003 0.536 ±0.003 0.567 ±0.002 0.442 ±0.001 0.411 ±0.002 0.595 ±0.002 0.606 ±0.002 0.637 ±0.001
3 0.332±0.003 0.801±0.003 0.611±0.002 0.521±0.003 0.514±0.002 0.790±0.001 0.844±0.001 0.843±0.001
on Hits@2 and Hits@3. On FB15K, besides the value of Hits@1, the results of SimE-ER are better than ComplEx and other baselines, and the value of Hits@3 is up to 0.842, which is much higher (improvement of 20.1%) than the state-of-the-art baselines. ON FB40K, SimE-ER achieves state-ofthe-art results on all the measures; in particular, the filter MRR is up to 0.603. (ii) In entity prediction task, the results of SimE-E and SimE-ER are similar. However, in relation prediction tasks, SimE-ER achieves significant results on Raw MRR, Hits@2, and Hits@3. We use the t-test to verify the results, and the t-values are larger than
Scientific Programming
9 Table 9: MRR for each relation on WN18.
Relation Name hypernym hyponym derivationally related form member holonym member meronym has part part of instance hypernym synset domain topic of member of domain topic instance hyponym also see verb group synset domain region of member of domain region member of domain usage synset domain usage of similar to
#Tri 1251 1153 1074 278 253 172 165 122 114 111 108 56 39 37 26 24 14 3
SimE-ER 0.937 0.788 0.964 0.715 0.682 0.675 0.685 0.703 0.792 0.695 0.661 0.769 0.977 0.736 0.468 0.463 0.928 1.000
𝑡0.95 (28) = 1.701. The difference between entity and relation tasks can demonstrate that considering both entity and relation similarity can extract relation features more effectively on the basis of ensuring the entity-features extraction. (iii) On FB15K, the gap is significant and SimE-E and SimE-ER outperform other models, with a MRR (Filter) of 0.593 and 0.842 of Hits@3. On both datasets, CP and TransE perform the worst, which illustrates the feasibility of learning knowledge embedding in the first case and the power of using two mutual restraint parts to represent entities and relations in the second. We also use t-test to evaluate our model; i.e., comparing SimE-ER with ComplEx on filter MRR, 𝑡 = 35.72, which is larger than 𝑡0.95 (28) = 1.701. The t-test results can prove that the performance of SimE-ER is better than other baselines on FB15K and FB40K. To analyze the relation features, Table 9 shows the MRR with Filter of each relation on WN18, where #𝑇𝑟𝑖 denotes the number of triplets for each relation in the test set. From Table 9, we conclude the following: (i) For almost all relations on WN18, compared with other baselines, SimE-E and SimE-ER achieve competitive results, which demonstrates that our methods can extract different types of latent relation features. (ii) Compared with SimE-E, the relation MRRs of SimEER are much better on most relations, such as hypernym, hyponym, and derivationally related form. (iii) On almost all results of relation MRR, SimE-ER is better than DistMult, a special case of SimE-ER. That is to say, compared with single embedding space,
SimE-E 0.927 0.520 0.963 0.603 0.767 0.602 0.819 0.856 0.847 0.523 0.561 0.680 0.977 0.819 0.799 0.578 0.761 1.000
ComplEx 0.933 0.910 0.946 0.914 0.767 0.933 0.931 0.799 0.813 0.714 0.945 0.603 0.936 1.000 0.788 0.780 1.000 1.000
DistMult 0.701 0.732 0.959 0.701 0.55 0.667 0.690 0.726 0.584 0.799 0.651 0.727 0.973 0.694 0.504 0.507 0.750 1.000
using two different spaces to describe entity and relation, features can achieve better performance. Case Study. Table 10 shows the detailed prediction results on test set of FB15K. It illustrates the performance of our models. Given head and tail entities, the top-5 predicted relations and relative scores of SimE-ER are depicted in Table 10. From the table, we observe the following: (i) In triplet 1, the relation prediction result is ranked on top-2, and in triplet 2, the result is top-1. The relation prediction results can prove the performance of SimE-ER. However, in triplet 1, the correct result (top-2) has similar score with other prediction results (top-1, top-3). That is to say, it is difficult for SimE-ER to distinguish similar relationships. (ii) For any relation prediction results, the top-5 relation prediction results are similar; that is to say, similar relations have similar representation embeddings, which is in line with common sense. 4.4. Complexity Analysis. To compare the time and memoryspace complexity of different models, we show the analytical results of FB15K in Table 11, where 𝑑 represents the dimension of entity and relation space, “Mini-batch” represents the mini-batch of each iteration, “Params” denotes the number of parameters in each model on FB15K, and “Time” denotes the running time of each iteration. Note that all models are run on standard hardware of Inter(R) Core(TM) i7U 3.5GHz + GeForce GTX TITAN. We report the average running time over one hundred iterations as the running time of each iteration. From Table 11, we observe the following: (i) Except for DistMult, SimE-E and SimE-ER have lower time and memory complexities compared with
10
Scientific Programming Table 10: Case study of SimE-ER.
Triplet 1
/m/02rgz97 /music/group member/artists supported /m/012d9h
Score
Results
1 /music/group member/membership./music/group membership/group 2 /music/group member/artists supported 3 /music/group member/instruments played 4 /music/group member/membership./music/group membership/role 5 /music/genre/subgenre
0.997 0.975 0.953 0.913 0.891
Triplet 2
/m/02hrh1q /organization/role/governors./organization/member /m/03mnk
Score
Results
1 /organization/role/governors./organization//member 2 /organization/role/leaders./organization/leadership/organization 3 /organization/organization sector/organizations in this sector 4 /organization/organization member/member of./organization/organization 5 /people/appointed role/appointment./people/appointment/appointed by
0.994 0.983 0.946 0.911 0.767
Table 11: Complexities comparison. Model RESCAL NTN TransR TransE DistMult SimE-E SimE-ER
𝑑 100 100 100 200 200 200 200
Mini-batch 200 100 2145 2145 100 200 200
the baselines, because in SimE-E and SimE-ER, we only use element-wise products between entities’ and relations’ vectors to generate the representation embedding. (ii) On FB15K, the time costs of SimE-E and SimE-ER in each iteration are 5.37s and 6.63s, respectively, which are lower than 7.53s, the time cost of TransE which has fewer parameters. The reason is that the minibatch of TransE is 2415 which is much larger than the mini-batches of SimE-E and SimE-ER. Besides, for SimE-E and SimE-ER, the number of iterations is 700 times with 3760 (s) and 4642 (s), respectively. (iii) Because SimE-E and SimE-ER have low complexity and high accuracy, they can easily be applied to largescale knowledge graph, while using less computing resources and running time.
5. Conclusion In this paper, we propose a novel similarity-based embedding model SimE-ER that extracts features from knowledge graph. SimE-ER considers that the similarity of the same entities (relations) is high in independent and associated spaces. Compared with other representation models, SimEER is more effective in extracting the entity (relation) features and represents entity and relation features more flexibly and comprehensively. Besides, SimE-ER has lower time and memory complexities, which indicates that it is applicable on
Params 14.25M 78.40M 14.38M 3.11M 3.11M 5.95M 6.22M
Time (s) 121.36 347.65 95.96 7.53 3.23 5.37 6.63
large-scale knowledge graphs. In experiments, our approach is evaluated on entity prediction and relation prediction tasks. The results prove that SimE-ER achieves state-of-theart performances. We will explore the following future work: (i) In addition to the facts in knowledge graph, there also are large amount of logic and hierarchical correlations between different facts. How to translate these hierarchical and logic information into low-dimensional vector space is an attractive and valuable problem. (ii) In real world, extracting relations and entities from large-scale text information is an important yet open problem. Combining latent features of knowledge graph and text sets is a feasible method to construct the connection between structured and unstructured data. It is supposed to enhance the accuracy and efficiency of entity (relation) extraction.
Data Availability All the datasets used in this paper are fully available without restriction upon request.
Conflicts of Interest The authors declare that there are no conflicts of interest regarding the publication of this paper.
Scientific Programming
11
Acknowledgments
[16] S. A. El-Sheikh, M. Hosny, and M. Raafat, “Comment on ‘rough multisets and information multisystems’,” Advances in Decision Sciences, vol. 2017, 3 pages, 2017. [17] M. Richardson and P. Domingos, “Markov logic networks,” Machine Learning, vol. 62, no. 1-2, pp. 107–136, 2006. [18] C. Kemp, J. B. Tenenbaum, T. L. Griffiths, T. Yamada, and N. Ueda, “Learning systems of concepts with an infinite relational model,” in AAAI2006, pp. 381–388, 2006. [19] Q. Wang, Z. Mao, B. Wang, and L. Guo, “Knowledge graph embedding: A survey of approaches and applications,” IEEE Transactions on Knowledge and Data Engineering, vol. 29, no. 12, pp. 2724–2743, 2017. [20] Y. Bengio, R. Ducharme, P. Vincent, and C. Jauvin, “A neural probabilistic language model,” Journal of Machine Learning Research, vol. 3, pp. 1137–1155, 2003. [21] M. Nickel, V. Tresp, and H.-P. Kriegel, “A three-way model for collective learning on multi-relational data,” in Proceedings of the 28th International Conference on Machine Learning, ICML ’11, pp. 809–816, July 2011. [22] J. Weston, A. Bordes, O. Yakhnenko, and N. Usunier, “Connecting language and knowledge bases with embedding models for relation extraction,” in Proceedings of the 2013 Conference on Empirical Methods in Natural Language Processing, EMNLP ’13, pp. 1366–1371, October 2013. [23] A. Bordes, N. Usunier, A. Garca-Dur´an, J. Weston, and O. Yakhnenko, “Translating embeddings for modeling multirelational data,” in NIPS2013, pp. 2787–2795, 2013. [24] L. Wondie and S. Kumar, “A joint representation of Renyi’s and Tsalli’s entropy with application in coding theory,” International Journal of Mathematics and Mathematical Sciences, vol. 2017, Article ID 2683293, 5 pages, 2017. [25] W. Cui, Y. Xiao, H. Wang, Y. Song, S.-W. Hwang, and W. Wang, “KBQA: Learning question answering over QA corpora and knowledge bases,” in Proceedings of the 43rd International Conference on Very Large Data Bases, VLDB ’17, vol. 10, pp. 565– 576, September 2017. [26] B. Yang and T. Mitchell, “Leveraging knowledge bases in lstms for improving machine reading,” in Proceedings of the 55th Annual Meeting of the Association for Computational Linguistics, pp. 1436–1446, Vancouver, Canada, July 2017. [27] Q. Liu, H. Jiang, Z. Ling, S. Wei, and Y. Hu, “Probabilistic reasoning via deep learning: Neural association models,” CoRR, abs/1603.07704, 2016. [28] S. He, K. Liu, G. Ji, and J. Zhao, “Learning to represent knowledge graphs with gaussian embedding,” in Proceedings of the the 24th ACM International Conference on Information and Knowledge Management, pp. 623–632, Melbourne, Australia, October 2015. [29] A. Bordes, J. Weston, R. Collobert, and Y. Bengio, “Learning structured embeddings of knowledge bases,” in AAAI2011, pp. 301–306, 2011. [30] R. Socher, D. Chen, C. D. Manning, and A. Y. Ng, “Reasoning with neural tensor networks for knowledge base completion,” in NIPS2013, pp. 926–934, 2013. [31] G. E. Hinton, S. Osindero, and Y. Teh, “A fast learning algorithm for deep belief nets,” Neural Computation, vol. 18, no. 7, pp. 1527– 1554, 2006. [32] A. Bordes, X. Glorot, J. Weston, and Y. Bengio, “Joint learning of words and meaning representations for open-text semantic parsing,” Journal of Machine Learning Research, vol. 22, pp. 127– 135, 2012.
This work was partially supported by NSFC under Grants nos. 71690233 and 71331008.
References [1] Y. Wang, N. Wang, and L. Zhou, “Keyword query expansion paradigm based on recommendation and interpretation in relational databases,” Scientific Programming, vol. 2017, 12 pages, 2017. [2] A. Bordes, J. Weston, and N. Usunier, “Open question answering with weakly supervised embedding models,” in Machine Learning and Knowledge Discovery in Databases, pp. 165–180, Springer, 2014. [3] A. Bordes, S. Chopra, and J. Weston, “Question Answering with Subgraph Embeddings,” in Proceedings of the 2014 Conference on Empirical Methods in Natural Language Processing (EMNLP ’14), A meeting of SIGDAT, a Special Interest Group of the ACL, pp. 615–620, Doha, Qatar, October 2014. [4] B. Han, L. Chen, and X. Tian, “Knowledge based collection selection for distributed information retrieval,” Information Processing & Management, vol. 54, no. 1, pp. 116–128, 2018. [5] J. Berant, A. Chou, R. Frostig, and P. Liang, “Semantic parsing on freebase from question-answer pairs,” in Proceedings of the 2013 Conference on Empirical Methods in Natural Language Processing, EMNLP ’13, A meeting of SIGDAT, a Special Interest Group of the ACL, pp. 1533–1544, Seattle, Wash, USA, 2013. [6] S. Hakimov, S. A. Oto, and E. Dogdu, “Named entity recognition and disambiguation using linked data and graph-based centrality scoring,” in Proceedings of the 4th International Workshop on Semantic Web Information Management, SWIM’12, Scottsdale, Ariz, USA, May 2012. [7] J. Nikkil¨a, P. T¨or¨onen, S. Kaski, J. Venna, E. Castr´en, and G. Wong, “Analysis and visualization of gene expression data using self-organizing maps,” Neural Networks, vol. 15, no. 8-9, pp. 953– 966, 2002. [8] L. C. Freeman, “Cliques, Galois lattices, and the structure of human social groups,” Social Networks, vol. 18, no. 3, pp. 173– 187, 1996. [9] P. P. Ray, “A survey on visual programming languages in internet of things,” Scientific Programming, vol. 2017, 6 pages, 2017. [10] H. Tian and P. Liang, “Personalized Service Recommendation Based on Trust Relationship,” Scientific Programming, vol. 2017, pp. 1–8, 2017. [11] G. A. Miller, “WordNet: a lexical database for English,” Communications of the ACM, vol. 38, no. 11, pp. 39–41, 1995. [12] K. Bollacker, C. Evans, P. Paritosh, T. Sturge, and J. Taylor, “Freebase: A collaboratively created graph database for structuring human knowledge,” in SIGMOD2008, pp. 1247–1249, 2008. [13] S. Auer, C. Bizer, G. Kobilarov, J. Lehmann, R. Cyganiak, and Z. G. Ives, “Dbpedia: A nucleus for a web of open data,” in Proceedings of the 6th International Semantic Web Conference, pp. 722–735, 2007. [14] F. M. Suchanek, G. Kasneci, and G. Weikum, “Yago: a core of semantic knowledge,” in Proceedings of the 16th International World Wide Web Conference (WWW ’07), pp. 697–706, Alberta, Canada, May 2007. [15] A. Carlson, J. Betteridge, B. Kisiel, B. Settles et al., “Toward an architecture for never-ending language learning,” in Proceedings of the Twenty-Fourth AAAI Conference on Artificial Intelligence, AAAI ’10, Atlanta, Ga, USA, 2010.
12 [33] R. Jenatton, N. L. Roux, A. Bordes, and G. Obozinski, “A latent factor model for highly multi-relational data,” in NIPS2012, pp. 3176–3184, 2012. [34] I. Sutskever, R. Salakhutdinov, and J. B. Tenenbaum, “Modelling relational data using Bayesian clustered tensor factorization,” in Proceedings of the 23rd Annual Conference on Neural Information Processing Systems (NIPS ’09), pp. 1821–1828, British Columbia, Canada, December 2009. [35] R. Xie, Z. Liu, J. Jia, H. Luan, and M. Sun, “Representation learning of knowledge graphs with entity descriptions,” in Proceedings of the 30th AAAI Conference on Artificial Intelligence, AAAI ’16, pp. 2659–2665, February 2016. [36] H. Xiao, M. Huang, and X. Zhu, “Transg: A Generative Model for Knowledge Graph Embedding,” in Proceedings of the 54th Annual Meeting of the Association for Computational Linguistics, pp. 2316–2325, Berlin, Germany, August 2016. [37] J. Feng, M. Huang, M. Wang, M. Zhou, Y. Hao, and X. Zhu, “Knowledge graph embedding by flexible translation,” in KR2016, pp. 557–560, 2016. [38] Y. Jia, Y. Wang, H. Lin, X. Jin, and X. Cheng, “Locally adaptive translation for knowledge graph embedding,” in AAAI2016, pp. 992–998, 2016. [39] T. Ebisu and R. Ichise, “Toruse: Knowledge graph embedding on a lie group,” CoRR, abs/1711.05435, 2017. [40] Z. Tan, X. Zhao, and W. Wang, “Representation Learning of Large-Scale Knowledge Graphs via Entity Feature Combinations,” in Proceedings of the 2017 ACM on Conference on Information and Knowledge Management, pp. 1777–1786, Singapore, November 2017. [41] B. Yang, W. Yih, X. He, J. Gao, and L. Deng, “Embedding entities and relations for learning and inference in knowledge bases,” CoRR, abs/1412.6575, 2014. [42] M. Nickel, L. Rosasco, and T. A. Poggio, “Holographic embeddings of knowledge graphs,” in AAAI2016, pp. 1955–1961, 2016. [43] T. Trouillon, J. Welbl, S. Riedel, E. Ciaussier, and G. Bouchard, “Complex embeddings for simple link prediction,” in Proceedings of the 33rd International Conference on Machine Learning, ICML ’16, pp. 3021–3032, June 2016. [44] B. Shi and T. Weninger, “Proje: embedding projection for knowledge graph completion,” in Proceedings of the Thirty-First AAAI Conference on Artificial Intelligence, pp. 1236–1242, San Francisco, Calif, USA, 2017. [45] T. Dettmers, P. Minervini, P. Stenetorp, and S. Riedel, “Convolutional 2d knowledge graph embeddings,” CoRR, abs/1707.01476, 2017. [46] M. D. Zeiler, “ADADELTA: an adaptive learning rate method,” CoRR, abs/1212.5701, 2012. [47] Y. Lin, Z. Liu, M. Sun, Y. Liu, and X. Zhu, “Learning entity and relation embeddings for knowledge graph completion,” in Proceedings of the Twenty-Ninth AAAI Conference on Artificial Intelligence, pp. 2181–2187, 2015. [48] X. Dong, E. Gabrilovich, G. Heitz et al., “Knowledge vault: a web-scale approach to probabilistic knowledge fusion,” in SIGKDD2014, pp. 601–610, 2014. [49] J. Wu, Z. Wang, Y. Wu, L. Liu, S. Deng, and H. Huang, “A Tensor CP decomposition method for clustering heterogeneous information networks via stochastic gradient descent algorithms,” Scientific Programming, vol. 2017, Article ID 2803091, 13 pages, 2017. [50] R. J. Rossi, A. Webster, H. Brightman, and H. Schneider, “Applied statistics for business and economics,” The American Statistician, vol. 47, no. 1, p. 76, 1993.
Scientific Programming [51] D. Anderson, D. Sweeney, T. Williams, J. Camm, and J. Cochran, Statistics for Business & Economics, Cengage Learning, 2013. [52] D. Liben-Nowell and J. Kleinberg, “The link prediction problem for social networks,” in Proceedings of the 2003 ACM CIKM International Conference on Information and Knowledge Management, pp. 556–559, New Orleans, La, USA, November 2003. [53] M. A. Hasan and M. J. Zaki, “A survey of link prediction in social networks,” in Social Network Data Analytics, pp. 243–275, Springer, New Yok, NY, USA, 2011. [54] C. Dai, L. Chen, and B. Li, “Link prediction based on sampling in complex networks,” Applied Intelligence, vol. 47, no. 1, pp. 1–12, 2017.
Advances in
Multimedia Applied Computational Intelligence and Soft Computing Hindawi www.hindawi.com
Volume 2018
The Scientific World Journal Hindawi Publishing Corporation http://www.hindawi.com www.hindawi.com
Volume 2018 2013
Mathematical Problems in Engineering Hindawi www.hindawi.com
Volume 2018
Engineering Journal of
Hindawi www.hindawi.com
Volume 2018
Hindawi www.hindawi.com
Modelling & Simulation in Engineering Hindawi www.hindawi.com
Volume 2018
Advances in
Artificial Intelligence Hindawi www.hindawi.com
Volume 2018
Volume 2018
Advances in International Journal of
Reconfigurable Computing
Hindawi www.hindawi.com
Fuzzy Systems
Submit your manuscripts at www.hindawi.com
Hindawi www.hindawi.com
Volume 2018
Volume 2018
Journal of
Hindawi www.hindawi.com
International Journal of
Advances in
Scientific Programming
Engineering Mathematics
Human-Computer Interaction Volume 2018
Hindawi www.hindawi.com
Computer Networks and Communications
Volume 2018
Hindawi www.hindawi.com
Advances in
Civil Engineering Volume 2018
Hindawi www.hindawi.com
Volume 2018
Hindawi www.hindawi.com
Volume 2018
International Journal of
Biomedical Imaging
International Journal of
Robotics Hindawi www.hindawi.com
Journal of
Computer Games Technology
Journal of
Volume 2018
Hindawi www.hindawi.com
Electrical and Computer Engineering Volume 2018
Hindawi www.hindawi.com
Volume 2018
Hindawi www.hindawi.com
Volume 2018
Computational Intelligence and Neuroscience Hindawi www.hindawi.com
Volume 2018