Received 2001 July 7; accepted 2001 August 10; published 2001 September 6. ABSTRACT. We study the subsurface meridional flow in the Sun as a function of ...
The Astrophysical Journal, 559:L175–L178, 2001 October 1 ! 2001. The American Astronomical Society. All rights reserved. Printed in U.S.A.
SOLAR CYCLE VARIATIONS OF SUBSURFACE MERIDIONAL FLOWS IN THE SUN Dean-Yi Chou and De-Chang Dai Physics Department, Tsing Hua University, Hsinchu 30043, Taiwan, Republic of China Received 2001 July 7; accepted 2001 August 10; published 2001 September 6
ABSTRACT We study the subsurface meridional flow in the Sun as a function of latitude and depth in the period from 1994 to 2000, covering the solar minimum in 1996 and the maximum in 2000, with the technique of timedistance helioseismology. It is found that the velocity of meridional flow increased when solar activity decreased from 1994 to 1997. As solar activity increased from 1997 to 2000, a new component of meridional flow, centered at about 20" latitude, was created in each hemisphere. It moves away from its center. The new flow changes the observed meridional flow from poleward at solar minimum to equatorward at solar maximum at low latitudes. The velocity of the new component increases with depth at least down to a depth of 70,000 km. Subject headings: Sun: activity — Sun: interior — Sun: oscillations — sunspots images taken with the Taiwan Oscillation Network (TON) in the period from 1994 to 2000, about two-thirds solar cycle, to study the variations of meridional flow in the convection zone with the solar cycle.
1. INTRODUCTION
An axisymmetric flow in the Sun’s meridian planes has been proposed to balance the latitudinal dependence of energy transport due to rotation (Weiss 1965; Durney & Roxburgh 1971). The surface meridional flow has been extensively studied by using tracers on the surface (Howard & Gilman 1986; Komm, Howard, & Harvey 1993; Snodgrass & Dailey 1996; NesmeRibes, Meunier, & Vince 1997; Meunier 1999) or directly measuring the surface Doppler shifts (Duvall 1979; LaBonte & Howard 1982; Hathaway et al. 1996), both yielding the poleward motion in each hemisphere, with a peak magnitude of 10–20 m s!1. The first convincing evidence of subsurface meridional flow was obtained by measuring the difference between northward and southward acoustic wave travel times with the technique of time-distance helioseismology (Giles et al. 1997). Its follow-up measurements show that the meridional flow extends through the entire solar convection zone (0.71–1.0 R,; Giles 1999). Inversion of measured travel time difference infers that the meridional flow in the convection zone has a single-cell pattern if the mass conservation is imposed (Giles 1999). Material in the upper convection zone moves poleward from the equator to about 60" latitude with a peak velocity of 20 m s!1 and returns equatorward in the lower convection zone. Measurements with ring diagrams (Basu, Antia, & Tripathy 1999; Basu & Antia 2000; Gonzalez Hernandez et al. 1999) and frequency shifts (Braun & Fan 1998) also show evidence of subsurface meridional flow. The meridional flow in the convection zone plays an important role in the dynamics of the Sun. It could carry magnetic remnants of active regions to higher latitudes (Wang, Nash, & Sheeley 1989). It plays a role in the generation of differential rotation (Gilman & Miller 1986). It may interact with magnetic fields in the convection zone. Hence, it is important to study the variations of meridional flow with the solar cycle. It has been reported that the surface meridional flow remains poleward during the solar cycle, but its velocity varies with the solar cycle: the velocity at the surface is smaller at solar maximum than at minimum (Komm et al. 1993; Meunier 1999). The result using the ring diagram technique shows the variation of velocity of meridional flow near the surface with the solar cycle (Basu & Antia 2000). Giles (1999) studied the variation of subsurface meridional flow in the period 1996–1998 and found a smaller velocity at high latitudes in 1998. Here we adopt the same technique of time-distance helioseismology as Giles (1999) to analyze a half-million solar
2. OBSERVATIONS AND DATA ANALYSIS
The TON data used in this study are the K line full-disk images taken at three sites: Big Bear (California), Tenerife (Spain), and Tashkent (Uzbekistan). They were recorded by a 16 bit 1080 # 1080 water-cooled CCD at a rate of one image per minute (Chou et al. 1995). The time series taken at each site each day is analyzed separately. A total of 1013 time series in the period from 1994 to 2000 are analyzed. The data reduction procedure for each time series is as follows. (1) Each observed K line full-disk image is transformed into coordinates of sin v and f, where v and f are the latitude and the longitude, respectively, in a spherical coordinate system aligned along the solar rotation axis. (2) The oscillatory amplitude is computed by subtracting the 15-frame running mean from the intensity time series at each spatial point. (3) The data are filtered with a Gaussian filter of FWHM p 1 mHz centered at 3.5 mHz. (4) The cross-correlation function between two points at the same longitude is computed with C(v, f, D, t) p
!
W(v ! D/2, f, t)
# W(v " D/2, f, t " t)dt,
(1)
where (v ! D/2, f) and (v " D/2, f) are the coordinates of two points, D is the angular distance between two points, and t is the time shift. (5) The computation of the cross-correlation function is repeated for different v, f, D, and t. The step of sin v is 1/512 in a range of !62". 5 ! v ! 62". 5. The step of f is 0". 176 in a range of !60" ! f ! 60". The step of t is 1 minute. The step of D is 0". 2. The range of D is 1"–11" for 1994–1996 and 1"–21" for 1997–2000. (6) The cross-correlation functions C(v, f, D, t) are averaged to increase the signal-to-noise ratio. First, C(v, f, D, t) are averaged over longitude f to become C(v, D, t). Second, C(v, D, t) are binned every 5" in latitude v. (7) The above procedure is repeated for different time series. The crosscorrelation functions C(v, D, t) from the same site in the same year are averaged to increase the signal-to-noise ratio. (8) The phase travel time is determined from the instantaneous phase of L175
L176
SUBSURFACE MERIDIONAL FLOWS IN SUN
Vol. 559
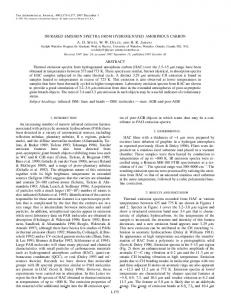
Fig. 2.—Time difference dt vs. latitude for 1997–2000. It is averaged over angular distance D p 6"–10". The results are from the data taken at Big Bear. Here the error bars of only one curve are shown, and the error bars of other curves are similar.
Fig. 1.—Time difference dt vs. latitude for different years. It is the average over angular distance D p 2"–6". The upper panel is for the declining phase of Cycle 22 (1994–1997). The lower panel is for the rising phase of Cycle 23 (1997–2000). The results are from the data taken at Big Bear. Here the error bars of only one curve are shown, and the error bars of other curves are similar.
the yearly averaged cross-correlation function with a Hilbert transform technique (Bracewell 1986). The procedure is carried out for both positive and negative t to obtain northward and southward travel times, respectively. 3. MERIDIONAL FLOW
The difference between the northward and southward travel times, dt(v, D), is caused by the longitude-averaged meridional flow along the ray path at latitude v (Giles et al. 1997; Giles 1999) The positive dt corresponds to northward motion, and the negative to southward motion. Different travel distances D correspond to different ray paths. The larger the travel distance, the deeper the ray path is. Hence, the time difference dt(v, D) carries information on the velocity distribution of subsurface meridional flow in the convection zone. Although it is necessary to invert dt(v, D) to obtain the velocity of subsurface meridional flow as a function of latitude and depth, forward and inversion computations have shown that dt is approximately linearly proportional to the flow speed in the mode cavity: a time difference of 1 s corresponds to a flow speed of about 10 m s!1 (Giles, Duvall, & Scherrer 1998; Giles 1999). For a fixed D, dt(v, D) is approximately antisymmetric with respect to the equator with a shape similar to a sine function as the previous results (Giles et al. 1997, 1998; Giles 1999).
Figure 1 shows dt averaged over D p 2"–6" (corresponding to lower turning points at 0.987–0.962 R,) versus latitude v from the data taken at Big Bear for different years. It is clear that dt varies with the solar cycle, but the variations in the declining phase of Cycle 22 (1994–1997) and the rising phase of Cycle 23 (1997–2000) are different. In the declining phase, the curve of dt remained as a sine function shape, but its magnitude increased with time. The increase in dt in the declining phase extends down to the depth limit of our investigation, ∼0.93 R,. In the rising phase of the solar cycle, the temporal variation of dt is more complicated. The magnitude of variation is greater for larger travel distances, as shown in Figure 2 for D p 6"– 10" (corresponding to 0.962–0.938 R,). The changes at low latitude and midlatitude have opposite signs in each hemisphere. This change could be seen more clearly by subtracting dt of 1997 from dt in the rising phase, as shown in the upper panel of Figure 3. The change in dt relative to dt of 1997 is approximately antisymmetric with respect to the equator. In each hemisphere, it is approximately antisymmetric with respect to 20" latitude. This indicates that a new component of meridional flow was created in the range from the equator to about 40" in each hemisphere as solar activity increased. The additional component is a divergent flow centered at 20" latitude. Its magnitude increased with solar activity to become comparable to the magnitude of the original meridional flow at solar maximum. It was superposed on the original poleward meridional flow such that the observed dt was reversed to become equatorward at low latitudes in 1999 and 2000 in both hemispheres as shown in Figure 2. That is, the additional component transformed the single-cell pattern at solar minimum into a two-cell pattern at solar maximum. The magnitude of the additional component increases with travel distance up to D p 16" (dt is too noisy to give useful information for D 1 16"), as shown in the lower panel of Figure 3. This indicates that the velocity of the additional component increases with depth at least down to 0.9 R,. Although Figure 3 shows only the results from the data taken at Big Bear, it is of importance to note that the results from the data taken at Tenerife and Tashkent also show the similar new component of meridional flow but with higher noise because there is less useful data from the latter two sites. The
No. 2, 2001
CHOU & DAI
Fig. 3.—Time difference in the rising phase relative to that of 1997. The upper panel is the average over angular distance D p 6"–10" for different years. In each hemisphere, it is approximately antisymmetric with respect to about 20" latitude. This indicates that a new component of meridional flow centered at 20" latitude was created as solar activity increased. This new component, from the equator to 40" in each hemisphere, moves away from its center. Its magnitude increased with solar activity. Here only the error bars of one curve are shown, and the error bars of other curves are similar. The lower panel is the time difference of 2000 relative to that of 1997 for three distance ranges: D p 2"–6", D p 6"–10", and D p 10"–16". Here we show only the error bars of D p 10"–16", which are greater than the other two angles. The results are from the data taken at Big Bear.
data from different sites are analyzed separately because the offset of dt is sensitive to the orientation of images (Giles 1999), which is different from site to site. It has been proposed that the offset of dt, corresponding to an equator-crossing meridional flow, in the previous study might be caused by a misalignment of the instrument (Giles et al. 1997). Although we do not have information on the alignment of the TON instrument, our test has shown that the relative offset of dt between different sites is consistent with the relative orientation of images between different sites. Thus, we believe that the offset of dt in our study is mainly caused by the misalignment of the instrument. It should be noted that the offset of dt would not affect the variation of dt with the solar cycle. One may worry that the new component detected here is caused by the spurious signals in magnetic regions generated in the process of subtracting the running mean due to misregistration among images. To test it, we have repeated the data
L177
reduction for the Big Bear data of 2000 by excluding the pairs, which have at least one point inside the magnetic regions. We find that the result is little changed and the additional outward component centered at 20" latitude in each hemisphere remains unchanged. The center of the new component of meridional flow approximately coincides with the center of sunspot distribution. They both moved from ∼25" to ∼15" latitude from 1998 to 2000. This suggests that the creation of the new component is due to the presence of magnetic fields. One possibility is that the additional component has the same origin as the well-known surface phenomenon of material moving outward from sunspots (Sheeley 1969; Brickhouse & LaBonte 1988). It has been suggested that subsurface magnetic fields associated with a sunspot inhibit convection and cause heat accumulation beneath the sunspot, which in turn drives flows around the sunspot (Nye, Bruning, & LaBonte 1988). If the new component detected here is driven by the same mechanism, it has to operate deep in the convection zone because the magnitude of the new component increases with depth, at least down to 0.9 R,. The new component of meridional flow can be used as a tool to probe magnetic fields deep in the convection zone. It is of interest to note that the curves of 1999 and 2000 in Figure 2 have some similarity to the surface meridional flow using sunspots as tracers (Nesme-Ribes et al. 1997). The findings here pose a challenge for future work. First, the temporal variation of the subsurface meridional flow in the rising phase of Cycle 23 is different from that in the second half of the declining phase of Cycle 22. Will the additional component continue to increase after the solar maximum of Cycle 23? When will it disappear and the latitudinal dependence of dt return to the shape of a sine function? Second, the magnitude of the additional component increases with depth at least down to 0.9 R,. Does it penetrate into the entire convection zone? At which depth does the equatorward flow at low latitudes return to form a close loop? To answer these questions, the signal-to-noise ratio of dt for larger travel distances needs to be improved and dt needs to be inverted to obtain the velocity distribution. Third, what is the origin of the additional meridional flow? What is its role in the dynamics of the solar cycle? Is it related to the variation of solar rotation in the convection zone? How does the meridional flow interact with the magnetic fields in the convection zone? Can we use the measured additional component of meridional flow to infer magnetic fields in the convection zone? We thank D. L. Duvall, Jr. for his comments on the manuscript. We are grateful to the GONG Data Team for providing the software package GRASP. D.-Y. C. deeply thanks all members of the TON Team who were dedicated to the long-term observation. The TON Team includes Ming-Tsung Sun (ChangGung University, Taiwan), Antonio Jimenez (Instituto Astrofisica de Canarias, Spain), Guoxiang Ai and Honqi Zhang (Huairou Solar Observing Station, PRC), Philip Goode and William Marquette (Big Bear Solar Observatory), and Shuhrat Ehgamberdiev and Oleg Ladenkov (Ulugh Beg Astronomical Institute, Uzbekistan). The authors and the TON project were supported by NSC of ROC under grant NSC-89-2112-M-007064.
L178
SUBSURFACE MERIDIONAL FLOWS IN SUN
Vol. 559
REFERENCES Basu, S., & Antia, H. M. 2000, Sol. Phys., 192, 469 Basu, S., Antia, H. M., & Tripathy, S. C. 1999, ApJ, 512, 458 Bracewell, R. N. 1986, The Fourier Transform and Its Applications (New York: McGraw-Hill) Braun, D. C., & Fan, Y. 1998, ApJ, 508, L105 Brickhouse, N. S., & LaBonte, B. J. 1988, Sol. Phys., 115, 43 Chou, D.-Y., et al. 1995, Sol. Phys., 160, 237 Durney, B. R., & Roxburgh, I. W. 1971, Sol. Phys., 16, 3 Duvall, T. L., Jr. 1979, Sol. Phys., 63, 3 Giles, P. M. 1999, Ph.D. thesis, Stanford Univ. Giles, P. M., Duvall, T. L., Jr., & Scherrer, P. H. 1998, in Proc. SOHO 6/ GONG 98 Workshop on Structure and and Dynamics of the Sun and Sunlike Stars, ed. S. Korzennik & A. Wilson (ESA SP-418; Noordwijk: ESA), 775 Giles, P. M., Duvall, T. L., Jr., Scherrer, P. H., & Bogart, R. S. 1997, Nature, 390, 52
Gilman, P. A., & Miller, J. 1986, ApJS, 61, 585 Gonza´lez Herna´ndez, I., Patron, J., Bogart, R. S., & the SOI Ring Diagram Team. 1999, ApJ, 510, L153 Hathaway, D. H., et al. 1996, Science, 272, 1306 Howard, R. F., & Gilman, P. A. 1986, ApJ, 307, 389 Komm, R. W., Howard, R. F., & Harvey, J. W. 1993, Sol. Phys., 147, 207 LaBonte, B. J., & Howard, R. F. 1982, Sol. Phys., 80, 361 Meunier, N. 1999, ApJ, 527, 967 Nesme-Ribes, E., Meunier, N., & Vince, I. 1997, A&A, 321, 323 Nye, A., Bruning, D., & LaBonte, B. J. 1988, Sol. Phys., 115, 251 Sheeley, N. R., Jr. 1969, Sol. Phys., 9, 347 Snodgrass, H. B., & Dailey, S. B. 1996, Sol. Phys., 163, 21 Wang, Y.-M., Nash, A. G., & Sheeley, N. R. 1989, Science, 245, 712 Weiss, N. O. 1965, Observatory, 85, 37