In the above-mentioned Letter, we stated that Boss uses a discontinuous internal energy for H2, where H2 contributes to. 3kT/4mp the specific internal energy e ...
The Astrophysical Journal, 660: L175, 2007 May 10 䉷 2007. The American Astronomical Society. All rights reserved. Printed in U.S.A.
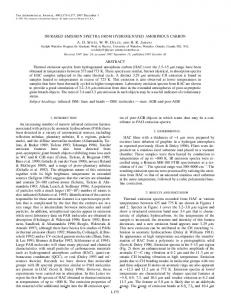
ERRATUM: “THE INTERNAL ENERGY FOR MOLECULAR HYDROGEN IN GRAVITATIONALLY UNSTABLE PROTOPLANETARY DISKS” (ApJ, 656, L89 [2007]) Aaron C. Boley, Thomas W. Hartquist, Richard H. Durisen, and Scott Michael In the above-mentioned Letter, we stated that Boss uses a discontinuous internal energy for H2, where H2 contributes 3kT/4m p to the specific internal energy e for T ≤ 100 K and 5kT/4m p for T 1 100 K, based on his own citations to A. P. Boss (ApJ, 277, 768 [1984]). It was brought to our attention by A. P. Boss (2007, private communication) that he now uses a quadratic interpolation for e between 100 and 200 K (see Fig. 1, left panel). This change is not mentioned in the literature but is alluded to in A. P. Boss (ApJ, 346, 336 [1989]). According to Boss, the interpolation has been used in all his simulations since Boss (1989). In Figure 1 (right panel), we also illustrate the consequences for G1 of Boss’s latest e approximation by calculating the specific heat at constant volume c v p de/dT and by relating that to G1 (see J. P. Cox & R. T. Giuli, Principles of Stellar Structure [New York: Gordon & Breach, 1968]). This curve is compared with curves for pure para-hydrogen (short-dashed curve), a 3 : 1 ortho/parahydrogen mixture (long-dashed curve), where the species are treated as independent, and an equilibrium mixture (solid curve). Because fragmentation becomes more likely as G1 is lowered (W. K. M. Rice, G. Lodato, & P. J. Armitage, MNRAS, 364, L56 [2005]), Boss’s approximation between 100 and 200 K is likely to make his disks susceptible to fragmentation for that temperature range. We would like to thank A. P. Boss for his discussions and clarification of his code.
Fig. 1.—Left: Profiles of e for an equilibrium mix (solid curve), pure para-hydrogen (short-dashed curve), and a 3 : 1 ortho/para ratio mix (long-dashed curve). The dot-dashed curve indicates the approximation used by Boss. Right: Corresponding G1 profiles for each curve in the left panel. The dotted line indicates G1 p 4/3.
L175