The Astrophysical Journal, 616:L55–L58, 2004 November 20 䉷 2004. The American Astronomical Society. All rights reserved. Printed in U.S.A.
SUBMILLIMETER ARRAY 12CO (J p 3–2) INTERFEROMETRIC OBSERVATIONS OF THE CENTRAL REGION OF M51 Satoki Matsushita,1 Kazushi Sakamoto,2 Cheng-Yu Kuo,1 Pei-Ying Hsieh,3 Dinh-V- Trung,1 Rui-Qing Mao,4 Daisuke Iono,2,5 Alison B. Peck,2 Martina C. Wiedner,2,6 Sheng-Yuan Liu,1 Nagayoshi Ohashi,1 and Jeremy Lim1 Received 2004 March 7; accepted 2004 July 23; published 2004 October 28
ABSTRACT We present the first interferometric CO (J p 3–2) observations (beam size of 3⬙. 9 # 1⬙. 6 or 160 # 65 pc) with the Submillimeter Array (SMA) toward the center of the Seyfert 2 galaxy M51. The image shows a strong concentration at the nucleus and weak emission from the spiral arm to the northwest. The integrated intensity of the central component in 12CO (J p 3–2) is almost twice as high as that in 12CO (J p 1–0), indicating that the molecular gas within an ∼80 pc radius of the nucleus is warm (ⲏ100 K) and dense (∼104 cm⫺3). Similar intensity ratios are seen in shocked regions in our Galaxy, suggesting that these gas properties may be related to active galactic nucleus or starburst activity. The central component shows a linear velocity gradient (∼1.4 km s⫺1 pc⫺1) perpendicular to the radio continuum jet, similar to that seen in previous observations and interpreted as a circumnuclear molecular disk/torus around the Seyfert 2 nucleus. In addition, we identify a linear velocity gradient (0.7 km s⫺1 pc⫺1) along the jet. Judging from the energetics, the velocity gradient can be explained by supernova explosions or energy and momentum transfer from the jet to the molecular gas via interaction, which is consistent with the high-intensity ratio. Subject headings: galaxies: individual (M51, NGC 5194) — galaxies: ISM — galaxies: nuclei — galaxies: Seyfert — ISM: jets and outflows 12
estimated column density of the molecular gas exceeds 10 23 cm⫺2, which is comparable to the amount of obscuring material inferred from X-ray observations (e.g., Terashima & Wilson 2001). 13CO and HCN J p 1–0 observations suggest that the circumnuclear molecular gas is dense (∼105 cm⫺3) and warm (ⲏ300 K; Matsushita et al. 1998, 1999). These conditions suggest that the nuclear disk/torus can be better studied in higher J transitions, such as 12CO J p 3–2 (the critical density for this transition is ∼5 # 10 4 cm⫺3, and the energy of the J p 3 level corresponds to 33 K ). Here we report observations of the central region of M51 with the Submillimeter Array7 (SMA; Ho et al. 2004) in the 12 CO (J p 3–2) line. As anticipated, the central molecular torus/disk emits more strongly in the J p 3–2 than the J p 1–0, but we also detected emission from a spiral arm. We point out that this torus/disk exhibits a velocity gradient not only along its major axis but also along its minor axis parallel to the radio jet.
1. INTRODUCTION
According to the unified scheme as originally suggested by Antonucci & Miller (1985), two types (types 1 and 2) of active galactic nuclei (AGNs) originate from the same object (a supermassive black hole surrounded by an optically thick torus) that is viewed at different angles. This hypothesis has stimulated intensive millimeter-wave interferometric observations to search for molecular tori toward AGNs. For example, images of the prototypical Seyfert 2 galaxy NGC 1068 show a ∼100 pc disk or torus of molecular gas around its AGN, with a rotational axis parallel to the axis of its radio continuum jet (Jackson et al. 1993; Tacconi et al. 1994; Helfer & Blitz 1995). Subarcsecond 12CO (J p 2–1) observations suggest that this torus/disk is warped and viewed nearly edge-on at a radius of less than 110 pc (Schinnerer et al. 2000). On the other hand, recent surveys of Seyfert galaxies suggest that the circumnuclear molecular gas has a wide variety of distributions and does not always exhibit a centrally peaked component (e.g., Kohno et al. 2001). It may be that only a fraction of AGNs have molecular tori detectable in current observations, making detailed studies of such examples especially important. M51 (NGC 5194), a grand-design spiral galaxy at a distance D ∼ 8.4 Mpc (Feldmeier et al. 1997), has a type 2 AGN (Ho et al. 1997). As in the case of NGC 1068, Kohno et al. (1996) showed that the AGN of M51 is surrounded by a ∼100 pc disk/torus of dense molecular gas with a rotational axis parallel to the axis of the central radio jet (Ford et al. 1985). The
2. OBSERVATIONS
The submillimeter-wave aperture synthesis images toward the center of M51 were obtained in the 12CO (J p 3–2) line (rest frequency p 345.796 GHz) with the SMA. The observations were made on 2003 June 12 and 14 during the testing and commissioning phase when a total of four 6 m antennas were available. The SMA correlator had a 0.96 GHz bandwidth at the time and was configured to have a frequency resolution of 0.8125 MHz. We observed Mars and Uranus, respectively, for bandpass and flux calibration, and J1310⫹323 every 20 minutes for amplitude and phase calibration. The uncertainty in the absolute flux scale is estimated to be ∼20%. We calibrated the data using the Owens Valley Radio Observatory software package MIR, which was modified for the SMA. The images were CLEANed using the NRAO software
1 Academia Sinica Institute of Astronomy and Astrophysics, P.O. Box 23141, Taipei 106, Taiwan;
[email protected]. 2 Harvard-Smithsonian Center for Astrophysics, 60 Garden Street, MS 78, Cambridge, MA 02138. 3 Department of Physics, National Taiwan Normal University, 88 Section 4, Ting-Chou Road, Taipei 116, Taiwan. 4 Purple Mountain Observatory, Chinese Academy of Sciences, Nanjing 210 008, China. 5 Department of Astronomy, University of Massachusetts, Amherst, MA 01003. 6 Physikalisches Institut, Universita¨t zu Ko¨ln, 50937 Ko¨ln, Germany.
7 The Submillimeter Array is a joint project between the Smithsonian Astrophysical Observatory and the Academia Sinica Institute of Astronomy and Astrophysics, and is funded by the Smithsonian Institution and the Academia Sinica.
L55
L56
MATSUSHITA ET AL.
Vol. 616
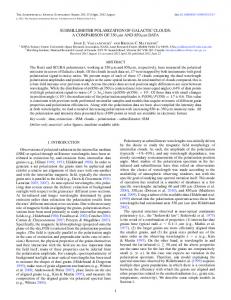
Fig. 2.—Integrated intensity map of the 12CO (J p 3–2) line. The gray scale and the synthesized beam are shown at the top and the bottom left corners, respectively. The plus sign and the circle are the same as in Fig. 1. The contour levels are 2, 3, 4, 6, 9, 12, and 15 j, where 1 j p 5.89 Jy beam⫺1 km s⫺1 (p9.63 K km s⫺1). Primary beam correction is not applied. Fig. 1.—Channel maps of the 12CO (J p 3–2) line of the central region of M51. The synthesized beam (3⬙. 9 # 1⬙. 6 or 160 # 65 pc) is shown at the bottom left corner of the first channel map. LSR velocities are shown at the bottom right corner of each map. The systemic velocity is 472 km s⫺1 (Scoville & Young 1983; Tully 1974). The plus sign and the 36⬙ (1.5 kpc) diameter circle in each map represent the galactic nucleus determined from the 6 cm radio continuum peak (Ford et al. 1985) and the half-power width of the primary beam, respectively. The contour levels are ⫺6, ⫺3, 3, 6, 9, 12, and 15 j, where 1 j p 70.4 mJy beam⫺1 (p0.115 K). Primary beam correction is not applied.
package AIPS, and the resultant angular resolution was 3⬙. 9 # 1⬙. 6 (160 # 65 pc) at a position angle (P.A.) of 146⬚ with natural weighting. We made channel maps with 42 channel binning, which corresponds to a velocity resolution of 29.6 km s⫺1. The typical rms noise level of the channel maps was 70.4 mJy beam⫺1, which corresponds to Tsys, DSB ∼ 700 K. The half-power width of the primary beam at 345 GHz is 36⬙ (1.5 kpc). We did not detect any continuum emission at the rms noise level attained of 18 mJy beam⫺1.
The compact nuclear emission also appears at redshifted velocities in interferometric 12CO (J p 1–0 ) observations by Aalto et al. (1999) and Sakamoto et al. (1999). Similarly, interferometric 12CO (J p 2–1) observations by Scoville et al. (1998) also show predominantly redshifted emission concentrated 1⬙ west of the nucleus but, in addition, relatively weak blueshifted emission east of the nucleus (see their Figs. 1 and 2). The integrated intensity of their blueshifted emission is only 18% of that of the redshifted emission, with a deconvolved size for the blueshifted emission of less than 0⬙. 5. In our map, the redshifted emission was detected at a peak-integrated intensity of 15 j at a beam size of 3⬙. 9 # 1⬙. 6. Assuming that the redshifted and blueshifted emission in J p 3–2 has the same intensity ratio as that in J p 2–1, the blueshifted emission is expected to have a signal-to-noise ratio of less than 2 j. We rule out the possibility that the systemic velocity of the circumnuclear molecular gas differs from that of the host galaxy
3. RESULTS
Channel and integrated-intensity maps in 12CO (J p 3–2) as shown in Figures 1 and 2 show a strong peak at the nucleus at redshifted velocities (with respect to the systemic velocity of 472 km s⫺1; Scoville & Young 1983; Tully 1974). The highest velocity of the compact nuclear emission is ∼616 km s⫺1 (as can also be seen in the position-velocity [PV] diagram of Fig. 3), comparable to the highest velocity seen in the redshifted wing of the 12CO (J p 3–2) spectrum taken with the James Clerk Maxwell Telescope (Matsushita et al. 1999). Our maps also show weak emission from the spiral arm to the northwest of the nucleus (hereafter, the northwestern arm) at blueshifted velocities. The spiral arm to the southeast (hereafter, the southeastern arm) was not detected. The previously published single-dish 12CO (J p 3–2) maps (Wielebinski et al. 1999) also show the intensity asymmetry, i.e., stronger emission from the northwestern than from the southeastern arm.
Fig. 3.—PV diagrams (a) parallel and (b) perpendicular to the radio jet (P.A. ∼165⬚). The velocity resolution is 14.8 km s⫺1. Positions are the offsets from the nucleus. The contour levels are ⫺2, 2, 4, 6, 8, 10, and 12 j, where 1 j p 76.5 mJy beam⫺1 for panel a and 47.8 mJy beam⫺1 for panel b. Dotted horizontal lines show the systemic velocity. Dashed lines show the results of intensity-weighted linear fitting.
No. 1, 2004
SMA 12CO (J p 3–2) OBSERVATIONS OF M51
(472 km s⫺1). Interferometric HCN (J p 1–0) observations by Kohno et al. (1996) show a compact nuclear component with comparable bright redshifted and blueshifted emission placed symmetrically on either side of the nucleus, interpreted as an approximately edge-on rotating disk or torus. The missing flux in our map was estimated by comparing our data with previous single-dish observations. The flux within the central 13⬙ and 24⬙ regions in our 12CO (J p 3–2) map (corrected for primary beam attenuation) is 13.8 K km s⫺1 (228 Jy beam⫺1 km s⫺1) and 8.8 K km s⫺1 (499 Jy beam⫺1 km s⫺1), respectively. The single-dish flux is 43.1 Ⳳ 2.0 K km s⫺1 within 13⬙ (Matsushita et al. 1999) and 47 Ⳳ 7 K km s⫺1 within 24⬙ (Dumke et al. 2001). We therefore recovered only 32% and 19% of the single-dish flux for the central 13⬙ and 24⬙, respectively, suggesting that extended 12CO (J p 3–2) emission exists in the central region. Indeed, the single-dish 12CO (J p 3–2) maps show images very similar to those of the single-dish J p 2–1 or 1–0 maps; i.e., even J p 3–2 emission is rich in extended structures (Wielebinski et al. 1999; Dumke et al. 2001), which support our result. The missing flux of ∼70%–80% is larger, however, than that in the past extragalactic 12CO (J p 1–0) observations of less than 50% (e.g., Sakamoto et al. 1999). The possibility of calibration errors in single-dish data should be low because the above values are consistent with each other and also consistent with the independent Heinrich Hertz Telescope (49 Ⳳ 2 K km s⫺1; Mauersberger et al. 1999) and Caltech Submillimeter Observatory (48.3 K km s⫺1 with 24⬙ beam; Bash et al. 1990) observations. An underestimate of the absolute flux in our data is possible, but this would suggest more extreme conditions in the central region of M51 (see the next paragraph and § 4). We compared the intensities of the nuclear molecular gas components using our 12CO (J p 3–2) data with the interferometric J p 1–0 data (Sakamoto et al. 1999). First, we convolved our J p 3–2 image to the same resolution as that in J p 1–0 (4⬙. 2 # 3⬙. 4). The J p 3–2 and 1–0 line intensities at the nucleus averaged over this beam size (170 # 140 pc) are 91.7 Ⳳ 4.8 and 49.2 Ⳳ 5.2 K km s⫺1, respectively (temperatures are in the Rayleigh-Jeans approximation, and the uncertainties are Ⳳ1 j). The J p 3–2 line is therefore stronger than the J p 1–0 line, with a 12CO (J p 3–2)/(J p 1–0) intensity ratio, R 31, of 1.9 Ⳳ 0.2. This line ratio may be a lower limit, as the J p 1–0 data have shorter baselines than the J p 3–2 data. To remedy this, we truncated the inner uv-plane of the J p 1–0 data to match that in the J p 3–2 data and recomputed the line intensities following the above method. The resultant R 31 at the nucleus averaged over this beam size (3⬙. 9 # 2⬙. 6 or 160 # 110 pc) is ∼5.2 Ⳳ 1.7, where the larger uncertainty reflects the noisier J p 1–0 image due to the inner uv truncation. In the following discussion, we adopt R 31 of 1.9 Ⳳ 0.2, keeping in mind that this is probably a lower limit. We made PV diagrams parallel and perpendicular to the axis of the radio continuum jet (P.A. ∼165⬚) from the nucleus (Fig. 3). To compute the magnitude of the velocity gradient, we first searched for the strongest peak (exceeding 2 j) within a 5⬙ radius of the nucleus at each velocity bin (width of 14.8 km s⫺1) in the PV diagram. We then applied a linear fit to these peaks weighted by their respective intensities. In this way, we inferred a linear velocity gradient perpendicular to the jet axis of 1.39 Ⳳ 0.01 km s⫺1 pc⫺1 and parallel to the jet axis of 0.65 Ⳳ 0.01 km s⫺1 pc⫺1. The sense of the velocity gradient perpendicular to the jet (Fig. 3a) is the same as that found in the past interferometric observations (Kohno et al. 1996; Scoville et al. 1998); the magnitude of the velocity gradient of 1.39 km s⫺1 pc⫺1 is
L57
comparable to that estimated from the interferometric HCN (J p 1–0) observations of 1–2 km s⫺1 pc⫺1 (Matsushita et al. 1998). This velocity gradient is attributed to a nearly edge-on rotating molecular disk or torus around the nucleus. The velocity gradient along the jet has not been previously discussed but can also be seen in the channel/velocity maps in both CO J p 1–0 and 2–1 (see Fig. 2 of Scoville et al. 1998 and Fig. 1q of Sakamoto et al. 1999). On the basis of these arguments, we believe a velocity gradient parallel (as well as perpendicular) to the radio jet exists, although we note that the circumnuclear emission is poorly resolved, and hence the actual magnitude of the velocity gradients may need to be revised when observations at higher angular resolutions become available. 4. DISCUSSION
The R 31 within an ∼80 pc radius of the nucleus of M51 is 1.9 Ⳳ 0.2, more than twice as high as the ratios measured by single-dish telescopes at lower spatial resolutions; line ratios observed with beam sizes of ∼14⬙–24⬙ (∼600–1000 pc) are 0.5–0.8 (Matsushita et al. 1999; Mauersberger et al. 1999; Wielebinski et al. 1999). The physical properties of the circumnuclear molecular gas must therefore be considerably different from those in the disk of the galaxy. We estimated the physical conditions of the circumnuclear molecular gas using the large-velocity gradient (LVG) approximation (Goldreich & Kwan 1974; Scoville & Solomon 1974) assuming a one-zone model. The collision rates for CO in the temperature range 10–250 K were taken from Flower & Launay (1985) and 500–2000 K from McKee et al. (1982). The velocity gradient is estimated to be about 1.39 km s⫺1 pc⫺1 (§ 3). This value is consistent with the gradient caused by the internal turbulence (∼2 km s⫺1 pc⫺1; for a more detailed discussion, see Matsushita et al. 1998). Using the “standard” relative abundance [12CO]/[H2] p 5 # 10⫺5, we find the H2 number density n H 2 ⲏ 10 4 cm⫺3 and the kinetic temperature Tk ⲏ 500 Ⳳ 150 K, with the uncertainties reflecting the uncertainty in R 31. Even for an order of magnitude lower relative abundance or an order of magnitude higher velocity gradient, this model gives n H 2 ⲏ 104 cm⫺3 and Tk ⲏ 95 Ⳳ 15 K. We therefore conclude that the circumnuclear molecular gas is denser and warmer than the molecular gas in the galactic disk. This is consistent with the results of the interferometric 13CO and HCN J p 1–0 observations, which also suggest dense (n H 2 ∼ 10 5 cm⫺3) and warm (Tk ⲏ 300 K) molecular gas based on LVG calculations (Matsushita et al. 1998, 1999). There are several possible reasons for the rather extreme conditions of the molecular gas. One is interaction with the radio jet. Molecular outflows from star-forming regions in our Galaxy show R 31 greater than unity (e.g., Richardson et al. 1985; Hirano & Taniguchi 2001), similar to that in the center of M51. The strongest 12CO (J p 3–2) emission in our channel maps comes from 1⬙ northwest of the nucleus (484 km s⫺1 in Fig. 1), and this also is a region with a high [N ii]/Ha intensity ratio (∼4). The high [N ii]/Ha ratio suggests that relativistic particle heating is dominant (Cecil 1988), which suggests an interaction between the jet and molecular gas. Recent highresolution H2O maser observations reveal that the masers are located close to the nucleus and are possibly associated with the jet (Hagiwara et al. 2001). The velocity range of the H2O masers of 538–592 km s⫺1 is similar to that of the redshifted nuclear emission in our data (see Figs. 1 and 3), which also supports the idea that the molecular gas is interacting with or entrained by the jet. Shock/compression by supernova (SN) explosions is another possibility, since shocked molecular gas
L58
MATSUSHITA ET AL.
around SN remnants in our Galaxy also shows high-intensity ratios (e.g., Arikawa et al. 1999). The linear velocity gradient along the jet axis is an interesting phenomenon, and it is worth considering what may cause this gradient. We first calculate the mass, momentum, and kinetic energy of the molecular gas within the velocity range of 515– 615 km s⫺1, which is away from the systemic velocity. The COto-H2 conversion factor can be estimated using the LVG approximation mentioned above, and the result is ∼1 # 10 20 cm⫺2 (K km s⫺1)⫺1. The mass is calculated using this conversion factor and the intensities of molecular gas. In each channel map within the velocity range, the velocity of the molecular gas is defined as the velocity difference from the systemic velocity, and we assume that the molecular gas is moving along the line of sight. Thus, the estimated values are lower limits. Adding all channel map information, we estimated the mass, momentum, and kinetic energy as 1 # 10 6 M,, 2 # 10 46 g cm s⫺1, and 8 # 10 52 ergs, respectively. Using these values, we discuss the possible causes of the velocity gradient along the jet axis. One is that the molecular gas away from the systemic velocity is entrained by the jet, namely, relativistic particles. The minimum energy of the jet is 6.9 # 10 51 ergs (Crane & van der Hulst 1992), and the momentum is 2 # 10 41 g cm s⫺1, if we assume that the velocity of the relativistic particles is 90% of the speed of light. Crane & van der Hulst (1992) estimated the energy of the jet assuming that the total energy of the jet plasma is 100 times larger than that of electrons. This number can be larger, but it should be smaller than the mass ratio of protons and electrons of about 1800. The actual geometry of the jet and the molecular gas is unclear but should be similar if molecular gas is entrained by the jet. Therefore, the energy of the jet may be similar to that
Vol. 616
of the molecular gas, but the momentum is several orders of magnitude different. This problem is also seen in the study of young stellar objects and still under discussion (e.g., Richer et al. 2000). Another possibility is that the momentum and energy can be transferred from one to another by interaction. If those of the molecular gas along the jet are continuously input by the jet via interaction, the momentum and energy differences between the molecular gas and the jet can be explained. Indeed, the high [N ii]/Ha ratio (an evidence of relativistic heating) and the H2O masers (an evidence of shocked molecular gas) are observed, as mentioned above. These observations support the idea that the energy and momentum of the molecular gas along the jet are transferred from the radio jet via interaction. There are several possible explanations to create the velocity gradient along the jet without considering interaction with the radio jet. SN explosions can be one of the possible causes on the basis of the similarity of R 31, as mentioned above. However, 10 2–10 4 SNe are needed to explain the energy of the molecular gas, if we assume that one SN releases 10 51 ergs and that the energy transfer efficiency is at most 20% (McCray & Kafatos 1987). Alternatively, the velocity gradient along the jet may be due to a warped disk around the AGN (e.g., Schinnerer et al. 2000). In this case, not all the gas is on a plane of a molecular gas disk. Thus, even if most of the gas shows a velocity gradient perpendicular to the jet, some of the gas shows a velocity gradient parallel to the jet. Future SMA observations with higher spatial resolution will provide more detailed information about the molecular gas around the AGN. We thank P. T. P. Ho, J. M. Moran, and M. J. Cai for valuable comments. We also thank all the past and present SMA staffs for designing, constructing, and supporting the SMA.
REFERENCES Aalto, S., Hu¨ttemeister, S., Scoville, N. Z., & Thaddeus, P. 1999, ApJ, 522, 165 Antonucci, R. R. J., & Miller, J. S. 1985, ApJ, 297, 621 Arikawa, Y., Tatematsu, K., Sekimoto, Y., & Takahashi, T. 1999, PASJ, 51, L7 Bash, F., Jaffe, D. T., & Wall, W. F. 1990, in Windows on Galaxies, ed. G. Fabbiano, J. S. Gallagher, & A. Renzini (Dordrecht: Kluwer), 227 Cecil, G. 1988, ApJ, 329, 38 Crane, P. C., & van der Hulst, J. M. 1992, AJ, 103, 1146 Dumke, M., Nieten, Ch., Thuma, G., Wielebinski, R., & Walsh, W. 2001, A&A, 373, 853 Feldmeier, J. J., Ciardullo, R., & Jacoby, G. H. 1997, ApJ, 479, 231 Flower, D. R., & Launay, J. M. 1985, MNRAS, 214, 271 Ford, H. C., Crane, P. C., Jacoby, G. H., Lawrie, D. G., & van der Hulst, J. M. 1985, ApJ, 293, 132 Goldreich, P., & Kwan, J. 1974, ApJ, 189, 441 Hagiwara, Y., Henkel, C., Menten, K. M., & Nakai, N. 2001, ApJ, 560, L37 Helfer, T. T., & Blitz, L. 1995, ApJ, 450, 90 Hirano, N., & Taniguchi, Y. 2001, ApJ, 550, L219 Ho, L. C., Filippenko, A. V., & Sargent, W. L. W. 1997, ApJS, 112, 315 Ho, P. T. P., Moran, J. M., & Lo, F. 2004, ApJ, 616, L1 Jackson, J. M., Paglione, T. A. D., Ishizuki, S., & Nguyen-Q-Rieu. 1993, ApJ, 418, L13 Kohno, K., Kawabe, R., Tosaki, T., & Okumura, S. K. 1996, ApJ, 461, L29 Kohno, K., Matsushita, S., Vila-Vilaro´, B., Okumura, S. K., Shibatsuka, T., Okiura, M., Ishizuki, S., & Kawabe, R. 2001, in ASP Conf. Ser. 249, The Central Kiloparsec of Starbursts and AGN: The La Palma Connection, ed. J. H. Knapen et al. (San Francisco: ASP), 672
Matsushita, S., Kohno, K., Vila-Vilaro´, B., Tosaki, T., & Kawabe, R. 1998, ApJ, 495, 267 ———. 1999, Adv. Space Res., 23, 1015 Mauersberger, R., Henkel, C., Walsh, W., & Schulz, A. 1999, A&A, 341, 256 McCray, R., & Kafatos, M. 1987, ApJ, 317, 190 McKee, C. F., Storey, J. W. V., Watson, D. W., & Green, S. 1982, ApJ, 259, 647 Richardson, K. J., White, G. J., Avery, L. W., Lesurf, J. C. G., & Harten, R. H. 1985, ApJ, 290, 637 Richer, J. S., Shepherd, D. S., Cabrit, S., Bachiller, R., & Churchwell, E. 2000, in Protostars and Planets IV, ed. V. Mannings, A. P. Boss, & S. S. Russell (Tucson: Univ. Arizona Press), 867 Sakamoto, K., Okumura, S. K., Ishizuki, S., & Scoville, N. Z. 1999, ApJS, 124, 403 Schinnerer, E., Eckart, A., Tacconi, L. J., Genzel, R., & Downes, D. 2000, ApJ, 533, 850 Scoville, N. Z., & Solomon, P. M. 1974, ApJ, 187, L67 Scoville, N. Z., & Young, J. S. 1983, ApJ, 265, 148 Scoville, N. Z., Yun, M. S., Armus, L., & Ford, H. 1998, ApJ, 493, L63 Tacconi, L. J., Genzel, R., Bleitz, M., Cameron, M., Harris, A. I., & Madden, S. 1994, ApJ, 426, L77 Terashima, Y., & Wilson, A. S. 2001, ApJ, 560, 139 Tully, R. B. 1974, ApJS, 27, 437 Wielebinski, R., Dumke, M., & Nieten, Ch. 1999, A&A, 347, 634