Key words: Breaks; chromosomal damage, duplications; deletions; fluorescence ... prioritizing human epidemiological studies of paternally mediated abnormal.
14 Laboratory Methods for the Detection of Chromosomal Structural Aberrations in Human and Mouse Sperm by Fluorescence In Situ Hybridization Francesco Marchetti, Debby Cabreros and Andrew J Wyrobek Sum mary The father, like the mother, can transmit genetic defects that are detrimental for development and genetic health for his children, but the mechanisms for paternallymediated abnormal reproductive outcomes remain poorly understood. A battery of sensitive methods has been developed for detecting genetic damage associated with infertility, spontaneous abortions, as well as inherited defects in children such as aneuploidy syndromes, translocation carriers, and certain genetic diseases directly in sperm. Among these, fluorescence in situ hybridization (FISH) sperm-based assays for measuring numerical abnormalities and structural chromosomal aberrations are now available for an expanding number of species including humans, rodents, and several domesticated animals. This new generation of sperm FISH methods have identified several paternal risk factors such as age, various drugs, lifestyles, and various environmental and occupational exposures. These sperm FISH assays provide new opportunities to identify and characterize male reproductive risks associated with genetic, lifestyle and environmental factors. This chapter outlines the laboratory methods for the detection of sperm with chromosomal structural aberrations in humans (ACM assay) and mice (CT8 assay) that have been validated for detecting environmental germ cell mutagens. Key words: Breaks; chromosomal fluorescence In Situ Hybridization
damage,
duplications;
deletions;
1. Intro ducti on
Paternally transmitted chromosomal abnormalities may lead to birth defects and genetic diseases in offspring (1-3). However, the etiologies of numerical From: Methods in Molecular Biology, vol. 410: Environmental Genomics Edited by: C. Cristofre Martin © Humana Press, Totowa, NJ
241
242
Marchetti et al.
and chromosomal defects in sperm and their association with subsequent abnormal reproductive outcomes remain generally unknown. Extensive testing in rodent models have shown that various environmental toxicants, when given to males or females before or after mating, can have profoundly deleterious effects on reproduction, such as infertility, lethality during development, malformations, as well as cancer among offspring (4,5). This has raised concern that certain environmental, occupational or medical exposures can have detrimental effects on the genetic integrity of human male germ cells. Of special concern are longterm chronic low-dose exposures to environmental mutagens like smoking and air pollution that affect large numbers of individuals, or short exposures of more limited populations to very high doses of mutagens such as cancer chemotherapies (1). Paternally mediated abnormal reproductive outcomes may be a consequence of abnormal reproductive physiology, predisposing genetic factors (6), past and present male environmental exposures (7,8), or random errors that occur during spermatogenesis (9). Elucidating the relative contribution of these factors from epidemiological surveys of affected offspring is extremely difficult because the sample sizes of offspring with specific defects are generally too small and prenatal selection against defective embryos vary among different types of genetic and chromosomal defects. This has provided an incentive for developing effective biomarkers to detect genomic damage directly in sperm where greater statistical power can be attained by detecting changes in the frequencies of defective sperm of only a few well-characterized individuals. Fluorescence in situ hybridization (FISH) is an efficient approach for labeling DNA of chromosomes in interphase cells including sperm. Its effectiveness has improved with the availability of chromosome-specific DNA probes for every human chromosome and with the increased emphasis on the importance of scoring criteria (10). Since its introduction, FISH assays evolved from a one to a two, three, and four-chromosome assay using multiple probes specific for each chromosome (11,12). Emphasis has also shifted from using any chromosome for which an effective DNA probe was available to selected use of chromosomes with clinical relevance in human aneuploidy syndromes (13). Human sperm FISH has identified several potential risk factors for chromosomally abnormal sperm including certain lifestyles factors and environmental/occupational exposures (8,14,15). Sperm FISH also has the intrinsic advantage of being broadly applicable to any laboratory and domestic species for which chromosome-region specific probes are available and several multicolor FISH assays have also been developed to detect numerical abnormalities in laboratory animals (16-18). Sperm FISH assays for laboratory animals may provide a platform for systematic tests of the genetic damage to germ cells of the myriads of chemicals present in the environment, and for
Detection of Chromosomal Aberrations by FISH
243
prioritizing human epidemiological studies of paternally mediated abnormal reproductive outcomes. An important recent extension of sperm FISH methods has been the development of assays for detecting human (ACM assay) and rodent (CT8 assay) sperm carrying chromosomal structural aberrations (19, 20). Unlike transmitted germinal aneuploidy, which originates from meiotic no nd isjun tion
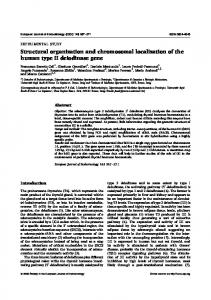
Fig. 1. Sperm FISH labeling strategies for detecting chromosomal structural aberrations in sperm of humans and mice. For both assay the approximate locations of each probe is indicated. (A) ACM assay for the detection of deletions and duplications of chromosome 1p, breaks in the classical satellite region of 1q, as well as numerical abnormalities in human sperm. (B) CT8 assay for detection of deletions and duplications of chromosome 2 and numerical abnormalities of chromosomes 2 and 8.
244
Marchetti et al.
Fig. 2. d-g, (See reference to Pacchierotti and Sgura)
predominantly during oogenesis (6), transmitted de novo structural aberrations tend to originate predominantly during spermatogenesis (9,21,22). Methods for detecting chromosomal aberrations in sperm have in common that two or more loci on a single target chromosome are interrogated simultaneously using two or more fluorescent DNA probes. As shown in Fig. 1A , the ACM assay uses three probes for specific regions of chromosome 1: 1cen (alpha satellite or A), 1q.12 (classical satellite or C), and 1p36.3 (midisatellite or M) to allow the simultaneous detections of three classes of chromosomal defects associated with abnormal reproductive outcomes: 1) numerical abnormalities; 2) segmental duplications and deletions; and 3) chromosomal breaks. The CT8 assay (Fig. 1B) uses a combination of probes specific for the centromeric (C) and telomeric (T) regions of chromosome 2 together with a subtelomeric probe for chromosome to detect three types of damage: (1) duplications and deletions involving chromosome 2; (2) aneuploidies involving chromosome 2 and 8; and (3) sperm diploidy. The specific types of chromosomal aberrations and their associated sperm FISH phenotypes are shown in Tables 1 and 2 for the ACM and CT8 assay, respectively. This chapter describes the laboratory protocols for these two FISH methods for the detection of chromosomal structural aberrations in sperm of humans and mice together with a detail description of the criteria using for collecting data. A description the basic principles of FISH can be found in the chapter of Pacchierotti and Sgrana (this volume). 2. T he Hum an Sper m A CM A ssa y
The ACM method provides an important new approach for measuring exposure to chromosome-breaking agents and assessing genetic predisposition to such damage. As shown in Table 1, analyses of sperm from healthy men indicated that (1) the spontaneous frequencies of chromosomal structural abnormalities are higher that those of numerical aberrations; (2) chromosomal breaks are more prevalent than duplications and deletions; duplications and deletions of 1q36.3 are significantly higher (5-fold) than duplication and deletion of 1cen; and (3) within each chromosomal region, duplications and deletions tend to occur at the same rate (19). The ACM assay has been recently used to show that oligozoospermic men have higher frequencies of sperm with chromosomal structural aberrations than normozoospermic sperm (23) and that there is a gradual increase in the frequencies of sperm with chromosomal structural
Detection of Chromosomal Aberrations by FISH
245
Table 1 Chromosomally abnormal sperm detected by the human ACM assay FISH phenotypea
Baseline frequenciesb
Segmental aneuploidies 1pter duplication 1pter deletion 1cen-1q12 duplication 1cen-1q12 deletion
ACMM ACO ACACM OOM
1.0 ± 0.3 0.5 ± 0.2 2.2 ± 0.4 1.6 ± 0.3
Chromosomal breaks Breaks between 1cen and 1q12 Breaks within 1q12
A.CM AC.CM
5.4 ± 0.7 5.5 ± 0.9
Sperm chromosomal defects
Total structural aberrations Numerical abnormalities Disomy 1 or Diploidy Nullisomy 1
16.2 ± 1.3 ACACMM OOO
12.9 ± 2.1 0.3 ± 0.2
a Each chromosomal region is represented by a letter code: “A” indicates the red signal representative of the alpha satellite; “C” indicates the blue signal representative of the classical satellite; “M” indicates the green signal representative of the Midi probe; “O” indictates the absence of the signal for a chromosomal region; “A.C” indicates a break between the alpha and classical regions; “C.C” indicates a break within the classical region. b Frequencies per 10,000 sperm ± standard deviation. Data from Sloter et al 2006.
aberrations as men age (24). The following sections describe the materials, reagents and protocols for performing the ACM assay. 2.1 Materi als an d Rea ge nts 2.1.1 Preparation of Semen Smears
1. 3-9 µL of fresh or frozen semen (See Note 1) 2. Glass slides with frosted end. 3. 100% ethanol–200 proof. 2.1.2 Decondensation of Sperm
1. 40 mL of dithiothreitol (DTT, Sigma, St. Louis, MO) solution in coplin jar placed in ice. 2. 40 mL of lithium 3,5-diiodosalicylate (LIS, Sigma) in coplin jar at room temperature. 3. Tris (hydroxymethyl) aminomethane hydrochloride (Tris–HCl, Sigma); adjusted to pH 7.8. 4. Autoclaved distilled water (dH2 O). 5. Circulating water bath set to 77-78ºC.
246
Marchetti et al.
6. 70 % formamide/2XSSC: 315 mL formamide (Shelton Scientific, Peosta, IA), 45 mL 20XSSC (87.65 g NaCl, 44.1 g Na citrate, 400 ml dH2 O, pH to 7.0 with HCl or NaOH, adjust volume to 500 ml with dH2 O), 60 mL autoclaved dH2O, then adjusted to pH 7.0 with 2N HCl and to volume 450 mL with extra autoclaved dH2 O. 7. 70%, 85%, 100% ethanol in coupling jars. 2.1.3 Random Priming of Probes
1. Template DNA: Human 1cen unlabeled pSDZ1-1; human 1 classical satellite pUC1.77; 1midi D1Z2. 2. 2.5X Random Primers (Gibco, Bethesda, MD). 3. 10X buffer (10µL Tris-HCl pH 7.5, 5µL Na2 EDTA (stop buffer), 485 µL sterilized H2O.) 4. Bioprime labeling kit with Klenow, Sterilized H2O, dNTP mix (Invitrogen). 2.1.4 Probe Mixture Preparation
1. Master mix (5.5. ml formamide, 0.5 ml 20XSSC, 1 dextrane sulfate, heat at 72ºC until completely dissolved, pH to 7.0 and adjust volume to 7 ml with dH2 O. Aliquot in 1.5 ml eppendorf vials and store at -20ºC). 2. Herring sperm (Gibco–Invitrogen). 3. Labeled probes generated from random priming reactions. 2.1.5 Hybridization
1. 2. 3. 4. 5.
Slide Warmer set to 37º- 42ºC. Glass coverslips 22x22 mm, No.2 (Corning). Rubber cement (Starkey, La Grange, IL) Pre-warmed humidity chamber. Incubator with temperature set to 37ºC.
2.1.6 Posthybridization Washes
1. Circulating water bath set to 77-78oC. 2. 60% formamide/2XSSC: 30 mL formamide, 5 mL 20XSSC, 10 mL autoclaved dH20, then adjust pH to 7.0 with 2N HCL and adjust volume to 50 mL with dH20. 3. 2XSSC: Dilute 100 mL of 20XSSC with 800 mL of autoclaved dH2 O. Adjust pH to 7.0 with 2N HCl. Add more water until volume reaches 1000mL. Filter sterilize. Store at RT. 2.1.7 Antibody Staining (per slide)
1. 40µL of PNM: add 5g of non fat dry milk to approximately 100 mL of PN buffer and add 20 µL of 0.02% sodium azide (Sigma). Incubate at 37ºC for 60 minutes. Leave out on lab bench overnight. Remove supernatant in two 50 mL centrifuge tubes. Aliquot into 1.5 mL eppendorf tubes. Store at 4ºC.
Detection of Chromosomal Aberrations by FISH
247
2. 1 µL Pacific Blue-streptavidin (stock concentration 2.5 µg/mL; Molecular Probes, Inc., Eugene, OR). 3. 0.5 µL antidig-FITC (stock concentration 0.2 mg/mL; Boehringer Mannheim, Indianapolis, IN). 2.1.8 Counterstaining
1. Vectashield (Vector, Burlingame, CA). 2. Coverslips 22x22 mm, No.1 (Goldseal). 2.2 L ab or ator y M etho ds fo r th e Hu ma n AC M Ass ay 2.2.1 Semen Smear Slide Preparation
1. Soak slides in 100% ethanol for at least two days. Layer the slides in a jar or a container with a lid in a criss-cross fashion to expose as much of the slide as possible to the alcohol. Fill the jar with ethanol until all slides are covered. When removing the slides, wear appropriate personal protective equipment (PPE), wipe each slide vigorously with a kimwipe and place them in a slide box. 2. Using a diamond stylus, cut a piece from another clean slide in which the width is slightly less than the slide’s width (using another slide for measuring); after marking the surface, break the slide by bending inwards allowing the piece to break off carefully. Be careful not to touch the edge that will be in contact with the sample. As an alternative, a coverslip may be used instead, however, they can break more easily during smearing. Wear appropriate PPE. 3. Apply 7 µL of semen sample onto a clean glass slide using a pipette. This volume may vary (i.e. 3-9 µL) depending on the sample’s sperm concentration (see Note 2 for low sperm count donors). 4. Smear sample using cut piece previously made. Holding the frosted end in one hand so that the slide is slightly inclined and the other end resting on the workbench, place the cut slide piece (or coverslip) directly on the sample drop; the clean untouched factory edge only should be in contact with the slide at this point. Slowly move the edge of the cut piece/coverslip so it comes in contact with the sample; the sample will automatically distribute along the length of the edge. After the sample is distributed along the edge, slide the edge toward the frosted end allowing the sample to smear about 2.5 to 4 cm. 5. Lay the smeared slide flat on a clean paper towel. When the sample dries, store the smeared slides into a slide box with the cover slightly off to allow air-drying for at least 24 hours. It is highly recommended to leave slides out for several days. (See Note 3). 2.2.2 ACM Probe Preparation
This process uses random priming to generate labeled probes for hybridization. The random octamers are annealed to denatured DNA template
248
Marchetti et al.
and extended by Klenow fragments. During the process, fluorescently labeled11-dUTP is incorporated during a 10 to 40 fold amplification to produce probes for use in FISH (See Note 4). 2.2.2.1. ALPHA-RHODAMINE
1. Prepare Rhodamine dNTP mix (For five reactions, prepare the following: 2 µL of 25 mM dCTP, 2 µL of 25 mM dGTP, 2 µL of 25 mM dATP, 1.4 µL of 25 mM dTTP, 15 µL of 1 mM Rhodamine-6-dUTP). 2. Mix 20 µL of random primer, 0.2 µL of template DNA (pSDZ1-1 1 cen Rhodamine) and 23.8 µL of sterilized water in a PCR tube. 3. Program thermal cycler to denature for 10 minutes at 99.9ºC, remove vial and place immediately in ice for 5 minutes. 4. Add 5 µL of 10X buffer, 5 µL of dNTP mix, and 1 µL of Klenow (see Note 5) from Bioprime Kit to denatured template. Total volume 55 µL. 5. Gently mix and centrifuge for 30 seconds. 6. Program thermal cycler to incubate at 37ºC for 3 hours, 70ºC for 10 minutes, and hold at 4ºC. 7. Transfer probe into a 1.5 mL eppendorf tube, label, and store in –20ºC freezer. 2.2.2.2. CLASSICAL-BIOTIN
1. Mix 20 µL of random primer, 0.3 µL of template DNA (pUC1.77-classicalbiotin) and 23.7 µL of sterilized water in a PCR tube. 2. Program thermal cycler to denature for 10 minutes at 99.9ºC, remove vial and place immediately in ice for 5 minutes. 3. Add 5 µL of 10X buffer, 5 µL of dNTP mix from the Bioprime Labeling Kit, and 1 µL of Klenow (see Note 5) from Bioprime Kit to denatured template. Total volume 55µL. 4. Gently mix and centrifuge for 30 seconds. 5. Program thermal cycler to incubate at 37ºC for 3 hours, 70ºC for 10 minutes, and hold it at 4ºC. 6. Transfer probe into a 1.5 mL eppendorf tube, label, and store in –20ºC freezer. 2.2.2.3. MIDI-DIGOXIGEN
1. Prepare Dig dNTP mix (For five reactions, prepare the following: 2 µL of 25 mM dCTP, 2 µL of 25 mM dGTP, 2 µL of 25 mM dATP, 1.4 µL of 25 mM dTTP, 15 µL of 1 mM Dig-11-dUTP). 2. Mix 20 µL of random primer, 0.1 µL of template DNA (D1Z2 mididigoxigenin) and 23.9 µL of sterilized water in a PCR tube. 3. Program thermal cycler to denature for 10 minutes at 99.9ºC, remove vial and place immediately in ice for 5 minutes. 4. Add 5 µL of 10X buffer, 5 µL of dNTP mix, and 1 µL of Klenow (See Note 5) from Bioprime Kit to denatured template. Total volume 55µL.
Detection of Chromosomal Aberrations by FISH
249
5. Gently mix and centrifuge for 30 seconds. 6. Program thermal cycler to incubate at 37ºC for 3 hours, 70ºC for 10 minutes, and hold it at 4ºC. 7. Transfer probe into a 1.5 mL eppendorf tube, label, and store in –20ºC. 2.2.3. Probe Mixture
1. Prepare probes using the following amounts per slide: 10.5 µL Master mix; 1.0 µL Herring sperm DNA; 1.5 µL D1Z5 A. rhodamine; 1.0 µL pUC1.77C. biotin; 1.0 µL D1Z2 M. digoxigenin. 2. Mix by gentle pipetting and spin briefly (2 seconds) using a tabletop centrifuge. 3. Keep probe mix in -20oC until ready for denaturation. 2.2.4 Sperm Nuclei and Probe Decondensation
1. Put slide smears in DTT (4 mL 1M Tris-HCl pH 7.8 + 36 mL dH2O + 0.0617 g DTT) on ice for 30 minutes. DTT should be prepared fresh every time. Do not denature more than 4 slides per Coplin jar. DTT disrupts disulphide bridges between protamine molecules. 2. Transfer slides to LIS (4 mL 1M Tris-HCl pH 7.8 + 36 mL dH2O + 0.0633 g LIS) at room temperature for 75-90 minutes. LIS penetrates sperm membranes and swells nuclei. If slides sit in LIS for less than 75 minutes, it will produce dimmer signals. If slides sit for over 90 minutes, it will produce diffuse signals. 3. Dry slides upright up at RT on absorbent paper for 2-3 h. Over-drying (3+hrs) may allow spontaneous reformation of disulphide bonds and recondensation of sperm. 4. To prepare for hybridization, warm denaturation solution (70% formamide/2XSSC) in circulating water bath set to 77-78oC (20-30 minutes before use). 5. Denature slides for 2 minutes in 70% formamide/2XSSC at 77-78oC in circulating water bath (see Note 6). 6. Keep slides in ice-cold ethanol series of 70%, 85% and 100% for 2 minutes each (see Note 7). 7. Air dry slides upright on absorbent paper at room temperature for 30 minutes (see Note 8) 8. After drying, check sperm density under microscope using phase contrast and etch an area with a consistent sperm density to hybridize. Choose an area big enough for a coverslip. Continue hybridization only if you have enough cells. 9. Immerse coverslip in ethanol for a few seconds and clean dry with a kimwipe. 10. Set slide warmer to 37oC. 11. Retrieve probes from freezer, tap and centrifuge a few seconds using a bench top centrifuge (See Note 9). o 12. Denature probe mix for 6 minutes (it can be done for up to 10 minutes) at 77-78 C in circulating water bath and plunge immediately into ice for no more than 5 minutes. 2.2.5 Hybridization
1. Place slide on slide warmer and immediately drop denatured probe mix onto etched area and add cover slip. Avoid air bubbles (see Note 10). 2. Seal cover slip with rubber cement.
250
Marchetti et al.
3. Put slides in a pre-warmed humidity chamber. A plastic tip box with half an inch of water at the bottom works perfectly for this task (see Note 11). 4. Allow the slides to incubate at 37oC over two nights. 2.2.6 Posthybridization Washes and Detection (see Note 12).
1. Peel rubber cement off carefully with forceps. Do not allow coverslip to move around. 2. Place slide in a coplin jar containing 2XSSC at room temperature to allow coverslips to fall off (see Note 13). 3. Wash slides in two changes of fresh 2XSSC at RT for 3 min each. 4. Drain slides but do not allow them to completely dry 5. Add 1 µl of Pacific Blue-strepavidin to 40 µl of PNM. Mix well and transfer to slide. 6. Apply a plastic cover slip and incubate for 30 minutes in the dark at RT (see Note 14). 7. Drain excess liquid and wash two times in coplin jars containing 2XSSC at room temperature for 3 minutes each. 8. Warm circulating water bath and washing solution (60% formamide/2XSSC) to 45oC. 30 minutes is enough to time to allow solution to warm up to desired temperature (see Note 15). 9. Wash slides (no more than 2 at a time) in 60% formamide/2X SSC at 45oC for 4 min. 10. Wash slides two more times in coplin jars containing 2X SSC solution at RT for 5 minutes each. 11. Add 0.25 µL Pacific Blue-streptavidin and 0.5 µL antidig FITC to 100 µL PNM. Mix well and aliquot 40 µL of mixture to each slide. 12. Apply a plastic cover slip and incubate using the humidity chamber in the dark 30 minutes at RT. 13. Drain excess liquid and wash again two times in the same coplin jars containing 2XSSC solution for 3 minutes each. 2.2.7 Counterstaining
1. Drain the slides well but do not allow to completely dry. Apply 10 µL of Vectashield anti-fade on etched area and place a No. 1 thickness 22x 22mm coverslip on the slide. 2. Keep at 4 oC until ready for analysis (see Subheading 4). 3. T he M ous e Sp erm C T8 As say
The mouse CT8 assay is the first robust rodent screen for potential male germ cell aneugens and clastogens and it has been used to show that (20): (1) the baseline frequencies of sperm carrying structural aberrations involving chromosome 2 are more common than sperm aneuploidy for chromosomes 2 and 8 combined; (2) diploid sperm were the most common anomaly found in mouse sperm;
Detection of Chromosomal Aberrations by FISH
251
Table 2 Chromosomally Abnormal Sperm Detected by the Mouse CT8 Assay FISH phenotypea
Baseline frequenciesb
Segmental aneuploidies 2pter duplication 2pter deletion 2cen duplication 2cen deletion
CTT8 CO8 CCT8 OT8
0.1 ± 0.3 0.1 ± 0.3 0.1 ± 0.3 0.3 ± 0.5
Numerical abnormalities Disomy 2 Nullisomy 2 Disomy 8 Nullisomy 8 Diploidy
CCTT8 OO8 CT88 CTO CCTT88
0.3 ± 0.7 0.1 ± 0.3 0.2 ± 0.4 0.6 ± 0.8 2.4 ± 1.8
Sperm chromosomal defects
a Each chromosomal region is represented by a letter code: “C” indicates the red signal representative of the 2cen region; “T” indicates the green signal representative of the 2tel region; “8” indicates the yellow signal representative of the 8 probe; “O” indictates the absence of the signal for a chromosomal region. b Frequencies per 5,000 sperm ± standard deviation (data from Marchetti et al. 2006).
and (3) sperm with duplications or deletions of the centromeric and telomeric region of chromosome 2 occurred at similar frequencies. Comparison of the spontaneous frequencies of sperm with chromosomal structural aberrations between humans and mice showed that healthy human males appear to produce ~6 times higher frequencies of sperm with chromosomal aberrations than mice (2). Recently, the CT8 assay was used to show that exposure of male mice to chemotherapeutic relevant doses of etoposide resulted in major increases in the frequencies of sperm carrying chromosomal aberrations in both meiotic pachytene (27- to 578-fold) and spermatogonial stem-cells (8- to 16-fold), while aneuploid sperm were induced only after treatment of meiotic cells (27-fold) with no persistent effects in stem cells (25). The following sections describe the materials, reagents and protocols for performing the CT8 assay. 3.1 Materi als an d Rea ge nts 3.1.1 Epididymal Sperm Smear Preparations
1. 2. 3. 4.
2.2% sodium citrate (isotonic solution). 1.5 mL microcentrifuge tubes. Incubator ethanol-cleaned glass microscope slides.
252
Marchetti et al.
3.1.2 Decondensation of mouse sperm
1. 2. 3. 4. 5.
40 mL of DTT (Sigma, St. Louis, MO) solution in coplin jar placed in ice. 40 mL of Tris–HCl (Sigma); pH to 7.8. autoclaved dH2 O. Circulating water bath set to 77-78ºC. 70 % formamide/2XSSC: 315 mL formamide (Shelton Scientific, Peosta, IA), 45 mL 20XSSC, 60 mL autoclaved dH2 O, then adjust pH to 7.0 with 2N HCl and adjust volume to 450 mL with extra autoclaved dH2 O. 6. 70%, 85%, 100% ethanol in coupling jars. 3.1.3 Random Priming of Probes
1. Template DNA: mouse chromosome 2 centromere probe (Research Genetics, 460-H-4), mouse chromosome 2 telomere probe (Research Genetics, 121-E-1), clones 4a nd 5e form mouse chromosome 8 (26). 2 2.5X Random Primers (Gibco, Bethesda, MD). 3. 10X buffer. 4 Bioprime Labeling Kit with Klenow, Sterilized H2O, dNTP mix (Invitrogen). 3.1.4 Probe Mixture Preparation
The following quantities are for preparing probes necessary to hybridize 4 slides. These probe quantities may need to be adjusted depending on the quality of each batch of probe (see Subheading 3.2.3 for probe generation). 1. 30 µL mouse Cot-1 DNA (Life Technologies). 2. 4 µL mouse 2cent-dig. 3. 2 µL mouse 2tel-bio. 4. 1 µL mouse 8-bio (clone 4a). 5. 1 µL mouse 8-bio (clone 5e). 6. 0.5 µL mouse 8-dig (clone 4a). 7. 0.5 µL mouse 8-dig (clone 5e). 8. 2 µL Herring sperm DNA (Life Technologies). 9. 4.1 µL 3M Na acetate. 10. 112.75 µL Ice cold 200 proof ethanol. 3.1.5 Hybridization
Same as Subheading 2.1.5. 3.1.6 Posthybridization Washes and Antibody Staining
1. Circulating water bath set to 45 oC. 2. 50% formamide/2XSSC: 25 mL formamide (Shelton Scientific), 5 mL 20XSSC, 10 mL autoclaved dH20, then adjust pH to 7.0 with 2N HCL and adjust volume to 50 mL with dH20.
Detection of Chromosomal Aberrations by FISH
253
3. 2XSSC: Dilute 10 mL of 20XSSC with 800 mL of autoclaved dH2 O. Adjust the pH to 7.0 with 2N HCl. Add more water until volume reaches 1000 mL. Filter sterilize. Store at room temperature. 4. PN buffer (100 mL). 5. dual detection reagent (1 µL Fluorescein Avidin DCS; 1 µL Antidigoxigenin-rhodamine, 498 µL PN, store at 4˚ C.). 3.1.7 Counterstaining
Same as Subheading 2.1.8. 3.2 La bor ator y M eth ods for the M ous e CT 8 A ssay 3.2.1 Epididymis Sperm Smear Preparation
1. Set incubator to 32°C. 2. Fill 1.5 mL microcentrifuge tube with 300 µL of 2.2% sodium citrate, and prewarm to 32°C. 3. Euthanize mice with CO2 following the guidelines for the care and use of laboratory animals for research. Isolate the cauda epididymides from both testes. Hold each cauda with tweezers and cut small slits into the cauda using iris scissors. Be careful to keep the cauda as one piece. 4. Place both cauda in the microcentrifuge tube with 300 µL of 2.2% sodium citrate. 5. Incubate at 32°C for 10 minutes to allow sperm to swim out of the cauda. 6. Remove the cauda. The sperm suspension can be used immediately for making smears or stored at -20°C. Pipette 5 µL of the sperm suspension onto a clean glass slide. Gently smear the sperm suspension over an approximately 22x22 mm2 area of the glass slide using the side of a pipette tip. Alternately, a glass slide may be used to make a smear as long as an adequate cell density is attained (see Subheading 2.2.1). Allow the smears to air dry at RT for at least 24 h and store the slides at -20°C in nitrogen gas. 3.2.2 Decondensation of Mouse Sperm
1. Make 1M Tris-HCl stock solution: 157.6 g Tris-HCl and dissolve in ~800 mL of dH2 O, pH to 7.8 by adding NaOH. Bring up to total volume of 1 liter. Autoclave before use. 2. Make 10 mM DTT (made fresh for each use): a. Make 0.1 M Tris-HCl: Measure 36 mL of dH2O, pour into a Coplin jar placed in ice. Add 4 mL of 1M Tris-HCl Stock (from Step 1). Mix well. b. Make 10 mM DTT: 0.0617 g of DTT from Sigma and mix with 0.1M TrisHCl solution in the Coplin jar by stirring with spatula until the powder completely dissolves. Place Coplin jar on ice. 3. Place the glass slides into the Coplin jar containing ice cold 10 mM DTT (Step 2) for 30 min.
254
Marchetti et al.
4. Remove slides from Coplin jar and drain. Briefly dip slide in dH2O at room temperature and drain. Dry slide at room temperature for at least 30 minutes. Slides are ready for hybridization when thoroughly dried. 3.2.3 Ran do m Pri mi ng of p rob es 3.2.3.1. RANDOM PRIMING WITH DIGOXIGENIN-MODIFIED NUCLEOTIDES
1. Mix 25 to 500 ng of DNA template with dilute buffer or water to make a final volume of 19 µL in a microcentrifuge tube. Add 20 µL of the 2.5X random primer solution, mix well and denature for 5-10 minutes at 100°C. Immediately cool on ice. 2. Add 5 µL of reaction buffer, 5µL of Dig/dNTP mix, mix well and briefly centrifuge. 3. Add 1 µL of Klenow Fragment. Mix gently but thoroughly and centrifuge for 30 s. 4. Incubate at 37°C for 3 hours. 5. Heat to 70°C to deactivate the enzyme (it is not necessary to add stop buffer). Store at -20°C until use. 3.2.3.2. RANDOM PRIMING WITH BIOTIN-MODIFIED NUCLEOTIDES
1. Mix 25 to 500 ng of DNA template with dilute buffer or water to make a final volume of 19 µl in a microcentrifuge tube. Add 20 µL of the 2.5X random primer solution, mix well and denature for 5 to 10 minutes at 100°C. Immediately cool on ice. 2. Add 5 µL of the kits 10X dNTP mix, mix well and briefly centrifuge. 3. Add 1 µL of Klenow Fragment. Mix gently but thoroughly and centrifuge for 30 s. 4. Incubate at 37°C for 3 hours. 5. Heat to 70°C to deactivate the enzyme (it is not necessary to add stop buffer). Store at -20°C until use. 3.2.4 PROBE MIXTURE
1. Prepare probe mixture with amounts of reagents as indicated in Subheading 3.1.4. These quantities (per slide to be hybridized) may need to be adjusted depending on the quality of each batch of probe. 2. Keep at -80°C for one hour to overnight. 3. Centrifuge for 30 min at 15,000 rpm, pour off supernatant and dry the pellet. 4. Reconstitute probe mix with 3 µL of water and 7 µL CEP hybridization buffer (per slide). 5. Denature probe mix 10 min at 78°C, and preanneal at 37°C for 30 min. 3.2.5 Slide Pretreatment and Denaturation (see Note 15)
1. Flood slides with 3:1 methanol:acetic acid and air dry. 2. Put slides in DTT on ice (4 mL 1M Tris-HCl pH7.8 + 36 mL dH2 O + 0.0617 g DTT) for 30 min. 3. Dip in dH2 O and dry completely at RT (minimum of 30 min.). 4. Denature smears in 70% formamide/2XSSC at 78°C for 6 min (see Note 6). 5. Dehydrate slides using a series of ice cold 70/85/100% ethanol (2 min each).
Detection of Chromosomal Aberrations by FISH
255
6. Dry completely at room temperature; check under microscope for sperm density and mark area to be hybridized. 3.2.6 Hybridization
1. 2. 3. 4.
Clean glass coverslips with 100% ethanol. Prewarm slides on a slide warmer set to 42°C for about 1 minute. Add 10 µL of the probe mixture and put a 22x22 mm2 glass coverslip. Leave slide on slide warmer for a few minutes and cover the edges with rubber cement. Make sure that all the edges are covered by rubber cement. Add more rubber cement if needed. 5. Incubate over 2 nights at 37°C in a moist pre-warmed box (see Note 11). 3.2.7 Washing and Detection
1. 2. 3. 4. 5. 6.
Carefully remove the rubber cement with forceps. Wash for 5 min in 50% formamide/2XSSC at 45°C. Repeat two additional times. Wash for 5 min in 2XSSC at 45°C. Wash for 5 min in PN at 45°C. Wash for 5 min in PN at room temperature. Drain the slide and without allowing it to dry, add 30 µL of dual detection reagent, cover with a plastic coverslip and keep at RT in a moist box for 40 minutes. 7. Final for 3 min in PN at room temperature (twice). 3.2.8 Counterstaining
1. Apply 10 µL DAPI (0.01 µg/mL) in Vectashield on marked area and apply coverslip. 2. Keep at 4°C until scoring (see section 4). 4. Microscope Data Collection Protocols For Sperm FISH Assays The previous sections have described the laboratory protocols for producing slides with good hybridization quality for both the ACM and CT8 assays. Hybridization quality, that is, high bright and compact FISH signals and low background, is probably the most important factor affecting the success of a sperm FISH study. However, equally important are the visualization of the FISH signals and protocols for data collection that were developed to reduce to a minimum the influence of technical factors on the experimental outcome (see Pacchierotti and Sgrana, this volume, for information about fluorescence microscopes and filter settings). In the next few subheadings we will focus on several technical factors that are critical to the reliability of the sperm FISH assay such as: (1) the development of strict scoring criteria to determine whether a sperm has an abnormal number of spots; (2) blinding of scorers and procedures
256
Marchetti et al.
for data collection; and (iii) harmonization of scoring criteria among different scorers (see Note 16). 4.1 Sc or ing Cri teri a fo r AC M an d C T8 Sp er m FISH Ass ays
The subjective evaluation of FISH signal is an issue that can result in great variability in scoring results among different laboratories and within laboratories. Our group has invested significant effort in developing strict scoring criteria that reduce scorer-to-scorer variability. Strict adherence to these scoring criteria is essential for generating reproducible data. The first step in the scoring criteria is to determine whether a sperm should be scored. In order to score a sperm, it must meet all of the following criteria (these criteria apply to both human and mouse sperm): 1.
2.
3.
4.
5.
The entire cell must be visible. Do not count a cell unless the total cell border can be seen. Do not count cells that are partially covered by other cells. Example: do not count cells that exist in large clumps where overlapping cells might obscure the fluorescence signals. The cell must appear intact. The contents of the cell should remain within the cell borders. Sometimes overly decondensed cells will spill their nuclear content or their fluorescence domains and are not acceptable for scoring. Example: do not count cells where the fluorescence domains are outside the main body of the sperm head. The cell should be in a well-hybridized area of the slide. Usually on hybridized slides, there are whole regions that hybridize efficiently, as well as areas that are less well hybridized. It may be necessary to pass over some areas if the hybridization is poor. The cell size should be no less than 5 microns and no greater than 15 µm. An eye-piece with a reticle can be used for this task. Non-decondensed cells do not hybridize reliably and to keep from biasing the data, cells less than 5 microns on the reticle are not included in the denominator. A tally of such cells is kept but their fluorescence domains are not scored. Cells that overly decondense give very diffuse hybridization signals and cannot be reliably scored. The cell should have no background. There may be some background signals on the slide. An area with high background makes it difficult to distinguish true signals from the background and should not be scored.
Only sperm that pass all these criteria can be scored for their FISH phenotype. Next, we will describe the decision tree for the ACM assay, followed by the decistion tree for the CT8 assay. 4.2. D eci sio n Tr ee f or th e AC M Assa y
Before analyzing the FISH signals the scorer should determine whether this cell qualify for scoring by using the phase contrast to evaluate the cell's outline
Detection of Chromosomal Aberrations by FISH
257
(intact or spilled), presence of one or multiple tails. Also, it should be established that it is a single cell rather than two overlapping cells. In order to be scored, the following criteria must be met. 1. 2. 3. 4. 5. 6.
the entire cell visible with no part hidden from view. the cell border appear intact. the cell have a tail or tail attachment site (see Note 17). all the hybridization signals are inside the cell the cell size no less than 5 or greater than 15 notches by the reticle. the cell in an area of the slide in which a majority of the cells have hybridized.
If the answer to any of these questions is no, this cell is not acceptable for scoring. If contents are spilled or the cell is too small or too large, this information should be tallied, but the hybridization signals are not scored. If the cell is acceptable for scoring, the next step in the decision tree is to determine the FISH phenotype. 4.2.1. Is There a Break in Between the Alpha (A) and Classical (C) Probes?
To be defined as a break between the A and C probes the following criteria must be met: 1. 2. 3. 4. 5.
the A and C signals must be at least one A signal domain width apart. both signals must be of normal size based on the hybridization signals seen for these probes over the same region of the slide. the signals must be entirely separate and not attached by any threads. the cell has a tail or a tail attachment site. there are no hybridization signals either in surrounding cells or within this cell that raise the question that this is an artifact.
If the answer to all these question is yes, the cell is scored as having a break between the A and C region, otherwise the cell is not scored. 4.2.2. Is There a Break Within the Classical (C) Probe?
To be defined as a break within the C probe, the following criteria must be met: 1. 2. 3. 4. 5. 6.
only one C signal is associated with the A signal; if both C signals are of the same size they must be separated by a width as large as the individual signals; if they are of unequal size, they must be separated by at least the width of the larger C domain. both signals must have approximately the same intensity. the signals must be entirely separate and not attached by any threads. the cell has a tail or a tail attachment site. there are no hybridization signals either in surrounding cells or within this cell that raise the question that this is an artifact.
258
Marchetti et al.
If the answer to all these questions is yes, the cell is scored as having a break within the C region, otherwise the cell is not scored. 4.2.3. Are There Duplications or Deletions of Any of the Signals?
To be defined as a duplication of the C region, the following criteria must be met: 1. 2. 3. 4. 5. 6. 7.
the two C signals within the cell must have approximately the same size. both signals must have approximately the same intensity. both signals should be approximately of normal size based on the hybridization signals seen for this probe over the same region of the slide. the signals must be at least a full domain’s width apart. the signals must be entirely separate and not attached by any threads. the cell has a tail or a tail attachment site. there are no hybridization signals either in surrounding cells or within this cell that raise the question that this is an artifact.
If the answer to all these questions is yes, the cell is scored as having a duplication of the C region, otherwise the cell is not scored. To be defined as a deletion of the C region the following criteria must be met: 1. 2. 3. 4.
the absence of the C signal is confirmed by using the single filter specific for this signal. there are no debris near or around cell. the cell is not damaged. the cell has a tail or a tail attachment site.
If the answer to all these questions is yes, the cell is scored as having a deletion of the C region, otherwise the cell is not scored. A similar process is used to determine whether there are duplications and deletions of the A and M signals. To be defined as a duplication of the AC probes, the following criteria must be met: 1. 2. 3. 4. 5. 6. 7.
the two signals of each probe must have approximately the same size. the two signals of each probe must have approximately the same intensity. the two signals of each probe must be approximately of normal size based on the hybridization signals seen for these probes over the same region of the slide. the signals must be at least a full domain’s width apart. the signals must be entirely separate and not attached by any threads. the cell has a tail or a tail attachment site. there are no hybridization signals either in surrounding cells or within this cell that raise the question that this is an artifact.
If the answer to all these questions is yes, the cell is scored as having a duplication of the A and C regions, otherwise the cell is not scored.
Detection of Chromosomal Aberrations by FISH
259
To be defined as a deletion of the AC regions, the following criteria must be met: i.
the absence of the A and C signals is confirmed by using triple, single, and DAPI filters. ii. there are no debris near or around cell. iii. the cell is not damaged. iv. the cell has a tail or a tail attachment site.
If the answer to all these questions is yes, the cell is scored as having a deletion of the AC regions, otherwise the cell is not scored. 4.2.4. Is This Cell a Diploid Sperm?
To be defined as a diploid sperm the following criteria must be met: 1. 2. 3. 4. 5. 6. 7. 8.
there are two A signals plus two C signals plus two M signal. the two signals of each probe must have approximately the same size. the two signals of each probe must have approximataly the same intensity. the two signals of each probe must have approximately of normal size based on the hybridization signals seen for this probe over the same region of the slide. the two signals of each probe must be at least a full domain’s width apart. the signals must be entirely separate and not attached by any threads. there are no hybridization signals either in surrounding cells or within this cell that raise the question that this is an artifact. the cell is really one cell and not two overlapped cells (this should be checked carefully by phase contrast).
If the answer to all these questions is yes, the cell is scored as being diploid, otherwise the cell is not scored. 4.2.5. Are There No Signals Within the Cell?
Occasionally sperm with no hybridization signals will be seen. In these cases, the absence of the signals should be confirmed using all filters. Additionally, under phase contrast it should be checked that the cell is within size requirements, that there is no debris overlapping sperm, and that there are no cells overlapping. After checking the above criteria, then this cell is scored has OOO (Table 1). 4.3 D ecis io n T r ee f or th e CT 8 a ss ay
Before analyzing the FISH signals the scorer should determine whether this cell qualify for scoring by using the phase contrast to evaluate the cell's outline (intact or spilled), hooked shape of the head, presence for one or multiple. Also, it should be determined that it is a single cell rather than two overlapping cells. In order to be scored, the following criteria must be met:
260 1. 2. 3. 4. 5.
Marchetti et al. the entire cell visible with not part hidden from view. the cell border appear intact. the cell have a hook. all the hybridization signals are inside the cell the cell in an area of the slide in which a majority of the cells have hybridized.
If the answer to any of these questions is no, this cell is not acceptable for scoring. If contents are spilled or the cell is too small or too large, this information should be tallied, but the hybridization signals are not scored. If the cell is acceptable for scoring, the next step in the decision tree is to determine the FISH phenotype. 4.3.1 Are There Duplications or Deletions of the Centromeric Region of Chromosome 2?
To be defined as a duplication of the C region, the following criteria must be met: 1. the two C signals within the cell must have approximately the same size. 2. both signals must have approximately the same intensity. 3. both signals should be approximately of normal size based on the hybridization 4. 5. 6. 7.
signals seen for this probe over the same region of the slide. the signals must be at least a full domain’s width apart. the signals must be entirely separate and not attached by any threads.\ the cell has a hooked shape. there are no hybridization signals either in surrounding cells or within this cell that raise the question that this is an artifact.
If the answer to all these questions is yes, the cell is scored as having a duplication of the C region, otherwise the cell is not scored. To be defined as a deletion of the C region the following criteria must be met: 1. the absence of the C signal is confirmed by using the single filter specific for this signal.
2. there are no debris near or around cell. 3. the cell is not damaged. 4. the cell have a hooked shape or a tail. If the answer to all these questions is yes, the cell is scored as having a deletion of the C region, otherwise the cell is not scored. 4.3.2 Are There Duplications or Deletions of the Telomeric Region of Chromosome 2?
To be defined as a duplication of the T region, the following criteria must be met: 1. 2.
the two T signals within the cell must have approximately the same size. both signals must have approximately the same intensity.
Detection of Chromosomal Aberrations by FISH 3. 4. 5. 6. 7.
261
both signals should be approximately of normal size based on the hybridization signals seen for this probe over the same region of the slide. the signals must be at least a full domain’s width apart. the signals must be entirely separate and not attached by any threads. the cell has a hooked shape. there are no hybridization signals either in surrounding cells or within this cell that raise the question that this is an artifact.
If the answer to all these questions is yes, the cell is scored as having a duplication of the T region, otherwise the cell is not scored. To be defined as a deletion of the T region the following criteria must be met: 1. 2. 3. 4.
the absence of the T signal is confirmed by using the single filter specific for this signal. there are no debris near or around cell. the cell is note damaged. the cell have a hooked shape or a tail.
If the answer to all these questions is yes, the cell is scored as having a deletion of the T region, otherwise the cell is not scored. 4.3.3 Is This Cell Aneuploid for Chromosome 2?
To be defined as being disomic for chromosome 2 the following criteria must be met: 1. 2. 3. 4. 5. 6. 7.
the two C and two T signals within the cell have approximately the same size. both signals of each probe have approximately the same intensity. both signals of each probe are approximately of normal size based on the hybridization signals seen for these probes over the same region of the slide. the two signals of each probe are at least a full domain’s width apart. the two signals of each probe are entirely separate and not attached by any threads. the cell has a hooked shape. there are no other hybridization signals either in surrounding cells or within this cell raise the question that this is that this is an artifact.
If the answer to all these questions is yes, the cell is scored as being disomic for chromosome 2, otherwise the cell is not scored. To be defined as being nullisomic for chromosome 2 the following criteria must be met: 1. 2. 3. 4.
the absence of the C and T signals are confirmed by using the single filter specific for each signal. there are no debris near or around cell. the cell is not damaged. the cell have a hooked shape or a tail.
262
Marchetti et al.
If the answer to all these questions is yes, the cell is scored as being nullisomic for chromosome 2, otherwise the cell is not scored. 4.3.4 Is This Cell Aneuploid for Chromosome 8?
To be defined as being disomic for chromosome 8 the following criteria must be met: 1. 2. 3. 4. 5. 6. 7.
the two 8 signals within the cell have approximately the same size. both signals have approximately the same intensity. both signals are approximately of normal size based on the hybridization signals seen for these probes over the same region of the slide. the two signals are at least a full domain’s width apart. the two signals are entirely separate and not attached by any threads. the cell has a hooked shape. there are no other hybridization signals either in surrounding cells or within this cell raise the question that this is that this is an artifact.
If the answer to all these questions is yes, the cell is scored as being disomic for chromosome 8, otherwise the cell is not scored. To be defined as being nullisomic for chromosome 8 the following criteria must be met: 1. 2. 3. 4.
the absence of the 8 signal is confirmed by using the single filter specific for each signal. there are no debris near or around cell. the cell is not damaged. Does the cell have a hooked shape or a tail?
If the answer to all these questions is yes, the cell is scored as being nullisomic for chromosome 8, otherwise the cell is not scored.
4.4. Is This Cell a Diploid Sperm?
To be defined as a diploid sperm the following criteria must be met: 1. 2. 3. 4. 5. 6. 7.
there are two C signals plus two T signals plus two 8 signals. the two signals of each probe must have approximately the same size. the two signals of each probe must have approximately the same intensity. the two signals of each probe must have approximately of normal size based on the hybridization signals seen for this probe over the same region of the slide. the two signals of each probe must be at least a full domain’s width apart. the signals must be entirely separate and not attached by any threads. there are no hybridization signals either in surrounding cells or within this cell that raise the question that this is an artifact.
Detection of Chromosomal Aberrations by FISH 8.
263
the cell is really one cell and not two overlapped cells (this should be checked carefully by phase contrast).
If the answer to all these questions is yes, the cell is scored as being diploid, otherwise the cell is not scored. 4.5.
Ar e Th er e No Si gna ls Wi thin th e C el l?
Occasionally sperm with no hybridization signals will be seen. In these cases, the absence of the signals should be confirmed using all filters. Additionally, under phase contrast it should be checked that the cell is within size requirements, there is no debris overlapping sperm, and that there are no cells overlapping. After checking the above criteria, then this cell is scored has OOO (Table 2). 4.6. Da ta C oll ecti on 4.6.1. Blinding of Scorers and Coding Procedures
Despite the implementation of strict scoring criteria as described in the previous section, the scoring of sperm FISH signals still remains a subjective analysis and therefore subject to scoring biases. Extreme care should be taken to completely blind the scorers to the origin of the samples being scored. Several procedures can be used to achieve this goal. First, it is very important that the scorer is not able to identify the origin of the slide based solely on sperm concentration. Chemical exposure may result in a significant reduction in the number of sperm in the semen. In these situations, a third person should take particular care that a section of the slide with the highest concentration of sperm is chosen for hybridization so that slides from control and exposed samples do not differ greatly in the sperm concentration. Second, the person coding the slides for scoring should assure that all experimental groups and controls are represented in the set of 5-6 slides given to the scorer. Any marking on the slide should be removed and an adhesive sticker with the code should be applied on the frosted part of the slides. Third, the method used for tallying the number of sperm scored should provide information to the scorer only of the number of sperm scored and not of how many sperm with abnormal FISH phenotypes have been found. We routinely score 10,000 sperm per sample (in two scoring sessions of 5,000 sperm each). The advantage of analyzing large numbers of sperm in a relatively short amount of time by sperm FISH confers a relatively high level of sensitivity and statistical power to these assays, so that small increases can be detected by analyzing sperm from a small number of donors per experimental group. As already mentioned, sets of 5-6 coded slides are given to the scorer (see
264
Marchetti et al.
Note 18). Once the scorer has finished analyzing 5,000 sperm on each of the coded slides, these are returned to the coder, who removes the sticker, and applies a new sticker with a second code. Once the slides are recoded, they are given back to the scorer who will score a second set of 5,000 sperm. The scoring of the first set of 5,000 sperm is routinely started on the left side of the coverslip, and the second set of 5,000 starting from the right side of the coverslip. To make sure that two independent sections of the slide are scored, a mark with a permanent marker is made on the side of the slide to indicate where the scoring was halted. Additionally, coordinates of the location where scoring was halted can be recorded. If during the scoring of the second set of 5,000 sperm the scorer comes too close to the mark, the scoring should be stopped and another slide from the same donor/animal should be used to complete the second set of 5,000 sperm. 4.6.2. Computer Software Cytoscore© for Data Collection
Collection of data is done using the Cytoscore© program that was developed at Lawrence Livermore National Laboratory to keep track of the number of sperm scored and their FISH phenotype. The CytoScore© program allows the user to input, in addition to the FISH phenotype, other information, such as size and shape of sperm head, whether a second opinion was provided and any additional information that the scorer may feel is necessary (Figure 3). For each set of data, three files are created by the CytoScore© software: (1) Total count, which shows the total data scored. At the beginning of the file, information about the date the data was collected, the scorer, microscope used, project and additional microscope settings are reported. Following is the number of sperm analyzed and the number and types of abnormal cells; (2) Split summary, which report the same information contained in Total count, however, here the data is reported for each set of 500 sperm. Reporting the data in this way may provide information of the quality of the hybridization. In case of homogenous
Fig. 2. Examples of Cytoscore© screenshots: A) Cytoscore© set-up editor showing the menu listing and features that are stored for each sperm that is scored. B) Cytscore© scoring data window showing the active keys that were selected during the set up of the CytoScore© generator (left column), the total number of sperm scored (center column) and the last 16 sperm that were scored with the most recent at the top (right column). Pressing the 4 key adds a CT8 sperm to the total count. Note that the number of anomalies found is not listed. C) Cytoscore© anomaly page. Every time the zero key is pressed, this window pops-up and requires the scorer to provide information about the anomaly. In the example presented, we have a CCT8 sperm that was classified as possible because the 2 CC signals differ in size.
Detection of Chromosomal Aberrations by FISH
A
B
C
265
266
Marchetti et al.
hybridization, the abnormal cells should be divided evenly among the various splits. If this is not the case, it indicates that there may be regions of the slide that are better (or worse) than others. (3) Anomaly data, which reports all cells that were called abnormal together with the location of the cell on the slide, plus a set of additional information including comments inserted by the scorer or the person giving a second opinion. The files generated by the CytoScore© software can be exported into Excel spreadsheets for statistical analyses. The first step in this process is to decode the samples and compare the two sets of 5,000 sperm form the same slide using a Chi-square test. If the comparison is good the data becomes part of the study, if the comparison is not good, i.e. there are major variations between the two sets, the data is discarded and the slide must be rescored. 4.7. Sco ring H ar mo niza ti on Betw een Sco r er s, Exp eri m en ts a nd Coll abo ra ti ng Lab or atori es
The goal of scoring harmonization is to establish standard scoring criteria among scorers, studies and laboratories in order to maximize consistency of analyses and minimize technical variation. The approach of the harmonization process is to: 1) help the new scorer create visualization images on the situations described in the scoring criteria (see Subheadings 4.2 and 4.3); and, 2) conduct a scoring harmonization trial with samples with established frequencies of abnormal sperm. 4.7.1 Scoring Criteria Training
The objectives of this training are to familiarize the new scorer with all components of the scoring criteria prior to observing slides; emphasizing the requirement to consistently use multiple filters, including phase contrast, and working side by side with an experienced scorer who presents to the new scorer with examples of sperm FISH phenotypes especially those cells that may introduce judgment difficulties to the trainee, such as background noise, split signals, clusters of spots that remain connected by signal filaments and cells with signals on the outside of the cell. Key aspects for the trainee to learn are to: 1. 2.
recognize the difference between hybridization artifacts and abnormal cells. learn to recognize fields that are inappropriate for scoring because of: a. unhybridized cells or uneven hybridization. b. excessive clustering and overlapping of cells. c. debris obscuring cells to be scored.
3.
keep track of areas that have already been scored in order to prevent duplication by documenting the starting and stopping coordinates.
Detection of Chromosomal Aberrations by FISH
267
Active discussion among scorers is also a key aspect of the scoring training. When an atypical cell is observed, both scorers examine the sperm identified as having an abnormal phenotype and discuss any reason for suspecting an abnormality with respect to the established scoring criteria. It is beneficial to shown examples of cells that are definitely normal versus normal cells that have various artifacts interfering with the detection of the hybridization signals, including: background noise; spilled cells and split signals. Finally, comparing slides and observing cells described by the other scorers helps to create visual images of the situations that are listed in the scoring criteria. 4.7.2 Scoring Harmonization Plan
The objective of the scoring harmonization exercise is to test the new scorer’s ability to score sperm FISH samples using an established scoring criteria and replicate findings obtained by more experienced scorers. This is generally accomplished in three phases. During phase 1, the new scorer and at least a veteran score will score 10,000 cells on two reference samples. Scoring is conducted side by side, which each scorer showing to each other every abnormal cell encountered. Discussion of the reasons why each abnormal cell is classified as such is an important aspect of this training and should continue until a consensus is reached. After reaching 5,000 sperm, the scorers will exchange slides and score 5,000 cells in the same area that was already scored, with continued discussion of every abnormal cell encountered. Once the second set of 5,000 sperm is analyzed, comparison between the two sets of 10,000 sperm from each scorer are made using chisquare analyses. If there are no statistically significant differences, the scorers proceed to phase two; if statistically significant differences are found, the scorers review the scoring criteria and repeat phase 1. Phase two will be conducted as phase one, except for the fact that this time each scorer will show each other only those cells that they feel are questionable. At the end of the scoring, comparisons will be made between the results of the new scorer and the veteran scorer. If there are no significant differences, the scorers will proceed to phase three. If there are significant differences the scorers will revert back to the side-by-side scoring exercise outlined in phase 1 using a new slide. In the last phase of the scoring harmonization plan, both scorers will score a common set of four coded slides. After scoring a set of 5000 sperm on each slide, the slides will be recoded and an additional 5000 cells will be scored. Finally, comparisons will be made between the first and second set of 5000 sperm scored for each slide by each scorer. Comparisons will also be made between the trainee’s data and data previously collected. If there are significant differences the scorers will revert to phase 2. If there are no
268
Marchetti et al.
significant differences, the scoring harmonization exercise was successful and the trainee will have generated data that is in line with historic data generated from those samples by experienced scorers and is ready to generate data from new samples. 5. Note s 1.
2.
3.
4.
Properly stored samples can be used for FISH for several years after collections. We have obtained good hybridization results from samples that had been stored at 80ºC for more than 15 years. Fresh samples should be frozen as soon as possible to prevent sperm from settling at the bottom of the vial. For low-density sperm count donors, a pipette tip can be used to make a spiral smear. The ideal volume is 8-10 µL depending upon density observed under microscope after smear is made. Pipette the appropriate volume, then place the pipette at the center of the glass slide. From there, the pipette tip is moved in a circular motion while pipetting a small volume. After smear has been made, the smear will appear as a spiral similar to a snail’s shell. It is recommended to allow the smears to air-dry for at least 48 hours before hybridizing or storing them in the freezer. If low sperm density is still a problem, the semen sample aliquot can be left in the refrigerator for a day or two to allow sperm to settle to the bottom before making smears. If the slides are not immediately hybridized, place the slide box in a plastic bag and then fill bag with nitrogen air. As much as possible of the oxygenated air should be removed. Seal the bag and place it in a freezer at -20˚C. In preparation for hybridization, let the bag at room temperature before for about 30 minutes before opening it and removing the slides. Whenever a new probe is labeled it should be checked for efficiency and overall quality. A poor probe may be difficult to detect during a study, and it may not be noticed until several slides have been scored. a. Use a control slide to test the probe. Hybridize the probe alone or with other good probes. Some probes may behave differently when combined with others. b. Score at least 500 cells on the slide looking only at the new probe, and only in regions that are well hybridized. The probe should be present in greater than 99% of the cells. c. Note the quality of the probe. It should be bright with minimal signal splitting and very little or no noise.
5. 6.
If the probe is efficient, clean, bright and tight, then the probe may be used for FISH. Do not take Klenow out of freezer until ready to use. Once you have used the Klenow, return it immediately to the freezer. Denature no more than 2 slides at a time in the 70% formamide/2XSSC solution. Each slide will drop the temperature of the solution about 1-1.5oC.
Detection of Chromosomal Aberrations by FISH 7. 8. 9. 10.
11.
12.
13.
14. 15.
16.
17.
18.
269
Prepare fresh every time. Keep at -4 oC for at least 30 min before using. On a humid day, 1 hour of drying time provides better results. This step can be done while slides are drying. This should be done under yellow light or partial darkness because these stains are sensitive to white light. Also, prewarming coverslips on the warm plate a few minutes before adding the denature probes helps maintaining the temperature at 37 o C during the first few minutes of hybridization. Keep an empty pipette tip box with half an inch of water at the bottom in the incubator all the time so that it will be ready to serve as a humidity chamber any time it is needed. Periodically add water to replace the evaporated one. The probe mixture for the ACM assay is a combination of directly-labeled (A) and indirectly-labeled probes (C and M), therefore detections steps are needed for the C and M probes. Amplification of the C signal is done in two steps with an intermediate washing step with formamide. This step is necessary to reduce nonspecific staining for this probe. If coverslips do not fall off in less than 5 minutes, then the coverslips were not sealed adequately or there was not enough water in the humidity chamber. Leave coverslip in 2XSSC until coverslips fall off even if it takes longer than 5 minutes. If signals are not bright enough, this step can be done for 45 minutes. Small numbers of sperm may be removed from the slide during the denaturation and washing process and remain in the solution. For this reason denaturing and washing solutions be changed on a weekly basis if heavily used. They should also be changed whenever hybridizing different treatment sets. Equally important is the use of a fluorescence microscope that is equipped with the proper filter sets to detect the light emitted by each fluorochrome. See Table II, Pacchierotti and Sgrana (this volume). This is especially critical when scoring human samples because of the occasional presence of somatic cell in the semen. The hooked shape of the mouse sperm is the main discriminant for identifying sperm from somatic cells. During the scoring of large number of samples, it is encouraged to periodically include one slide already scored in the set of coded slides given to the scorer. This will help to keep track of the consistency of the scoring criteria used.
Ackn owl ed gm ents
We wish to thank Eddie Sloter, Thomas Schmid, Xiu Lowe, Francesca Pearson and other past and present laboratory members who helped in the development and validation of the ACM and CT8 assays. This work was performed under the auspices of the U.S. DOE by the University of California, LLNL under contract W-7405-ENG-48 with funding support from NIEHS IAG Y01-ES-8016-5 and from Superfund P42ES04705 from the National Institute of Environmental Health Sciences.
270
Marchetti et al.
Refe ren ce s 1.
2.
3.
4. 5. 6. 7. 8. 9. 10.
11.
12.
13.
14.
15.
Wyrobek, A.J., Schmid, T.E., Marchetti, F. (2005) Relative susceptibilities of germ cells to genetic defects induced by cancer chemotherapies. J. Natl. Cancer Inst. Monogr. 34, 31-35. Wyrobek, A.J., Schmid, T.S., Marchetti, F. (2005) Cross-species sperm-FISH assays for chemical testing and assessing paternal risk for chromosomally abnormal pregnancies. Environ. Mol. Mutagen. 45, 271-283. Marchetti, F., Wyrobek, A.J. (2005) Mechanisms and consequences of paternallytransmitted chromosomal abnormalities. Birth Def. Res. C Embryo Today 75, 112129. Shelby, M.D. (1996) Selecting chemicals and assays for assessing mammalian germ cell mutagenicity. Mutat. Res. 325, 159-167. Witt, K.L., Bishop, J.B. (1996) Mutagenicity of anticancer drugs in mammalian germ cells. Mutat. Res. 355, 209-234. Hassold, T., Hunt, P. (2001) To err (meiotically) is human: the genesis of human aneuploidy. Nature Rev. Genet. 2, 280-291. Olshan, A.F., van Wijngaarden, E. (2003) Paternal occupation and childhood cancer. Adv. Exp. Med. Biol. 518, 147-161. Harkonen, K. (2005) Pesticides and the induction of aneuploidy in human sperm. Cytogenet. Genome Res. 111, 378-383. Crow, J.F. (2001) The origins, patterns and implication of human spontaneous mutations. Nature Rev. Genet. 1, 40-47. Robbins, W.A., Segraves, R., Pinkel, D., Wyrobekm A.J. (1993) Detection of aneuploid human sperm by fluorescence in situ hybridization: evidence for a donor difference in frequency of sperm disomic for chromosomes 1 and Y. Am. J. Hum. Genet. 52, 799-807. Wyrobek, A.J., Alhborn, T., Balhorn, R., Stanker, L., Pinkel, D. (1990) Fluorescence in situ hybridization to Y chromosomes in decondensed human sperm nuclei. Mol. Reprod. Dev. 27, 200-208. Wyrobek, A.J., Adler, I.D. (1996) Detection of aneuploidy in human and rodent sperm using FISH and applications of sperm assays of genetic damage in heritable risk evaluation. Mutat. Res. 352, 173-179. Frias, S., Van Hummelen, P., Meistrich, M.L., Lowe, X.R., Hagemeister, F.B., Shelby, M.D., Bishop, J.B., Wyrobek, A.J. (2003) NOVP chemotherapy for Hodgkin's disease transiently induces sperm aneuploidies associated with the major clinical aneuploidy syndromes involving chromosomes X, Y, 18, and 21. Cancer Res. 63, 44-51. Rubes, J., Lowe, X., Moore, D., Perreault, S., Slott, V., Everson, D., Selevan, S., Wyrobek, A.J. (1998) Smoking cigarettes is associated with increased sperm disomy in teenage men. Fertil. Steril. 70, 715-723. Robbins, W.A., Vine, M.F., Truong, K.Y., Everson, R.B. (1997) Use of fluorescence in situ hybridization (FISH) to assess effects of smoking, caffeine, and alcohol on aneuploidy load in sperm of healthy men. Environ. Mol. Mutagen. 30, 175-183.
Detection of Chromosomal Aberrations by FISH
271
16. Lowe, X., O'Hogan, S., Moore, D., Bishop, J., Wyrobek, A. (1996) Aneuploid epididymal sperm detected in chromosomally normal and Robertsonian translocation-bearing mice using a new three-chromosome FISH method. Chromosoma 105, 204-210. 17. Lowe, X., de Stoppelaar, J.M., Bishop, J., Cassel, M., Hoebee, B., Moore, D., Wyrobek, A.J. (1998) Epididymal sperm aneuploidies in three strains of rats detected by multicolor fluorescence in situ hybridization. Environ. Mol. Mutagen. 31, 125132. 18. Rubes, J., Vozdova, M., Kubickova, S. (1999) Aneuploidy in pig sperm: multicolor fluorescence in situ hybridization using probes for chromosomes 1, 10, and Y. Cytogenet. Cell Genet. 85, 200-204. 19. Sloter, E., Lowe, X., Moore, D., Nath, J., Wyrobek, A.J. (2000) Multicolor FISH analysis of chromosomal breaks, duplications, deletions, and numerical abnormalities in the sperm of healthy men. Am. J. Hum. Genet. 67, 862-872. 20. Hill, F.S., Marchetti, F., Liechty, M., Bishop, J., Hozier, J., Wyrobek, A.J. (2003) A new FISH assay to simultaneously detect structural and numerical chromosomal abnormalities in mouse sperm. Mol. Reprod. Dev. 66, 172-180. 21. Shelby, M.D., Bishop, J.B., Mason, J.M., Tindall, K.R. (1993) Fertility, reproduction, and genetic disease: studies on the mutagenic effects of environmental agents on mammalian germ cells. Environ. Health Persp. 100, 283-291. 22. Estop, A.M., Marquez, C., Munne, S., Navarro, J., Cieply, K., Van Kirk, V., Martorell, M.R., Benet, J., Templado, C. (1995) An analysis of human sperm chromosome breakpoints. Am. J. Hum. Genet. 56, 4524-60. 23. Schmid, T.E., Brinkworth, M.H., Hill, F., Sloter, E., Kamischke, A., Marchetti, F., Nieschlag, E., Wyrobek, A.J. (2004) Detection of structural and numerical chromosomal abnormalities by ACM-FISH analysis in sperm of oligozoospermic infertility patients. Hum. Reprod. 19, 1395-1400. 24. Sloter, E., Marchetti, F., Eskenazi, B., Weldon, R.H., Nath, J., Cabreros, D., Wyrobek, A.J. (2006) The frequencies of human sperm carrying chromosomal breaks and segmental duplications and deletions increases with advancing age. in press. 25. Marchetti, F., Pearson, F.S., Bishop, J.B., Wyrobek, A.J. (2006) Etoposide induces chromosomal abnormalities in mouse spermatocytes and stem cell spermatogonia. Hum. Reprod. 21, 888-895. 26. Boyle, A.L., Ward, D. (1992) Isolation and initial characterization of a large repeat sequence element specific to mouse chromosome 8. Genomics 12, 517-525.