DOI: 10.1007/s00267-003-0171-6
Land Evaluation for Maize Based on Fuzzy Set and Interpolation ADEMOLA K. BRAIMOH* PAUL L. G. VLEK Center for Development Research University of Bonn Walter Flex Str. 3 53113 Bonn, Germany ALFRED STEIN Mathematical and Statistical Methods Group University of Wageningen Wageningen, The Netherlands ABSTRACT / The objective of this article is to apply fuzzy set and interpolation techniques for land suitability evaluation for maize in Northern Ghana. Land suitability indices were computed at point observations using the Semantic Import (SI)
Land evaluation is carried out to estimate the suitability of land for a specific use such as arable farming or irrigated agriculture. Land evaluation can be carried out on the basis of biophysical parameters and/or socioeconomic conditions of an area (FAO 1976). Biophysical factors tend to remain stable, unlike socioeconomic factors that are affected by social, economic, and political settings (Dent and Young 1981; Triantafilis and others 2001). Thus, physical land suitability evaluation is a prerequisite for land-use planning and development (Sys 1985; Van Ranst and others 1996). It provides information on the constraints and opportunities for the use of the land and therefore guides decisions on optimal utilization of land resources (FAO 1983). The skillful planning of land resources has become a major issue for rural development in Africa. This concern results from increasing pressure on land resources as a result of population growth. Gradual change from small-scale subsistence farming to marketbased agricultural production has further contributed to increased pressure on land (Sankoh and others 2001). Until recently, conventional soil survey alone KEY WORDS: Fuzzy set; Fuzzy logic; Land suitability index; Block kriging; Maize; Ghana Published online March 23, 2004. *Author to whom correspondence should be addressed, email:
[email protected]
Environmental Management Vol. 33, No. 2, pp. 226 –238
model, whereas spatial interpolation was carried out by block kriging. Interpolated land suitability shows a high correlation (R2 ⫽ 0.87) with observed maize yield at the village level. This indicates that land suitability is closely related to maize yield in the study area. Membership functions were further used to assess the degree of limitation of land characteristics to maize. Sixty percent of the data has membership functions ranging from 0.23 for ECEC to 1.00 for drainage. ECEC, organic C, and clay are the major constraints to maize yield. The use of the fuzzy technique is helpful for land suitability evaluation, especially in applications in which subtle differences in soil quality are of a major interest. Furthermore, the use of kriging that exploits spatial variability of data is useful in producing continuous land suitability maps and in estimating uncertainties associated with predicted land suitability indices.
could provide the basic data needed for land-use planning and rural development. However, with increasing competition for land among various land uses owing to increase in population, there is a need for spatial information technology such as remote sensing to aid data collection and the use of geographical information systems (GISs) to efficiently handle natural resource data. Such technology is also needed to compute land suitability and model scenarios for land-use planning. Sankoh and others (2001) provide a recent review of spatial information technology for land suitability analysis, including the prospects of using the technology for community development in Africa. Several land evaluation approaches exist (Rossiter 1996). Van Lanen (1991), cited in Triantafilis and others (2001), identified three general types, namely the qualitative approach, the parametric approach, and process-based models (Table 1). Land evaluation procedures focus increasingly on the use of quantitative procedures to enhance the qualitative interpretation of land resource surveys. Crucial to the estimation of land suitability is the matching of land characteristics with the requirements of envisaged land utilization types. With the exception of modeling, most of these procedures are highly subjective. For instance, additive or multiplicative land indices involve classification of land characteristics into severity levels based on arbitrary cutoff points (Rossiter 1996). Although the need to make value judgment in land evaluation is inevitable ©
2004 Springer-Verlag New York, LLC
Fuzzy-Based Land Evaluation
227
Table 1. Three general approaches of land evaluation based on Van Lanen (1991), as cited in Triantafilis and others (2001) Approach
Description
Examples
Qualitative
Evaluation of physical suitability is based on expert judgment and described in qualitative terms such as not suitable, marginally suitable, and highly suitable.
Parametric
Land suitability is assessed on a continuous scale using multiplicative or additive models (indices) Land performance is assessed on the basis of models representing specific processes such as crop yield, erosion, or water movement
Land Capability, Classification (Klingebiel and Montgomerry 1961) and FAO Land Suitability, Evaluation (FAO 1976) Storie Index Rating (Storie 1933)
Process-based models
(Davidson and others 1994), it is important to utilize techniques that minimize human bias to improve the pragmatic value of land evaluation results. The objective of this study is to apply fuzzy set and interpolation techniques for land suitability evaluation and relate it to maize yield in Northern Ghana. Yields of maize have experienced a decline in the last few years in Ghana. This phenomenon calls for efforts to explain the downward trend and make recommendations for improvement. Yield information is of interest to users (farmers) and policy makers (government officials) who are responsible for rural development. Most often, climate is attributed as the major cause of declining maize productivity (e.g., CIMMYT 1988). However, with adequate rainfall, optimum yields cannot be attained without favorable soil conditions (Ogunkunle 1993). The study stresses the importance of good soil management in areas with suboptimal rainfall for crop production.
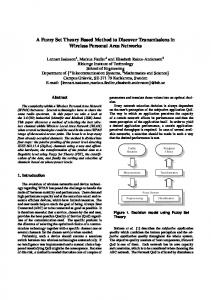
Methods The Study Area The study area of about 4800 km2 (Figure 1) is located in the Guinea savannah of the northern region of Ghana. It lies between latitudes 8° 50' and 10° N, and stretches between longitudes 0°30' to 1°30' W. Subsistence agriculture is the major means of livelihood in the area. Major crops grown include maize, sorghum, yam, rice, groundnut, soybeans, and vegetables. The rainfall pattern is unimodal, with an annual amount of about 1100 mm. The topography is generally slightly undulating, with mean slope of about 7% (Braimoh and Vlek 2004). The main geological formation is the Voltaian, which comprises sandstone with a characteristic layer of ironstone at shallow depths. Three broad groups of soil can be distinguished in the area: the reddish well-drained upland sandy loams on the Upper
World Food Studies; WOFOST (Boogaard and others 1998)
Voltaian sandstones, the yellowish imperfectly drained sandy loams on slopes close to the valley bottoms, and in situ alluvial soils of the valley floors. The soils are classified as Rhodic Paleustalf, Typic Plinthaqualf, and Typic Plinthaquept (Soil Survey Staff 1994). Data Sources Soil and land characteristics data were obtained from a study on factors affecting land-use change under the Sustainable Water Use Under Changing Land-Use in the Volta Basin (GLOWA) project at the Center for Development Research in Bonn. A total of 120 soil samples (data points) were collected along transects following the road network of the study area (Figure 1). Sampling intervals varied from about 0.5 to 1.5 km along a transect, depending on changes in land cover along transects. Six soil variables influencing maize yield were selected for each data point based on the opinion of experts at the Savannah Agricultural Research Institute (SARI), Tamale in Northern Ghana, and a preliminary study on land-use/land-cover change (Braimoh and Vlek 2004). Summary statistics of the dataset are presented in Table 2. Other relevant sitespecific data including household farm sizes and maize yields collected from a socioeconomic survey of the area were obtained from the database as well (Table 3). The farmers interviewed were selected following a multistage (cluster) sampling procedure. The survey covered 237 households in 20 villages. Computation of Land Suitability Indices In this study, we will focus on the use of fuzzy logic. Fuzzy logic (Zadeh 1965) is based on imprecise reasoning, leading to fuzzy sets and other fuzzy techniques. A fuzzy set may be used for classification of objects where classes do not have rigidly defined boundaries (Zadeh 1965). If Z represents a space of objects or phenomena, then the fuzzy set A is the set of ordered pairs
228
A. K. Braimoh and others
Figure 1. The study area.
Fuzzy-Based Land Evaluation
Table 2.
229
Descriptive statistics for land characteristics (N ⫽ 120)
Land characteristicsa
Minimum
Effective Cation Exchange Capacity (ECEC) (cmol/kg) Organic C (%) pH (1:2.5 CaCl2) Sand (%) Clay (%) Drainage
Maximum
Mean
CVb (%)
0.84
17.02
4.42
19
0.50 4.20 13.08 0.72 1
2.38 6.30 89.08 23.60 3
1.22 5.16 53.06 7.13 1.62
32 9 26 62 42
Drainage as an ordinal variable was coded as 1 ⫽ not limiting, 2 ⫽ moderately limiting, and 3 ⫽ limiting. CV ⫽ coefficient of variance.
a b
Table 3.
Average maize yield for villages (1999 –2001)
No.
Village
1 2 3 4 5 6 7 8 9 10 11 12 13 14 15 16 17 18 19 20
Kpenjiyili Attakura Jukuku Wuripe Kpegunayili Digma Sakpaluwa Voguyili Libga Jana Ziong Dabogushei Sanga Kotingli Yong Sabegu Saakuba Dalun Kpachi Cheyohi
A ⫽ 兵 z, A 共 z兲其, ᭙ z⑀Z,
Yield 1.07 (tha–1) 0.77 1.16 1.20 0.95 1.17 0.77 0.64 0.61 0.72 0.54 0.67 0.79 0.77 0.73 0.66 0.89 0.71 0.68 0.65
(1)
where A (Z) is the membership function of any z ⑀ Z to A. It indicates the degree of membership of z in A by taking values within the interval [0,1], with 0 representing nonmembership and 1 representing full membership of the set (Burrough and McDonnell 2000). Intermediate values (0 ⬍ A ⬍ 1) reflect the degree of closeness of an entity to the defined class. The Boolean logic, on the other hand, has two crisp possibilities of membership: none (A ⫽ 0) and full (A ⫽ 1). Examples of fuzzy logic application in land evaluation include Burrough and others (1992), Tang and Van Ranst (1992), Davidson and others (1994), and Groenemans and others (1997). Fuzzy logic is preferred to Boolean logic for land evaluation because fuzzy techniques lead to estimates
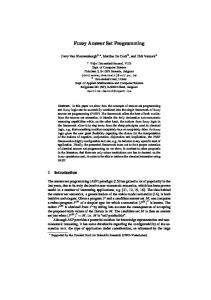
for land-use suitability on a continuous scale and can, therefore, be more informative than the Boolean (crisp) technique. Second, fuzzy techniques capture the continuous variation of soil properties, which is the raison d’etre of land suitability evaluation. Finally, land evaluation based on fuzzy sets helps to deal with vagueness or imprecision characterizing natural resource data (Burrough 1989). Land suitability evaluation using fuzzy set techniques consists of three steps: generation of membership values for the land characteristics, determination of weights for the membership values, and combination of weighted membership values to produce a joint membership value or land suitability index, I. Membership values were generated for six land characteristics considered to be important to agricultural land use in the study area using the Semantic Import (SI) model (Figure 2). The basic symmetric SI model is of the form A 共 z兲 ⫽
1 1 ⫹ ␣共 z ⫺ c兲 2
for 0 ⱕ z ⱕ ␣,
(2)
where A is the land characteristic set; a is the parameter that determines the shape of the function, c (also called the ideal point or standard index) is the value of the property z at the center of the set and ␣ is the maximum value that z can take. The lower crossover point (LCP) and the upper crossover point (UCP), corresponding to c1 and c2, respectively in Figure 2a represent situations where the value of the land characteristics is marginal for a specified purpose. At these points, A (z) ⫽ 0.5. The choice of crossover points specified for fuzzy membership computation could be based on data, expert knowledge, or conventionally imposed criteria (McBratney and Odeh 1997). If only the lower or upper limits of a class are of practical relevance to the envisaged land utilization type, asymmetric variants of the SI model are used. For instance, for land characteristic “organic C” in which higher values contribute positively to crop yield, a suitable model is
230
A. K. Braimoh and others
Figure 2. Different membership functions and parameters used to determine membership values of land characteristics (Burrough and McDonnell 2000).
Fuzzy-Based Land Evaluation
Table 4.
231
Ranking of land characteristics
Land characteristics
Rank
Justification
Organic C
6
ECEC
5
Drainage
4
pH
3
Clay
2
Sand
1
Soil organic matter is crucial to the supply of N and cations. Soil organic C shows significant correlations with N, P, K, Ca, Mg, clay, ECEC, base saturation, and pH (Braimoh and Vlek 2004). Analysis of variance also shows that organic C contents of cultivated and virgin lands are highly significant at P ⬍ 0.01 (Braimoh and Vlek 2004). Fugger (1999) also shows that low SOM mineralization was the main cause of low maize yield in an area around Tamale. Cation-exchange capacity determines the nutrient-holding capacity of the soil. It was rated next to organic C, as most of the ECEC are contributed by organic colloids (Fugger 1999). Drainage influences air and water regimes of the soil. Good drainage leads to deeper rooting of maize, whereas water logging may reduce the uptake of cations. Drainage problems are usually encountered in Northern Ghana due to excess water in the rainy season. Thus, drainage was rated higher than other physical land characteristics. Nutrient availability in the soils is strongly dependent on pH (Braimoh and Vlek 2004). For instance, an increase in pH through liming may lead to an increase in CEC. Although the optimum pH for maize is about 5.5, it is able to tolerate a wide range of pH between 4.5 and 8.0 (Sys 1985). Only about 11% (i.e., 13 out of 120 samples) of the soils have pH below 4.5, whereas the pH of the remaining 89% samples ranges from 4.5 to 6.3. Thus, pH cannot be taken as a major constraint to maize cultivation in the study area. Owing to the sandy nature of the soils, clay content plays a crucial role in nutrient supply. Clay is significantly correlated (P ⬍ 0.05) with organic C and N in the study area (Braimoh and Vlek 2004). This suggests that contents of organic C and N in the soils are clay dependent. Clay is also important in moisture retention for crop growth. Soils of the study area are coarse textured with sand content ⬎ 80%; water-holding capacity and soil organic matter are usually low (Overseas Development Institute 1999). Cultivation of such soils often leads to rapid soil degradation, as there is no sufficient organic matter to bind soil aggregates together.
A 共 z兲 ⫽
1 1 ⫹ 兵共 z ⫺ c ⫺ t 1 其 2
for 0 ⬍ z ⬍ c ⫹ t 1 ,
(3)
where t1 is the width of the transition zone (Figure 2b). The transition zone for an asymmetric model refers to the absolute difference between the value of the property at the ideal and crossover points. A similar model [Equation (4)] applies to a land characteristic for which lower values contribute positively to crop yield: A 共 z兲 ⫽
1 for 0 ⬍ z ⬍ c ⫺ t 2 1 ⫹ 兵共 z ⫺ c ⫹ t 2 兲/t 2 其 2
(4)
where t2 is the width of the transition zone (Figure 2c). An overall land suitability index (I) at each sampling point was computed using the convex combination rule, which is a linear weighted combination of membership values of each characteristic Ai:
冘 n
I⫽
i
A2
,
(5)
i⫽1
where wi are the weights of the memberships values Ai.
Equation (5) shows that the choice of weights i is crucial in the determination of the overall land suitability index. Davidson and others (1994) suggest that this choice should be based on data and knowledge of the relative importance of differentiating land characteristics to crop growth. In this study, simple ranking was used to rate land characteristics from 1 (least important) to 6 (most important). This ranking (Table 4) was based on the literature (e.g., Sys 1985, Fugger 1999), expert opinion and a preliminary study on the importance of the land characteristics to agricultural land-use in the study area (Braimoh and Vlek 2004). To ensure that weights sum up to unity, the rank ri of a land characteristics Ai was converted to weight i using the formula i ⫽
冘
r
i n i⫽1 i
r
(6)
Membership functions and weights for land characteristics used in the study are presented in Table 5. An asymmetric function I (Equation 3) was used for pH, as the pH values range from 4.2 to 6.3 in the study area
232
Table 5.
A. K. Braimoh and others
Land characteristics and membership function parameters Membership function parametersa
Land characteristics
Model type
LCP
c
UCP
a
t1
t2
Weight
pH (1:2.5 CaCl2) ECEC (cmol/kg) Organic carbon (%) Sand (%) Clay (%) Drainage
Asymmetric I [Equation (3)] Asymmetric I [Equation (3)] Asymmetric I [Equation (3)] Symmetric [Equation (2)] Symmetric [Equation (2)] Asymmetric II [Equation (4)]
4.5 2 0.8 20 15 —
5.5 16 1.5 40 25 1
— — — 60 35 3
— — — .0005 .01 —
1.0 14 0.7 — — —
— — — — — 2
0.14 0.23 0.29 0.05 0.10 0.19
a
Adapted from Sys (1985).
Table 6.
Summary statistics for membership values of land characteristics and land suitability index (N ⫽ 120)
Statistics Mean Standard deviation CV (%) Minimum Maximum
pH
ECEC
organic C
sand
clay
drainage
0.56 0.31 55 0.22 1
0.48 0.27 57 0.18 1
0.24 0.08 34 0.19 1
0.66 0.25 38 0.14 1
0.27 0.14 52 0.14 1
0.64 0.36 57 0.20 1
(Table 2). Thus, the LCP was the most important in defining the membership function. Similarly, organic C and ECEC were fitted to asymmetric function I model, as high amounts contribute positively to crop growth. The LCP was set at 0.8% and 2 cmol/kg, respectively. Asymmetric function II (Equation 4) was applied to drainage, with optimum drainage class set at 1. Thus, the UCP was the most crucial in fitting the membership function. The symmetric model (Equation 2) was applied to sand and clay, as the optimum texture for maize range from clay loam to loam (Sys 1985). Thus, both the UCP and LCP were crucial in fitting the membership functions. Spatial Interpolation and Validation Spatial interpolation of land suitability indices was carried out by kriging (Chile`s and Delfiner 1999). Ordinary point kriging provides the best linear unbiased predictor at point locations under the assumption that the mean of the quantity being predicted is constant, whereas ordinary block kriging provides average predictions of land suitability for areas of land. In kriging, the first step is to describe the spatial structure of the land suitability index using the variogram (Chile`s and Delfiner 1999). Second, parameter estimates of the variogram were used to predict land suitability. Land suitability indices were predicted for block sizes of 5 km ⫻ 5 km being the average size of agricultural area of the villages. For validation, linear regression was used to relate observed yield with I:
y ⫽ b 0 ⫹ b 1 x,
I 0.45 0.14 31 0.23 0.89
(7)
where y is average village yield, x is the interpolated I by block kriging, b0 is the intercept, and b1 is the slope of the regression line.
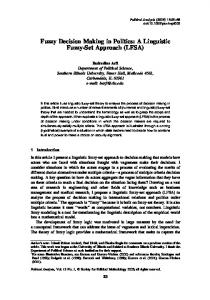
Results Statistics of membership values and land suitability index are presented in Table 6. The membership value indicates the degree of suitability at a given location with respect to a given land characteristic. For instance, a membership value of 0.4 for a land characteristic indicates that suitability of the location is 40% of the ideal requirement of the land characteristic. It also implies that the location has a limitation of 60% with respect to the land characteristic. Average membership value for organic C is the lowest (0.24), whereas that of sand is the highest (0.66). Membership value of organic C also has the lowest coefficient of variation (34%), whereas coefficients of variation of membership values for drainage and ECEC are the highest (57%). Cumulative distribution functions (cdf’s) for membership values of land characteristics are shown in Figure 3. The shapes and positions of the cdf’s are different for the land characteristics. Sixty percent of the data has ECEC ⬍ 0.23 (Figure 3a), indicating that ECEC limitation for maize production is up to 77% for 60% of the data. Similarly, 60% of the data has pH ⬍ 0.47 and organic C ⬍ 0.42. Thus, for chemical properties, the limitation for maize production is in the order
Fuzzy-Based Land Evaluation
233
Figure 3. Cumulative probability distribution of membership values of land characteristics: (a) chemical properties; (b) physical properties.
ECEC ⬎ organic C ⬎ pH. For physical properties, 60% of the data has sand ⬍ 0.78, clay ⬍ 0.25, and drainage ⬍ 1 (Figure 3b). Thus, the severity of the limitation of physical properties for maize production is in the order clay ⬎ sand ⬎ drainage. Table 6 indicates moderate variability in I (CV ⫽ 31%). The mean I is 0.45, indicating that average land suitability for maize is 45% of ideal suitability. Figure 4 shows that 70% of the data is less than 50% of the ideal land suitability. Low values of I reveal low intrinsic quality of the soil, and also explain why maize yields are very low (Table 3). The spatial variability in I is indicated by a variogram (Figure 5). The fitted variogram is a linear model with a spatially uncorrelated variation (nugget variance) of 0.0137. The nugget variance accounts for about 64% of total variation. This suggests microvariability in I that could not be detected at the scale of sampling; that is, there are large homogenous areas that are longer than the lags of the variogram. Future studies could consider reducing the sampling interval, as well as increasing the intensity of sampling to reduce random variation at
small intervals and also account for short-scale variability in I. The monotonically increasing section of the variogram represents the continuous (i.e., spatially dependent) component of the variation. The unbounded spatial dependence structure of I suggests that the range (i.e., the distance beyond which there is no spatial correlation) is larger than the sampled area. This may be due to the fact that the area is predominantly characterized by a single geology (mainly sandstone). The spatial pattern of I (Figure 6a) shows that land suitability for maize increases from the north to the south of the landscape. This map may be used to identify the proportion of land area below or above a given I. The map could also be used to plan land improvement and fertilizer input distribution. Finally, the map could be further combined with other information to develop an environmental sensitivity index for environmental management. The map of the standard deviation of I (Figure 6b) shows uncertainty in I estimates. Higher values are observed in areas where there are few observations (sampling points). Thus, increasing the sampling intensity would lead to reduction in the esti-
234
A. K. Braimoh and others
Figure 4. Cumulative probability distribution of I (N ⫽ 120).
Figure 5. Variogram of land suitability index.
mation variance and hence improve the confidence in estimates of I. The relationship between the observed maize yield and the interpolated I is shown in Figure 7. Both regression coefficients are significant (Table 7), and the coefficient of determination is high. This shows that land suitability is closely related to maize yield in the study area.
Discussion and Conclusion Fuzzy logic is an attempt to extend the concept of continuous variation of soil properties from the geographic space to the attribute space (Burrough and others 1997). Boolean logic works on the principle that a site can belong to one and only one suitability class (e.g., suitable or not suitable). In reality however, there
Fuzzy-Based Land Evaluation
Figure 6. (a) Land suitability index map. (b) Standard deviation map for land suitability index.
235
236
A. K. Braimoh and others
Figure 7. Relationship between maize yield and land suitability index.
Table 7. Estimated regression coefficients b0 and b1 of maize yield and interpolated land suitability indices t probability b0
S.E. (b0)
b1
S.E. (b1)
b0
b1
⫺0.64
0.13
3.20
0.29
⬍ 0.01
⬍ 0.01
cerns assessing a priori, the degree of limitation posed by each land characteristic to the envisaged utilization type. The degree of limitation of a land characteristic could then be converted to limitation score [e.g. following the method of Zhang (1989) cited in Triantafilis and others (2001)]. Finally, the membership value of land characteristic A could be computed using A 共 z兲 ⫽ e ⫺ 0.1s ,
is usually an overlap of classes in the attribute space. The admission of the idea of partial overlap of classes is expressed in terms of membership functions using fuzzy logic. This approach was used by Lark and Bolam (1997) to address both uncertainty in prediction and uncertainty in interpretation of soil data for sugar beet production. Another alternative to Boolean logic is a probabilistic approach using indicator kriging (e.g., Stein 1998). Indicator kriging can be used to estimate the conditional probability that a threshold of land characteristic Ai is exceeded at a given location s0 given the observations Ai(s1), ... , Ai(sn), their measurement locations, and their mutual dependence structure. Again, the conditional probability that a given location is suitable for a given land utilization type (i.e., the threshold is exceeded) assumes the crisp definition of the land-use requirement. Thus, probabilistic approaches may obscure information on the relative suitability to use with respect to land characteristic Ai. Therefore, fuzzy set techniques are to be preferred to Boolean and probabilistic techniques. The use of inverse methods (Triantafilis and others 2001) as an alternative to the Semantic Import (SI) models in fitting membership functions for land characteristics is, in principle, possible. A major issue con-
(8)
where s is the limitation score of land characteristic A. The approach we present in this study does not incorporate management decision. The output of the evaluation is simply a land suitability index map with suitability for maize ranging from 0 to 1. Use of the land for maize or any other crop remains a management decision. Similarly, the fact that an area has a relatively high suitability index does not automatically imply that high yields would be obtained if, for instance, the timing of planting or fertilizer application was wrong. A major advantage of dynamic simulation models over the approach presented here is that dynamic simulation models can incorporate management decisions such as fertilizer application, time of planting, water application, and so forth in predicting crop yields. However, a major problem in utilizing such models in land evaluation is the requirement for large amounts of data. A basic assumption of ordinary kriging used in this study is that the mean of I is constant over the area. There are situations, however, where such intrinsic stationarity assumption may not be met (e.g., when an area has distinct physiographic regions that affect agricultural land suitability). In such situations, other techniques of interpolation such as external drift kriging, which incorporates global trend estimation as part of
Fuzzy-Based Land Evaluation
the solution (Chile`s and Delfiner 1999), would be more appropriate. Extrapolation of the land evaluation results to other parts of Ghana would, in principle, be possible. A major issue concerns the extension of spatial variability information. Possibly, a Bayesian approach could be useful here, in which a prior variogram estimation is done for data from one specific study area, as in this article, and a Bayesian updating takes place for the new area [e.g., following suggestions in Cui and others (1995)]. This then leads to a Bayesian form of kriging, but avoids abundant data collection to have to fully estimate variogram parameters in a new region again. The use of fuzzy and interpolation techniques in this study produced land suitability for maize in a continuous scale. Land suitability indices are low, reflecting low inherent fertility of the soils. High correlation between maize yield and land suitability offers an explanation for the downward trend in maize yields in the study area. Our approach is well applicable for applications in which subtle differences in soil quality are of a major interest. Using the SI model, we were able to evaluate the limitations of land characteristics to maize in the study area. Major constraints to maize production are ECEC, organic C, and clay content. Emphasis should be placed on soil management techniques that conserve organic matter and enhance nutrient and water-holding capacity of the soil. The use of fuzzy techniques for land suitability evaluation thus proved valuable for identifying major constraints to crop production and strategies for overcoming them.
Acknowledgments The German Federal Ministry for Education and Research and the Ministry for Schools, Science and Research of Northrhine Westphalia provided funding for the GLOWA project. The corresponding author also thanks the German Academic Exchange Services (DAAD) for funding his research studies. We sincerely appreciate the comments of Ayo Ogunkunle, Alex McBratney, and Anita Veihe on an earlier draft of this manuscript.
Literature Cited Boogaard, H. L., C. A. van Diepen, R. P. Ro¨ tter, J. M. C. A. Cabrera, and H. H. van Laar. 1998. User’s guide for the WOFOST 7.1 crop growth simulation model and WOFOST Control Center 1.5. Technical Document 52. DLO-Winand Staring Centre, Wageningen, The Netherlands 144 pp. Braimoh, A. K., and P. L. G. Vlek. 2004. Impacts of land-cover change on soil properties in Northern Ghanna, Land degradation and Development,, 15: 65–74.
237
Burrough, P. A. 1989. Fuzzy mathematical methods for soil survey and land evaluation. Journal of Soil Science 40:477– 492. Burrough, P. A., and R. A. McDonnell. 2000. Principles of geographical information systems. Oxford University Press, New York. Burrough, P. A., R. A. McMillian, and W. Van Deursen. 1992. Fuzzy classification methods for determining land suitability from soil profile observation and topography. Journal of Soil Science 43:193–210. Burrough, P. A., P. F. M. van Gaans, and R. Hootsmans. 1997. Continuous classification in soil survey: spatial correlation, confusion and boundaries. Geoderma 77:115–135. Chile`s, J. P., and P. Delfiner. 1999. Geostatistics: Modeling spatial uncertainty. Wiley–Interscience, New York. CIMMYT. 1988. Maize production regions in the developing countries. International Maize and Wheat Improvement Center (CIMMYT), El Batan, Mexico. Cui, H, A. Stein, and D. E. Myers. 1995. Extension of spatial information, Bayesian kriging and updating of prior variogram parameters. Environmetrics 6:373–384. Davidson, D. A., S. P. Theocharopoulos, and R. J. Bloksma. 1994. A land evaluation project in Greece using GIS and based on Boolean and fuzzy set methodologies. International Journal of Geographic Information Systems 8(4):369 –384. Dent, D., and A. Young. 1981. Soil survey and land evaluation. George Allen and Unwin Limited, London. FAO. 1976. A framework for land evaluation. Soils Bulletin 32. FAO, Rome, 72 p. FAO. 1983. Guidelines: Land evaluation for rainfed agriculture. Soils Bulletin 52. FAO, Rome, 237 pp. Fugger, W.-D. 1999. Evaluation of potential indicators for soil quality in Savanna soils in Northern Ghana. Ph.D. thesis, Georg-August University, Go¨ ttingen. Groenemans, R., E. van Ranst, and E. Kerre. 1997. Fuzzy relational calculus in land evaluation. Geoderma 77:283–298. Klingebiel, A. A., and P. H. Montgomery. 1961. Land capability classification. Soil Conservation Service Handbook 210. U.S. Department of Agriculture, Washington, DC. Lark, R. M., and H. C. Bolam. 1997. Uncertainty in prediction and interpretation of spatially variable data on soils. Geoderma 77:263–282. McBratney, A. B., and I. O. A. Odeh. 1997. Application of fuzzy sets in soil science: Fuzzy logic, fuzzy measurement and fuzzy decisions. Geoderma 77:85–113. Ogunkunle, A. O. 1993. Soil in land suitability evaluation: an example with oil palm in Nigeria. Soil Use and Management 9:37– 42. Overseas Development Institute 1999. Rethinking natural resources degradation in semi-arid sub-Saharan Africa: The case of semi-arid Ghana. ODI Rural Policy and Environment Group, London, UK. Rossiter, D. G. 1996. A theoretical framework for land evaluation. Geoderma 72:165–190. Runge-Metzger, A., and L. Diehl. 1993. Farm household systems in Northern Ghana. Verlag Josef Margraf, Weikersheim, Germany.
238
A. K. Braimoh and others
Sankoh, O.A. Braimoh, A. K., Kamara, S. I. (2001) “Spatial data analysis and land evaluation procedures for community development in sub-Saharan Africa” In: Community Development on Sth-Saharm, Africa. Kokor, J. Y., Kroe¨ s (eds.) University of Dortmund SPRING Research Series 31: 85–97. Soil Survey Staff. 1994. Keys to soil taxonomy 7th ed. U.S. Department of Agriculture, Natural Resources Conservation Service, Washington, DC, 644 pp. Stein, A. 1998. Analysis of space-time variability in agriculture and the environment with geostatistics. Statistica Neerlandica 52(1):18 – 41. Storie, R. E. 1933. An index for rating the agricultural value of soils. California Agricultural Experimental Station Bulletin 556, University of California, Berkley. Sys, C. 1985. Land evaluation. State University of Ghent, Ghent; The Netherlands. Tang, H., and E. Van Ranst. 1992. Testing of fuzzy set theory
in land suitability assessment for rainfed maize production. Pedologie 17:129 –147. Triantafilis, J., W. T. Ward, and A. B. McBratney. 2001. Land suitability assessment in the Namoi Valley of Australia, using a continuous model, Amsterdam Journal of Soil Research 39: 273–290. Van Lanen, H. A. 1991. Qualitative and quantitative physical land evaluation: An operational approach. Ph.D. thesis. Agricultural University Wageningen, The Netherlands. Van Ranst, E., H. Tang, R. Groenemans, and S. Sinthurahat. 1996. Application of fuzzy logic to land suitability for rubber production in peninsular Thailand. Geoderma 70:1–19. Zadeh, L. A. 1965. Fuzzy sets. Information and Control 8:338 –353. Zhang, L. A. 1989. A Land suitability evaluation system for specific rural purposes in New South Wales. Ph.D. thesis, The University of Sydney, NSW, Australia.