In the Proceedings of the 5th African Association of Remote Sensing of Environment Conference, 17-22 Oct. 2004, Nairobi, Kenya
LAND USE CHANGE MONITORING APPLYING GEOGRAPHIC INFORMATION SYSTEMS IN THE TAITA HILLS, SE-KENYA Pellikka, P., B. Clark, P. Hurskainen, A. Keskinen, M. Lanne, K. Masalin, P. Nyman-Ghezelbash & T. Sirviö Department of Geography, University of Helsinki, P.O. Box 64, 00014 Helsinki, Finland, e-mail:
[email protected] Key words: GIS, remote sensing, map server, land use, land degradation, urban growth, change detection ABSTRACT The land use changes have been studied in the Taita Hills, Kenya, using geographic information systems. The objectives are: 1) to develop a land use change detection methodology, 2) to study the land use changes as a reflection of human-nature interaction and 3) construct a geographic database. The data applied are digitised topographic maps, aerial photographs from 1955 until 2004 and SPOT XS satellite data from 1987 until 2005. The specific themes of the study are urban growth of Voi, soil erosion processes, land cover and land use change, development of infrastructure, and condition of the indigenous forest remnants.
1. INTRODUCTION Climate changes and rapid population growth cause increasing pressure on the East African highlands. The results of the pressure are manifold: intensified agriculture, decreasing amount of forestland, loss of biodiversity, intensified land degradation and soil erosion. These consequences introduce high demands on land use and land use planning in these areas. Remote sensing data and techniques and geographic information systems (GIS) provide efficient methods for analysis of land use issues and tools for land use planning and modelling. Understanding the driving forces of land use development in the past, managing the current situation with modern GIS tools, and modelling the future, we are able to develop plans for multiple use of natural resources and nature conservation. Satellite remote sensing data is usually the most accurate and up-to-date “map” available of developing countries. Especially with fast growing towns and cities in the developing countries, it is practically the only method that can follow up the urban growth (Baudot, 2001; Hurskainen & Pellikka, 2004). When the satellite image is rectified to a coordinate system, a satellite map can be produced – but a whole lot of other techniques, processes and models can be used for different planning and analysis purposes. Together with aerial photography, satellite remote sensing data forms the base for land use mapping and planning. With modern geographic information systems, flexible geographic databases can be created for land use issues. These data and databases can be distributed in flexible ways via the Internet using map servers. In 1989, the Department of Geography of the University of Helsinki carried out a field study in Taita Hills, entitled Land use and its changes as a reflection of man-environment interaction in the area of Taita Hills, South-eastern Kenya. The study resulted in several M.Sc. theses (e.g. Pellikka, 1990; Raitis, 1990; Teinilä, 1990) and few research reports (e.g. Kivikkokangas-Sandgren et al., 1991). The TAITA project, entitled Development of land use change detection methodology applying geographic information systems in East African highlands, started in January 2003 and
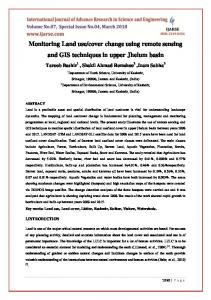
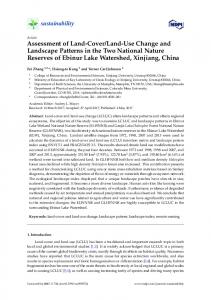
Figure 1. Taita Hills in SE-Kenya. is funded by the Council of Development Studies of the Academy of Finland. The overall objectives of the project are to develop a cost-effective and practical land use change detection methodology and to create a geographic database for the land use and its changes in the area. The aim of the multidisciplinary project is divided in four main sub-objectives: studies in land use change, urban growth, spatio-temporal changes in land degradation, and development of the management systems of naturally protected forests. Methodological development is an essential part of the project. Existing and new change detection methods for remotely sensed data will be tested in mountainous and urban areas. The objective of this paper is to present the project’s data, methods and preliminary results. 2. STUDY AREA Taita Hills, located in SE-Kenya, can be considered as a highrisk area due to rapid population growth and land use changes. Taita Hills (Latitude 3°25´ and 38°20´ longitude) are situated in the middle of the Tsavo plains of Taita-Taveta District (17 000 km2) in Coast Province of Kenya (Figure 1). Taita Hills cover an area of 1000 km2. Taita Hills are surrounded by both western and eastern sections of Tsavo National Park. The town of Voi (population 60 000) is situated on the plains near the border of the eastern section of Tsavo National Park. While the surrounding dry savannah grassland is at an elevation of 700 m, the average height of Taita Hills is 1500 meters, the highest peak being at 2230 meters (Figure 2). The annual rainfall varies from 500 mm in the plains to 1500 mm in the hills (Jaetzold &
digital elevation model (DEM) of the area. For this purpose, the contours lines from additional three map sheets were obtained from the Survey of Kenya. The rough soil map at 1:1 000 000 scale was acquired from ISRIC World Soil Information. Taita Hills was cropped and registered from this Soil and Terrain (SOTER) database (ISRIC, 2004). 3.2 Remote Sensing Data
Figure 2. Taita Hills rise from the plains over 2200 m a.s.l. (Photo: Petri Pellikka). Schmidt, 1983). There are two rainy seasons in the area: from March-May/June and October-December. Variability of precipitation from year to year is high, especially in lower altitudes. Great numbers of ecological regions are based mainly on the relief and climatic conditions in the area. Being part of the Eastern Arc, Taita Hills is very valuable and rich in biodiversity and has many endemic mammal, bird, and butterfly species (Bytebier, 2001). The hills were once forested with cloud forest, but nowadays only few larger patches of indigenous forests are left (Beentje, 1988). These forest patches are not only valuable for the endemic animal and vegetation species, but also for local people because of their importance as sacred forests. Parts of these forest remnants are sacred or traditionally protected. The forests have suffered substantial loss and degradation since the early 1960s. To date, less than 400 ha of original forest is retained in a scatter of three larger remnants, Chawia (50 ha), Ngangao (92 ha) and Mbololo (220 ha), and nine tiny remnants (2-4 ha, one of 12 ha), embedded in a mosaic of human settlements, small-holder cultivation plots and exotic plantations. The population of the whole Taita-Taveta district has grown from 90 146 (1962) persons to over 250 000 (approximation based on projection 1993). The spatial distribution of population in the area follows closely climatic and other ecological conditions. Land use of Taita Hills is dominated by intensive agriculture. Extensive agriculture and grazing are dominant land use types on the foothills and plains. The scarcity of arable land and other natural resources has forced the local communities to move further up the hills and to urban centres, where the highest population densities are reached. Both dominant subsistence farming and high population pressure have caused dynamic changes in land use patterns and have led to serious land degradation (e.g. deforestation, soil erosion, lowering of water tables) in Taita Hills area. Due to intensive agriculture and the large relative height differences of the hills, the foothills especially are subject to land degradation and accelerated soil erosion (Sirviö et al., 2004). In Taita Hills several processes are affecting the sustainable use of natural resources. 3. DATA 3.1 Cartographic Data Six 1:50 000 scale map sheets produced by the Survey of Kenya and covering Taita Hills were digitised for two reasons. First of all, the maps were used for the generation of digital GIS database layers, such as a road network, hydrography and administrative borders (Broberg & Keskinen, 2004). Secondly, the contour lines of the maps were digitised in order to create a
SPOT XS satellite data from 1987, 1992, 1999, 2002 and 2003 are the main data for land use change detection (Table 1). The data have 20 meter spatial resolution and are orthorectified, calibrated, and corrected for topographic effects (Pellikka, 1998; Sandmeier & Itten, 1997). Table 1. SPOT satellite data in the TAITA project. Date Image Sensor Bands July 1 143-357 SPOT 1 G, R, NIR HRV 1 1992 Jan. 12 143-357 SPOT 2 G, R, NIR HRV 1 1992 March 142-357 SPOT 2 G, R, NIR 25 HRV 1 1992 March 143-357 SPOT 2 G, R, NIR 25 HRV 2 1999 Feb. 12 143-357 SPOT 4 G, R, NIR, HRVIR 2 MIR 2002 June 6 142-357 SPOT 4 G, R, NIR HRVIR 1 2003 Oct. 15 143-357 SPOT 4 G, R, NIR, HRVIR1 MIR Year 1987
Black and white aerial photography from 1955, 1986 and 1993 have been scanned and orthorectified using an elevation model generated from the topographic maps (Table 2). The ground resolution varies between approximately 0.14 and 0.46 m depending on the flight altitude above ground, photo scale and scan resolution. New airborne digital camera data were acquired in March 2003 and January 2004 using a true-colour NIKON D1X digital camera (Figure 3). The ground resolution varies between approximately 0.26 and 0.64 m depending on the flight altitude above ground. The areas covered by the different Table 2. Characteristics of the airborne remote sensing data. APC stands for Aerial Photographic Camera and DC for Digital Camera. Sensor APC APC APC DC Leica Leica NIKON RC10 RC10 D1X Year 1955 1986 1993 2003, 2004 Date Jan.Feb. March Feb. 23-25, 03 Jan. 25-28, 04 Mode Black & Black & Black & B, G, R white white white Camera 152.3 151.68 151.21 14 focal mm mm mm mm length Scale/ ~1:30000 ~1:10000 ~1:10000 ~0.26-0.64 ground m resolution Scan 14 µm 21 µm 21 µm resolution 14 µm Ground ~ 0.46 m ~ 0.21 m ~ 0.21 m 0.30–0.64 resolution ~ 0.14 m m
datasets are presented in Figure 4. The digital camera data were used for construction of digital image mosaics over several study sites using EnsoMOSAIC software (Holm et al., 1999; Hurskainen & Pellikka 2004). 3.3 Other Data Types In addition to the GIS datasets, several other data types, such as photographs, publications and verbal data from interviews are gathered during the project life.
Figure 3. NIKON D1X digital camera image with 0.4 m ground resolution over Werugha, Taita Hills.
For the Taita Hills area, digital elevation data was derived from the Survey of Kenya 1:50 000 scale topographic map series. Height information on the nine map sheets was present in the form of 50-feet interval brown contour lines. This height information was itself constructed from field and aerial photography surveys undertaken at various dates. The contour lines were captured automatically and digitally. The 50-feet interval digital contours from different map sheets were merged together in ArcGIS, and any necessary manual edits were made to the data. This then formed a coherent and verified contour database layer, which was the basis for further processing. Utilising the TOPOGRID function in ArcINFO workstation, a 20-metre planimetric resolution raster DEM for the Taita Hills study area was interpolated from the 50-feet digital contours (Figure 5). The TOPOGRID method, which is based upon the ANUDEM program developed by Hutchinson (1989), is optimised to have the computational efficiency of a “local” interpolation method such as an inverse distance weighted interpolation, without losing the surface continuity of a “global” interpolation method, such as kriging. It is, in fact, essentially a discretised thin plate spline technique (Wahba, 1990), where the roughness penalty has been modified to allow the fitted DEM to follow abrupt changes in terrain, such as streams and ridges. As a final stage in the DEM preparation, the attribute values were converted from feet to metres to ensure compatibility with other metric measurements being made as part of the TAITA project. Raster models of slope and aspect were derived from the 20 metre DEM utilising ERDAS Imagine. These layers are used for topographic normalisation of the SPOT XS data. 4.2 Pre-processing of the Satellite Data Prior to analysis, a number of pre-processing steps have to be performed to the satellite data in order to make the pixel brightness values comparable between dates. Basically there are three phases: multitemporal relative spectral calibration, orthorectification and topographic correction.
Figure 4. Remote sensing data over the Taita Hills overlaid on SPOT XS satellite image from 1987. 4. METHODS 4.1 Digital Elevation Model Generation The generation of coherent and accurate digital ground height information in the form of a DEM is a crucial part of any digital mapping, remote sensing, or GIS project. The main objectives of the TAITA project require the generation of a DEM. For example, a DEM is of fundamental importance in the precise topographic correction and normalisation of the SPOT satellite imagery being used to derive thematic land cover information. It is also needed for the orthorectification of the imagery.
In order to conduct reliable change detection using remote sensing data, the influence of varying atmosphere on the reflectance values has to be normalized. This can be done using data of atmospheric characteristics, like in Richter (1990), but in our case such data were not available. Therefore, the multitemporal dataset was calibrated applying a relative method used by Pellikka (1998). In this method, one image is chosen as a master image, and according to it the spectral characteristics of the servant images are normalized. Bright and dark reference areas are selected from the images, whose reflectance values do not vary during the year due to vegetation phenology or moisture content and are situated in each image. Typical bright areas are open sandy areas and typical dark areas are forest and open water surfaces. The mean and standard deviation of the digital numbers (DN) of each area in each image are sampled. The correction algorithm implemented in Erdas Imagine consists of three equations. The linear regression function for the servant image is determined by defining the coefficient as in Equation 1: c= (xMD – xMB) / (xSD – xSB)
(1)
Where c is the coefficient, XSD is the mean of the dark reference image in the servant image, XSB is the mean of the bright reference image in the servant image, XMD is the mean of the dark reference area of the in the master image and XMB the mean of the bright reference area in the master image.
And the intercept is as in Equation 2: i = c C XSD - XMD
(2)
Where i is the intercept. The new DN values (DN* in the equation 3) for the servant image are calculated by Equation 3: DN* = DN C c – i
(3)
As a result, the mean DN values of the reference areas in each image become the same. Therefore it can be assumed that the whole DN value range from 0 to 255 is normalized to the brightness values of the master image, enabling change detection between the images. Orthorectification is necessary for precise registration of the satellite imagery with the national or international coordinate system. Topographic correction is used for correcting the so called slope and aspect effect. Given a uniform land cover, the brightness values in the remote sensing data are higher on sun-exposed slopes than on the slopes oriented away from the sun since they receive more direct solar radiation. Although the effect is not so serious with small solar zenith angles in the tropics, it causes misclassification and hampers multitemporal analysis and has to be corrected. In the several correction methods developed (Sandmeier & Itten, 1997), slope and aspect models derived from the DEM are used for the normalisation. In this study, one of the most efficient correction functions, the C-factor correction developed by Teillet et al. (1982), is used. 4.3 Land Use Change Detection The objective of this study is to find out how climatic change, growing animal and human populations and socio-economic changes have caused pressure on the land use patterns. The period under observation is 1987 - 2004. The primary data used are multispectral SPOT XS satellite images from 1987, 1992, 1999, 2002 and 2003 (Table 1). In addition one SPOT image from 2005 has also been ordered. In addition to satellite images, topographical maps, DEM and field data are used. Field data were gathered in February 2004, including coordinates measured with global positioning system (GPS) receivers, photographs and descriptions for every training area and test area to be used in the classification and accuracy assessment. A Normalized Difference Vegetation Index (NDVI), invented by Rouse et al., (1974), will be calculated for each image from the red and NIR bands of the satellite data using Equation 4. NDVI expresses vegetated ground and the vegetation condition and is closely related to leaf area index (LAI). The land use changes between different years can be studied by NDVI ratios. NDVI = NIR-red / NIR+red
(4)
Where NIR is the DN in the near infrared band and red is the DN in the red band in the SPOT XS image. Supervised classification will be done using sampled training areas. Every image is classified separately using exactly the same training areas. After classification, there is a possibility to test the accuracy of the classification using the test areas (Lillesand & Kiefer, 1994). Classification results in the area and the percentage of different classes, and therefore by comparing
Figure 5. Raster DEM with 20 by 20 m spatial resolution below interpolated from 50 feet contour lines above. different dated images the land cover changes can be directly evaluated. Another method to be used is post classification comparison where images are compared at the pixel level (Jensen, 1996). Using this method it is possible to see directly which classes have changed to which class. In other words, the location and direction of change can be identified. The whole processing chain for the change detection using satellite remote sensing data is presented in Figure 6. 4.4 Land Degradation Studies Soil erosion is a significant problem on the foothills of the Taita Hills. The most serious, rapid and visible damage for the agricultural land and constructed sites in the area is caused by gully erosion. The first objective of the study of land degradation is to determine how different GIS and photogrammetric techniques can be applied for detection of gully erosion change from multi-temporal sets of aerial photographs (Sirviö et al., 2004). This will be investigated both at medium (1:50 000) and large (1:10 000) scales. The stereographic sets and projected mosaics of aerial photographs from the years 1955, 1993 and 2004 will be used for the detection of change in gully densities (m/ha) and gully lengths
(m) in three different study areas; Mwatate, Chawia and Msau/Mbale. Except for the medium scale study, some of the gullies will be subjected to more detailed detection of the change (e.g. volume & area) with the help of high-resolution DEMs and 3D GIS-tools (EnsoMosaic, ArcGIS, ArcInfo) (Daba et al., 2003, Martínez-Casasnovas, 2003).
through techniques which are dependent on the statistical tool (e.g. logistic regression) selected. ∈ represents the model error. 4.5 Mapping Indigenous Forests The indigenous forest remnants of Taita Hills are ecologically isolated which has resulted in endemic fauna and flora. In the future the endemic species are in danger because of forest fragmentation. Ngangao and Chawia are chosen to be the main forests under investigation, since they were covered with the airborne remote sensing data in 1955, 1986 and 2004. These forests consist of mostly indigenous but also exotic tree species. The purpose of the study is to map the changes of indigenous forest area and to study their condition using the airborne digital camera data acquired in January 2004. Special emphasis is put on testing of various pixel-based classification, segmentation and textural methods. In addition, the importance of different image corrections such as light falloff correction and BRDF correction (Pellikka, 1998; Edirisinghe et al., 2001) are evaluated. The digital camera mosaics will be constructed over Ngangao and Chawia using EnsoMOSAIC.
Figure 6. The flowchart of the SPOT XS data processing. The second objective of the study is to investigate the contribution of different erosion factors (e.g. topography, lithology, vegetation & soil properties) to gully erosion. The study of erosion factors and their influence on gully erosion is mainly based on the field study conducted in January-February 2004. A total of 236 field plots (1m2) were investigated in detail and the data collected included surface soil samples (auger), GPS-coordinates, simple physical features (clinometer, measurement tape), soil spectral properties (FieldSpecPro), shear strength (shear vane) (Figure 7) and vegetation and rock fragment cover measurements (1m2 grid). Field plots were also classified according to the visible forms of erosion features (sheet and rill erosion, deposition). The soil samples were scanned for their spectral properties in the soil laboratory of the World Agroforestry Centre, ICRAF, Nairobi. Some of the samples will later be subjected to normal physical and chemical soil tests (e.g. soil texture, pH, P and N) and calculation of soil erosion (SEI) and soil fertility indexes (SFI) (Shepherd & Walsh, 2002).
Mbololo, Ngangao and Chawia forests of Taita Hills are studied within the forest health monitoring program developed by the USDA Forest Service and the National Association of State Foresters (Hertel et al. 2000). The program’s plot structure is the following. The core plot consists of four subplots, each of which has one microplot (Figure 8). The subplots are used to collect data on trees with a diameter at breast height (DBH) of 12.7 m or greater and the microplots are used to collect data on
The final purpose of the study is to estimate gully erosion hazard in the area. This will be based on data available from the high resolution DEMs, geologic and topographic maps, and data collected in the field. Both “the critical slope” concept (e.g. Poesen et al., 2003) and multivariate statistical techniques (e.g. Guzzetti et al., 1999) will be applied to the assessment of the gully erosion hazard in the area. “Critical slope” concept assumes the form (Equation 5): S = aAb,
(5)
where S is the critical slope needed for gully incision, A is the catchment area and a and b are coefficients depending on environmental conditions (e.g. land use) in the area. The general linear multivariate model assumes the form (Equation 6): (6) E1 = B0 + B1 X1 + B2 X2 + B3X3 +…+ BnXn + ∈, where E1 is the presence/absence (or area) of the forms of erosion type 1 in each sampling unit (e.g. grid cell), Xn are input predictor variables (erosion factors) measured or observed for each unit, and Bn are coefficients estimated from the data
Figure 7. Shear vane tests were used both in field plots close to the gully head (above) and around the catchment areas. (Photo: Tommi Sirviö).
saplings and seedlings (EAMICFG, 2000). The plot level data consists of the following parameters: country, mountain area, forest name, sample kind, date, declination setting and coordinates. The subplot data for each tree consists of condition class, species, distance and azimuth from plot center, tree status, DBH/DRC, diameter check, lean angle, total length, actual length, length method, uncompacted crown ratio, crown light exposure, crown position, crown density, transparency, crown dieback, and tree damage. The microplot seedling and sapling counts consist of similar parameters. In addition, the forest condition is registered with the following parameters: condition status, reserve status, owner group, forest type, stand size, regeneration status, stand age, disturbance, disturbance year, treatment, treatment year and physiographic class. In the field study conducted in February 2004 11 program’s sample plots in Ngangao and 6 in Chawia were studied. The forest borders were mapped with a GPS. Hemispherical upward photographs were taken in subplot 1 in each core plot (Figure 9). After digitisation, parameters indicating forest condition, such as LAI and canopy cover % can be retrieved from digitised photographs. For reference, see Pellikka et al. (2000). The analysis of hemispherical photographs will by made using a GLA (Gap Light Analyzer) and results will be compared with the results acquired by the program earlier. The study will be repeated after a few years interval. The LAI and canopy cover % is expected to give important additional data for the program.
Figure 9. Two hemispherical photographs from Ngangao forest (Photos: Milla Lanne). The purpose of the study is to examine road infrastructure and its changes in Taita Hills during the last few decades. The role of the road network and its changes for the development in Taita Hills is also studied. Furthermore, an essential part of the study is to find out how various remote sensing data and interpretation techniques apply to the identification and examination of road infrastructure generally. The main data of the study is multitemporal SPOT XS satellite images and airborne digital camera data acquired in January 2004. Moreover, topographic maps and aerial photography from 1955 and 1986 will be used. The field study was conducted in January - February 2004. During the study, the visual interpretation of the road network is made using the most recent satellite image data and digital camera mosaics and compared to the vector road layer produced. The road points were registered with the GPS and the surface material, width and surrounding environment of each point were noted. Digital interpretation will be made using both the most recent remote sensing data and data from the earlier dates. Finally, the interpretation of road network changes and the comparison of various interpretation techniques will be made. 4.7 Map Server
Figure 8. The EAWLS plot structure. 4.6 Studying Development of Infrastructure Using GIS Road infrastructure and functional transportation have a major influence on the regional development of Taita Hills. An efficient road network is essential for the movement of people and products. Taita Hills is located at the intersection of two international major roads and there are also plenty of roads, which are important for the regional and local traffic in Taita Hills. The population of Taita Taveta district has grown heavily during the last few decades, which has affected the land use and the road infrastructure. The high population pressure and the increased intensity of land use and the changeable natural conditions influence the road infrastructure. Therefore, the planning and construction of comprehensive, effective road infrastructure is essential for the favourable development of Taita Hills in the future.
One of the objects of the TAITA project is to create a geographic database of the land use in the area. With modern geographic information systems (GIS), geographic databases can be created for land use issues. The database over the project area includes the basic information of the area and also the study material of the project and the results of the studies. The data includes aerial photography, satellite images, tabular data, raster maps and vector data. The database is file based and later, if needed, can be transformed into a relational database that can host spatial data. To share this data with different groups a map service is being setup. The purpose of a map service is to distribute the data among different people and organization in an easy and flexible way. The end user can access the data using an Internet browser, like Internet Explorer. They don’t necessary need to have any other software to view and even make some analysis of the data. Map service gives access to both GIS content and GIS capabilities. The user can work with the set of normal map operating tools such as zoom, pan etc. Vector maps also include attributes of the features they contain and they can be accessed from the map service as well. This will allow the end user to access for more information than a plain map and also to perform some analysis functions. Using the map service the user can also download
some of the materials for their own workstation to accomplish tasks of their own. All in all the map service allows a greater amount of people and organizations to access the data not only to view it but also to make queries and even to download some of the materials for their own use. The map service is set up by ESRI’s ArcIMS software. It allows the GIS data to be published in the Internet and it hosts tools to perform queries to the geographic database. The setup also needs a web server for Internet pages to be published. For that the freeware Apache will be used. The ArcIMS software and web server are installed in a server machine in Helsinki University. Also, the database lies in the servers of Helsinki University. The administration of the map service and the upkeep of the database are done by the TAITA group and Helsinki University. Access to the service will be through the project homepages. The functions of the map service can increase in the future. Depending of the need, the map service can be modified as to the functions included and the interface for the users. Also, different types of map services can be included for different groups/organizations, all still using the same database and setup. Password entries can also be included if needed later. Some of these changes can be done by ArcIMS standard tools and others may need some programming of the HTML pages using HTML/DHTML and JavaScripts. The information is passed in ArcXML format from the database to the ArcIMS server and then to the web browser. 5. RESULTS The GIS database is constructed and includes the following layers: road network, hydrography, administrative borders and soils. The DEM covering the area of nine 1:50 000 topographic map sheets is also complete (Figure 10). The raster DEM has a 20 by 20 m spatial resolution. The height is interpolated from 50 feet interval contours.
Table 3. The land cover classes for the SPOT image classification. Agriculture Forest Nyika Barren Other land Agroforestry Indigenous Grasslands Rock Built-up forests outcrop area Maize Secondary Dense Open Water forests bushland soil Riverine Riverine Sparse agriculture forests bushland Sisal Euphorbia Evergreen plantation forests bushland Eucalyptus forests Pine forest The pre-processing for the SPOT images is completed and the data are ready for the classification and change detection phases. The land cover classes for which the training areas and test areas were collected in the field are presented in Table 3. Each SPOT image will be classified into these classes, the changes in percentage and area will be examined. The areas in which there are changes detected will be studied in the field in 2005. A special emphasis will be given to open soil, which is an indicator of overgrazing and soil erosion. The preliminary results from the interpretation of the airborne and satellite remote sensing data show that there have indeed been striking changes in the land use. The area of the sisal plantations has increased since 1980s in Mwatate, but at the same time they have been abandoned close to Voi. The population and area of the town of Voi has increased rapidly, invading the abandoned sisal plantations. The reservoir in Mwatate has shrunk due to an increased amount of siltation. The soil erosion processes already took place during the 1950s in Msau, but were started in Mwatate after the road construction. When comparing the satellite imagery between 1987 and 2002, the Msau area seems to have lost vegetation cover. Precise results in this area are still lacking, but it seems that in the Taita Hills the forested area has decreased and the land under cultivation has increased. However, it has to be noted that since the form of agriculture is foodcrop agriculture with many acroforestry practices, the changes from secondary forests to agroforestry are difficult to distinguish from satellite data. 6. DISCUSSION Satellite imagery, airborne remote sensing data and GIS methods have proved to have great potential for accurate studies of the land use changes in the Taita Hills. The data acquired so far and the results derived from it will form a useful geographic database for future research and governmental planning activities in the area. The results will be available through the map server at the project homepages (http://wwwhelsinki.fi/science/taita) after the project has finished. ACKNOWLEDGMENTS
Figure 10. The raster DEM over the Taita Hills covering one of the nine 1:50 000 sheets.
The authors would like to acknowledge Dr. Evaristus Irandu from the University of Nairobi, Ms. Eija Soini and Dr. Keith Shepherd from ICRAF, Mr. Donald Mombo from Taita Taveta Wildlife Forum and soil conservation officer Suleiman Mwabindo for their contribution for setting up the research
facilities in the Taita Hills. In addition, the staff of East African Wildlife Society and Taita Taveta District administration are acknowledged. This work was funded by the Academy of Finland. The SPOT satellite data was purchased under a research contract between Spotimage and TAITA project. The research permission from the Republic of Kenya is greatly appreciated.
Kivikkokangas-Sandgren, R., S. Tuhkanen & J. Uotila (eds.), 1991. Land Use and Strategies for Survival in the Taita Hills, Taita-Taveta District, Southeastern Kenya. Occasional Papers of the Finnish Association for Development Geography 25, 203 p.
REFERENCES
Martínez-Casasnovas, J.A., 2003. A spatial information technology approach for the mapping and quantification of gully erosion. Catena 50, pp. 293-308.
Baudot, Y., 2001. Geographical analysis of the population of fast-growing cities in the third world. In: Donnay, J.-P., M.J. Barnsley & P.A. Longley (eds.), Remote Sensing and Urban Analysis, pp. 225-241. GISDATA 9, Taylor & Francis, London & New York, 268 p. Beentje, H.J., 1988. An ecologic and floristic study of the forests of the Taita Hills, Kenya. Utafiti 1, pp. 23-66.
Lillesand, T.M. & R.W. Kiefer, 1994. Remote Sensing and Image Interpretation. New York: John Wiley and Sons. 750 p.
Pellikka, P., 1990. Land Use and its Classification Using a Multispectral SPOT XS Satellite Image in the Taita Hills, SEKenya. 54 p. Unpublished M.Sc. Thesis. University of Helsinki, Department of Geography, Helsinki 1990. Pellikka, P., 1998. Development of correction chain for multispectral airborne video camera data for natural resource assessment. Fennia 176(1), pp. 1-110.
Broberg, A. & A. Keskinen, 2004. Geodatabase over Taita Hills, Kenya In: Pellikka, P., J. Ylhäisi & B. Clark (eds.): Taita Hills and Kenya, 2004. Expedition Reports of Department of Geography, University of Helsinki 40, Department of Geography, University of Helsinki. In print.
Pellikka, P., E.D. Seed & D.J. King, 2000. Modelling deciduous forest ice storm damage using aerial CIR imagery and hemispheric photography. Canadian Journal of Remote Sensing 26(6), pp. 394-405.
Bytebier, B., 2001. Taita Hills Biodiversity Project Report. National Museums of Kenya, Nairobi. 47 p.
Poesen, J., Nachtergaele, J., Verstraeten, G. & C. Valentin, 2003. Gully erosion and environmental change: importance and research needs. Catena 50, pp. 91-133.
Daba, S., W. Rieger & P. Strauss, 2003. Assessment of gully erosion in eastern Ethiopia using photogrammetric techniques. Catena 50, pp. 273-291. EAMICFG = Eastern Arc Mountains International Core Field Guide 1.5, 2000. US Forest Service, Department of Agriculture. 125 p. Edirisinghe, A., G.E. Chapman, & J.P. Louis, 2001. Radiometric corrections for multispectral airborne video imagery. Photogrammetric Engineering and Remote Sensing 67 (8), 915-925. Guzzetti, F., A. Carrara, M. Cardinali & P. Reichenbach, 1999. Landslide hazard evaluation: A review of current techniques and their application in multi-scale study. Geomorphology 31, pp. 181-216. ISRIC, 2004. SOTER database http://lime.isric.nl/index.cfm?contentid=165
of
Kenya.
Hertel G.D., S. Madoffe, J. Mwangi, J.G.D. Ward, C. Dull, K. Douce & B. O’Connell, 2000. Monitoring changes in forest condition and land conversion for the Eastern Arc Mountains of Tanzania and Kenya – Progress report. 57 p. Holm, M., A. Lohi, M. Rantasuo, S. Väätäinen, T. Höyhtyä, J, Puumalainen, J. Sarkeala & F. Sedano, 1999. Creation of large mosaics of airborne digital camera imagery. Proc. of 4th Airborne Remote Sensing Conf. and Exhibition, 21-24 June 1999, Ottawa, Canada. Hurskainen, P. & P. Pellikka, 2004. Change detection of informal settlements using multi-temporal aerial photographs – the case of Voi, SE-Kenya. Proceedings of the 5th AARSE conference, 18-21 October, 2004, Nairobi, Kenya. In print. Hutchinson, M. F., 1989. A new procedure for girding elevation and streamline data with automatic removal of spurious pits. Journal of Hydrology 106, 211-232. Jaetzold, R. & H. Schmidt, 1983. Farm management handbook of Kenya. Vol. 11, part C. Ministry of Agriculture, Kenya, 411 p. Jensen, J.R., 1996. Introductory Digital Image Processing: A Remote Sensing Perspective, 2nd ed. Prentice Hall, 316 p.
Raitis, R., 1990. Population growth and fertility in Kenya and a case study of the Taita-Taveta District. 133 p. Unpublished M.Sc. thesis. Department of Geography, University of Helsinki. Richter, R., 1990. A fast atmospheric correction algorithm applied to Landsat TM images. International Journal of Remote Sensing 11(1), pp. 159-166. Rouse, J.W., R.H. Haas, J.A. Schell & D.W. Deering, 1974. Monitoring vegetation systems in the Great Plains with ERTS. Proc. of 3rd Earth Resources Technology satellite-1 Symp. Greenbelt. NASA SP-351, 3010-3017. Sandmeier, S. & K.I. Itten, 1997. A physically-based model to correct atmospheric and illumination effects in optical satellite data of rugged terrain. IEEE Transactions on Geoscience and Remote Sensing 35(3), pp. 708-717. Sirviö, T., A. Rebeiro-Hargrave & P. Pellikka, 2004. Geoinformation in gully erosion studies in the Taita Hills, SEKenya, preliminary results. Proceedings of the 5th AARSE conference, 18-21 October, 2004, Nairobi, Kenya. In print. Shepherd, K.D. & M.G. Walsh, 2002. Development of reflectance spectral libraries for characterization of soil properties. Soil Science Society of America Journal 66, pp. 988998. Teillet, P.M., B. Guindon & D.G. Goodenough, 1982. On the slope and aspect correction of multispectral scanner data. Canadian Journal of Remote Sensing 8(2), pp. 84-106. Teinilä, Y., 1990. Maaperäeroosio luonnon riskitekijänä Taita Hillsillä Keniassa. Paikallisen väestön näkökulma. Unpublished M.Sc. thesis, Department of Geography, University of Helsinki, in Finnish. Wahba, G., 1990. Spline models for observational data. CBMSNSF Regional Conference Series in Applied Mathematics, Philadelphia: Soc. Ind. Appl. Maths.