remote sensing Article
Landslide Mapping in Vegetated Areas Using Change Detection Based on Optical and Polarimetric SAR Data Simon Plank *, André Twele and Sandro Martinis German Aerospace Center (DLR), German Remote Sensing Data Center (DFD), Muenchener Str. 20, 82234 Oberpfaffenhofen, Germany;
[email protected] (A.T.);
[email protected] (S.M.) * Correspondence:
[email protected]; Tel.: +49-8153-28-3460 Academic Editors: Roberto Tomas, Zhenhong Li, Zhong Lu and Prasad S. Thenkabail Received: 29 January 2016; Accepted: 31 March 2016; Published: 6 April 2016
Abstract: Mapping of landslides, quickly providing information about the extent of the affected area and type and grade of damage, is crucial to enable fast crisis response, i.e., to support rescue and humanitarian operations. Most synthetic aperture radar (SAR) data-based landslide detection approaches reported in the literature use change detection techniques, requiring very high resolution (VHR) SAR imagery acquired shortly before the landslide event, which is commonly not available. Modern VHR SAR missions, e.g., Radarsat-2, TerraSAR-X, or COSMO-SkyMed, do not systematically cover the entire world, due to limitations in onboard disk space and downlink transmission rates. Here, we present a fast and transferable procedure for mapping of landslides, based on change detection between pre-event optical imagery and the polarimetric entropy derived from post-event VHR polarimetric SAR data. Pre-event information is derived from high resolution optical imagery of Landsat-8 or Sentinel-2, which are freely available and systematically acquired over the entire Earth’s landmass. The landslide mapping is refined by slope information from a digital elevation model generated from bi-static TanDEM-X imagery. The methodology was successfully applied to two landslide events of different characteristics: A rotational slide near Charleston, West Virginia, USA and a mining waste earthflow near Bolshaya Talda, Russia. Keywords: landslide; change detection; SAR polarimetry; PolSAR; object-based image analysis; OBIA; TanDEM-X
1. Introduction Large landslides are a global phenomenon, causing damage and casualties [1]. Landslides arouse emergency situations when urban areas or man-made constructions, such as buildings, bridges, railroads, and roads, are affected. Rapid mapping of landslides is crucial to detect the extent of the affected area, including grade and type of damage. Rapid mapping is a key element of fast crisis response, e.g., to support rescue, humanitarian, and reconstruction operations in the crisis area [2]. Therefore, Earth Observation (EO) based on satellite remote sensing plays a key role due to its fast response, wide field of view, and relatively low cost [3]. (Semi)-automatic landslide mapping based on satellite EO data provides an important information source to support field surveys. Furthermore, during rapid to very rapid events, i.e., deformation rates in the order of several meters per hour [4], access to the landslide area may be too difficult, making field surveys too dangerous [5]. The most frequently used EO data for rapid mapping of landslides is very high-resolution (VHR) optical satellite imagery [6–8]. A common way for landslide detection is the mapping of rapid changes of the vegetation layer derived from vegetation indices calculated for pre- and post-event optical EO imagery, e.g., [9–15].
Remote Sens. 2016, 8, 307; doi:10.3390/rs8040307
www.mdpi.com/journal/remotesensing
Remote Sens. 2016, 8, 307
2 of 20
However, as heavy rain events are one of the most frequent triggers for landslides, i.e., there is a high probability of cloud coverage right after the event, optical EO data is not always useful for rapid mapping applications [16,17]. The advantages of SAR compared to optical EO sensors are (I) the day and night availability of this active sensor, and (II) its almost complete weather independency due to its longer wavelength. In most cases, SAR EO data of a given crisis area is available earlier than cloud-free optical imagery. Therefore, faster disaster response is enabled by SAR-based rapid mapping procedures. However, for both optical and SAR sensors, the revisit time of the satellite has to be taken into account [18]. In addition to satellite-based methods for landslide mapping, there are also other approaches using for instance airborne laser altimetry (LiDAR), e.g., [19], or advanced field mapping techniques such as the combination of a laser rangefinder binocular combined with a GPS receiver [20], are described in the literature. Despite of their promising results, and contrary to satellite data-based landslide mapping methodologies, those approaches are not suited for a world-wide use due to their limited availability. According to Czuchlewski et al. [21], one post-event single-polarized SAR image is insufficient for distinguishing and mapping landslides. The investigation of the temporal development of the interferometric coherence by analyzing a time-series of SAR imagery, including pre- and post-event imagery in the data stack, enables landslide detection, e.g., [22,23]. While multi-temporal SAR interferometry enables long-term monitoring of extremely slow and very slow movements, e.g., [24–26], speckle tracking approaches are able to measure higher deformation rates (up to tens of meters) [27]. Polarimetric SAR (PolSAR) data of at least two polarizations (dual-pol) provides more information on the ground, which enables a better land cover classification and landslide mapping. Quad-pol data, containing the full polarimetric backscattering (i.e., all four combinations of horizontal (H) and vertical (V) polarized waves) allows the most accurate land cover mapping [28] using SAR data. Based on airborne L- and P-band quad-pol imagery, Rodriguez et al. [29] analyzed changes in the pedestal height and the Radar Vegetation Index (RVI) over time to detect landslides in Taiwan, which were triggered by the 1999 Chi-Chi earthquake. Cui et al. [30] investigated landslides in earthen levees by means of a multi-classifier decision framework for textural features (grey level co-occurrence matrix) derived from multi-polarized SAR imagery. Plank et al. [31] compared object-based landslide detection methods based on PolSAR (dual-pol TerraSAR-X) and VHR optical imagery for a case study in Taiwan. The PolSAR procedure is based on a textural analysis with focus on the Normalized Difference Standard Deviation (NDSD) of the calibrated intensities of both polarimetric channels. Decomposition procedures based on quad-pol SAR imagery, such as the Freeman-Durden decomposition [32] and the further enhancement of it, the Yamaguchi decomposition [33,34], allow the derivation of surface (e.g., bare surfaces), volume (e.g., vegetation) and double-bounce (e.g., man-made objects and at tree trunks) scattering components. Watanabe et al. [35], Yamaguchi [36], Shibayama and Yamaguchi [16,37] report landslide detection procedures by detecting changes of the polarimetric scattering components. Landslides in vegetated areas cause a decrease of volume scattering, i.e., a loss of vegetation, and an increase of surface scattering (bare surfaces). Shibayama et al. [38] found that the local incidence angle has high influence on landslide detection based on polarimetric scattering analysis. In addition to the aforementioned Freeman-Durden decomposition, Yonezawa et al. [39] investigated also the change of the entropy/anisotropy/alpha (H/A/α) decomposition [40] in preand post-event ALOS/PALSAR imagery. H showed lower values for landslide areas than for forested areas. However, farmlands showed similar low values of H as landslides, making the differentiation of these classes very difficult. Except for [30,31], all aforementioned landslide detection procedures are based on change detection approaches of pre- and post-event VHR SAR imagery, requiring identical imaging geometries
Remote Sens. 2016, 8, 307
3 of 20
of both acquisitions. However, VHR archive SAR imagery acquired shortly before a landslide event, especially at the same image acquisition geometry as the next possible post-event imagery, is in most cases not available. Modern VHR SAR missions, such as TerraSAR-X, COSMO-SkyMed, or RADARSAT-2, do not systematically cover the entire world. Each acquisition has to be programmed manually. Furthermore, due to limited disk space on board the satellites and especially due to limited downlink transmission rates, these sensors are not able to provide worldwide coverage within a short time period—i.e., commonly, no archive image recorded shortly before the event is available. Here, we present a fast and transferable landslide detection methodology based only on post-event VHR PolSAR imagery supported by freely available and systematically-acquired pre-event high-resolution (HR) optical data. The post-event VHR PolSAR acquisition can be programmed before the next overpass of the satellite after the landslide event, independent of any geometrical restrictions by a pre-event SAR imagery. The proposed landslide mapping procedure is a semi-automatic change detection approach based on pre-event HR optical imagery of Landsat-8 or Sentinel-2 and post-event VHR PolSAR data (e.g., TerraSAR-X) acquired shortly after the event. The methodology was successfully applied to two case studies of different characteristics: first, a rotational slide, which occurred on 12 March 2015 at the Yeager Airport near Charleston, West Virginia, USA was investigated. Second, the methodology was tested at a mining waste landslide event, which occurred on 1 April 2015 near Bolshaya Talda, Kemerovo Oblast, Russia (cf. Section 2). Section 3 describes the developed landslide mapping methodology. Section 4 describes and discusses the results of both test sites. Finally, a conclusion and outlook is given in Section 5. 2. Study Sites and Data Two landslide events are studied. The first one occurred at the Yeager Airport landslide, Charleston, West Virginia, USA. The second one is a mining waste landslide near Bolshaya Talda, Kemerovo Oblast, Russia. On 12 March 2015, a large-scale landslide occurred at an artificial slope at the Yeager Airport. The airport, completed in 1947, was constructed atop seven semi-connected hilltops. In 2005, due to new Federal Aviation Administration (FAA) safety regulations, the construction of an Engineered Material Arrestor System (EMAS) was necessary. Therefore, the Yeager Airport had to be extended, leading to the construction of a large artificial slope, being the tallest geosynthetic reinforced slope in North America (horizontal/vertical ratio of 1:1). The construction of the slope was finished in 2007 [41]. The construction of this large artificial slope is described in detail in [42]. The functionality of the EMAS was successfully put to the test on 19 January 2010: a US Airways flight bound for Charlotte aborted takeoff. The CRJ 200 aircraft could not stop before the end of the runway. Fortunately, the jet was stopped approximately 45 m from the edge of the slope by the EMAS. All 34 passengers and crew survived the incident with only minor injuries reported. First movements at the slope were noticed in June 2013. In the following time, the deformation increased. On 12 March 2015, the slope failed. A secondary failure of the slope occurred on 13 April 2015 (Figure 1). The landslide can be described as rotational debris slide [4]. Further details on this landslide event, as well as a video of the first slope failure, and a drone flight video recorded after the first slope failure are available at the AGU landslide blog of Dave Petley [43]. These videos are also attached to this article to guarantee long-term accessibility. The available SAR data are two post-event TerraSAR-X HighResolution SpotLight (HS) dual-pol (HH/VV) imagery, acquired on 25 March 2015 (after the first slope failure) and on 16 April 2015 (after the second slope failure). In addition, one pre-event Landsat-8 imagery acquired on 15 January 2015 was used (cf. Table 1).
Remote Sens. 2016, 8, 307
4 of 20
2015 Sens. (after2016, the8,second Remote 307
slope failure). In addition, one pre-event Landsat-8 imagery acquired 4on 15 of 20 January 2015 was used (cf. Table 1).
(a)
(b)
(d)
(c)
(e)
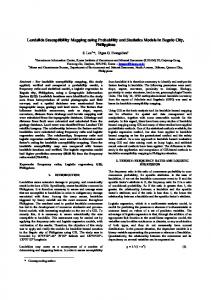
Figure1.1.(a) (a)Pre-failure Pre-failurephotograph photographof ofthe theYeager YeagerAirport Airport[42]; [42];(b) (b)top topof ofthe thelandslide, landslide,showing showingthe the Figure remains of the EMAS (white) and the geosynthetic reinforcements (Marcus Constantino, Charleston remains of the EMAS (white) and the geosynthetic reinforcements (Marcus Constantino, Charleston Gazette12 12March March2015 2015[44]); [44]);(c)(c)the theremains remains Keystone Apostolic Church, which damaged Gazette ofof thethe Keystone Apostolic Church, which waswas damaged by by the landslide (Tyler Bell, Charleston Gazette 13 March 2015 [45]); (d) after the 2nd slope the landslide (Tyler Bell, Charleston Gazette 13 March 2015 [45]); (d) after the 2nd slope failure (F.failure Brian (F. Brian Ferguson, 13 [46]); Apriland 2015 and of asphalt at landslide the toe of Ferguson, CharlestonCharleston Gazette 13 Gazette April 2015 (e)[46]); rolling up(e) of rolling asphaltup at the toe of the the landslide (Rusty Marks, Charleston Gazette 13 April 2015 [46]). (Rusty Marks, Charleston Gazette 13 April 2015 [46]).
The second landslide, to which the developed landslide mapping procedure is applied on, is a The second landslide, to which the developed landslide mapping procedure is applied on, is a large mining waste landslide, which occurred near a road between Novokuznetsk and Bolshaya large mining waste landslide, which occurred near a road between Novokuznetsk and Bolshaya Talda, Talda, Kemerovo Oblast, Russia. This landslide occurred on 1 April 2015 at 1 p.m. local time [47]. It Kemerovo Oblast, Russia. This landslide occurred on 1 April 2015 at 1 p.m. local time [47]. It can be can be described as a very rapid earthflow [4]. Unfortunately, no further details about this landslide described as a very rapid earthflow [4]. Unfortunately, no further details about this landslide event are event are available. However, an interesting video of the landslide is available and provided with available. However, an interesting video of the landslide is available and provided with this article
Remote Sens. 2016, 8, 307
5 of 20
(Source: [47]). Two post-event TerraSAR-X HS dual-pol (HH/VV) SAR imagery acquired on 26 April and 14 August 2015, as well as one pre-event optical Landsat-8 image acquired on 14 September 2014, were available for the analysis (cf. Table 1). Table 1. Timeline of the landslide events and used satellite imagery. Study Site
Date of Event
Acquisition Date
Satellite 1
Relative Orbit 2
Polarization
2 April 2014 15 January 2015
TanDEM-X Landsat-8
226/Asc. 18/33
HH -
Yeager Airport
1st failure: 12 March 2015 2nd failure 13 April 2015
25 March 2015
TerraSAR-X
44/Asc.
HH/VV
16 April 2015
TerraSAR-X
44/Asc.
HH/VV
-
14 September 2014 26 April 2015 14 August 2015
Landsat-8 TerraSAR-X TerraSAR-X
146/22 14/Desc. 14/Desc.
HH/VV HH/VV
Bolshaya Talda
1 April 2015
1
TanDEM-X data was acquired in bi-static mode used for DEM generation; TerraSAR-X imagery was acquired in HighResolution SpotLight (HS) mode: 1.2 m (range) ˆ 2.2 m (azimuth) spatial resolution; Landsat-8 provides imagery in 15 m (pan) and 30 m (multi-spectral) spatial resolution; 2 relative orbit: For Landsat-8: WSR-Path/WSR-Row; for TerraSAR-X: Relative orbit/Path direction with ascending (Asc.) and descending (Desc.).
3. Method The basic principle of the methodology proposed in this article is to detect landslides via change detection of freely available, systematically-acquired HR optical pre-event and VHR PolSAR post-event imagery. Figure 2 shows the flowchart of the procedure. Assuming land cover changes due to a landslide event, i.e., destruction and removal of the vegetation cover the first step (I) of the object-oriented procedure is the pre-selection of formerly-vegetated areas based on the Normalized Difference Vegetation Index (NDVI) of the multispectral pre-event imagery (e.g., Landsat-8 or Sentinel-2). (II) Next, after polarimetric speckle filtering using the edge-preserving refined Lee filter, (III) the H/α decomposition is applied to the post-event polarimetric SAR image to detect, within the pre-selected areas, regions characterized by low entropy (H) values, i.e., evidence of bare soil or rock (landslide material). (IV) Then, assuming a minimum slope value δ ě 20˝ (cf. Section 3.4) as a necessary requirement for a landslide event, the landslide detection map is refined accordingly. (V) Finally, to reduce the number of false classifications, all detected landslides smaller than a minimum mapping unit (MMU) are excluded (cf. Section 3.4). 3.1. Pre-Event Imagery: Selection of Vegetated Areas Cloud-free optical (multispectral, MS) pre-event imagery is used to derive vegetated areas prior to the landslide event. Landsat-8 or the recently launched Sentinel-2 sensor are the preferred sources as their imagery is freely available and systematically acquired with a high repetition rate of five days (Sentinel-2 constellation) to 16 days (Landsat-8). In the ideal case, the optical imagery is acquired shortly before the landslide event. However, due to too high cloud coverage no useful imagery might be available, and optical imagery acquired one year before the event could be used. To minimize seasonal effects on the change detection procedure described below, it is important to use optical data acquired in the same season as the PolSAR imagery. By using data of MS sensors working in the visible and near infrared (NIR) region of the electromagnetic spectrum, one is able to calculate the NDVI, being a proxy for the site’s vegetation density and greenness [48–50]. The NDVI uses the difference of the vegetation signature between the RED (0.6–0.7 µm) and NIR (0.7–1.1 µm) channel (Equation (1)) [51]: NDV I “
N IR ´ RED N IR ` RED
(1)
Remote Sens. 2016, 8, 307
6 of 20
The rationing concept makes the NDVI independent of the illumination, atmospheric effects, topography, etc. Consequently, NDVI images acquired at different dates can be compared. The NDVI ranges from ´1 to +1. As water has commonly no reflection in infrared, its NDVI is ´1. The NDVI value of bare areas (rock, sand, and snow) is less than +0.1. The NDVI increases with vegetation density (NDVI range +0.1 to +0.7) [50]. Vegetated areas in the MS pre-event imagery are selected by Remote Sens. 2016, 307 as threshold. 6 of 20 setting NDVI > 8,+0.1
Figure Figure2.2.Workflow Workflowofofthe thelandslide landslidedetection detectionprocedure procedurebased basedon onpost-event post-eventpolarimetric polarimetricSAR SARand and pre-event optical imagery. pre-event optical imagery.
3.1. Post-Event Pre-Event Imagery: 3.2. Imagery: Selection Selection of of Vegetated Bare AreasAreas Cloud-free MS) pre-event imagery used of to the derive vegetated areas prior The selectionoptical of bare(multispectral, areas (i.e., possible landslide areas) by is means post-event VHR PolSAR to the landslide Landsat-8 or the recently launched Sentinel-2 are the preferred sources imagery requiresevent. several pre-processing steps, which are described insensor the following. as their imagery is freely available and systematically acquired with a high repetition rate of five 3.2.1. Speckle Filtering days Polarimetric (Sentinel-2 constellation) to 16 days (Landsat-8). In the ideal case, the optical imagery is acquired shortly before the landslide dueoftothe too high cloud coverage no useful The speckle effect, which is causedevent. by theHowever, interference coherent reflected SAR waves of imagery might be available, and aoptical imagery onevisual year before the event be used. many individual scatterers within resolution cell, acquired complicates interpretation andcould classification ToSAR minimize seasonal effects on the change detection procedure described below, it is important to of images. The natural environment, characterized by distributed targets, is mainly affected by use optical data acquired in the same season as the PolSAR imagery. the speckle effect. To reduce this effect, polarimetric speckle filtering using the refined Lee filter is By [52,53]. using data MSaims sensors working the visible andimage, near i.e., infrared (NIR)while region of the applied This of filter to preserve theinstructure of the the edges, filtering electromagnetic spectrum, one is able to calculate the NDVI, being a proxy for the site’s vegetation homogenous areas. The correlation between the different polarizations is conserved. The refined Lee density and greenness NDVI uses the vertical, difference of the vegetation the filter searches for edges[48–50]. in eightThe directions: in the horizontal, and twosignature diagonalbetween directions. RED (0.6–0.7 μm) and NIR (0.7–1.1 μm) channel (Equation (1)) [51]: A kernel window of 7 ˆ 7 pixels is used. Then, the covariance matrix is filtered. =
− +
(1)
The rationing concept makes the NDVI independent of the illumination, atmospheric effects, topography, etc. Consequently, NDVI images acquired at different dates can be compared. The NDVI ranges from −1 to +1. As water has commonly no reflection in infrared, its NDVI is −1. The NDVI value of bare areas (rock, sand, and snow) is less than +0.1. The NDVI increases with vegetation density (NDVI range +0.1 to +0.7) [50]. Vegetated areas in the MS pre-event imagery are selected by setting NDVI > +0.1 as threshold.
Remote Sens. 2016, 8, 307
7 of 20
3.2.2. Polarimetric Decomposition Objects with different geometric and structural properties show different SAR backscatter. Based on physical assumptions, polarimetric decomposition procedures aim to separate these different backscatter types [54,55]. As dual-pol SAR imagery was available for this study, the H/α decomposition proposed by Cloude and Pottier [40] was applied. This decomposition is based on the eigenvalues λ and eigenvectors of the covariance matrix C, which is shown in Equation (2) for the current dual-pol case (HH/VV): « xC2 y “ x
|S HH |2 SVV S˚HH
˚ S HH SVV |SVV |2
ff y
(2)
with the Sinclair-Matrix Sxy representing the two combinations of transmitted (index y) and received polarization (index x). The superscript * denotes the complex conjugate. α describes the type of backscattering. α values close to zero indicate domination of surface scattering (single bounce scattering). α values around 45˝ show domination of volume scattering, caused by multiple scattering inside a volume, such as the crown of a tree or dense vegetation [56]. High α values (up to 90˝ ) represent domination of double-bounce scattering (e.g., in urban area). αm represents the mean of α1 and α2 . The former describes the backscattering type of the dominant scatterer and the latter the backscattering type of the second dominant one (Equation (3)): ” 1 αm “ λ1 λ1 ` λ2
« ı λ2
ff α1 α2
(3)
The heterogeneity of the scattering is represented by the entropy H, which ranges from 0 to 1 (Equation (4)). H = 0 indicates a dominant scatterer such as a corner reflector. H +0.1> at+0.1 timeattpre . This is executed were previously previouslycovered covered vegetation, i.e., NDVI time tprechange . This detection change detection is in an object-based image analysis (OBIA) environment the Cognition Language (CNL). executed in an object-based image analysis (OBIA) using environment usingNetwork the Cognition Network First, the H(CNL). image is segmented using is the multiresolution based on the Fractal Net Evolution Language First, the H image segmented using approach the multiresolution approach based on the Approach [57,58]. The developed procedure uses adescribed scale parameter of 10. Fractal Net(FNEA) Evolution Approach (FNEA) [57,58]. The described developedabove procedure above uses a The scale parameter is The an abstract value to determine the maximum possible change of heterogeneity scale parameter of 10. scale parameter is an abstract value to determine the maximum possible with no of direct correlationwith to theno object size measuredto in the pixels [59].size A compactness fromA0 change heterogeneity direct correlation object measured in(ranging pixels [59]. to 1) value of (ranging 0.5 is chosen. are natural Therefore, the are shape parameter, compactness fromThe 0 tofeatures 1) valueofofinterest 0.5 is chosen. The ones. features of interest natural ones. ranging from to 1 was set to 0.1.ranging from 0 to 1 was set to 0.1. Therefore, the0shape parameter, mentioned in the following are mean values for the generated objects, with X All thresholds mentioned representing the the mean mean value value of all pixels within a certain object object for variable variable X. X. There are three representing 0.8 turned turned out out to to be be best best suited to detect possible cases (Equation (5)). Based on empirical tests, H ď ≤ 0.8 landslide areas. #
NDV I t pre ď `0.1 areas free of vegetation at time t pre NDV I t pre ą `0.1 Λ H t post ď 0.8 landslide candidate NDV I t pre ą 0.1 Λ H t post ą 0.8 no landslide candidate
(5)
Areas of NDV I ď +0.1 are free of vegetation at time tpre and are not considered in the following. Based on a threshold of NDV I > +0.1 vegetated areas at the time tpre before the landslide event are selected (cf. Section 3.1). Then, the polarimetric entropy H (cf. Section 3.2.2) is investigated for the areas,
Remote Sens. 2016, 8, 307
9 of 20
which were vegetated at time tpre . Low H values indicate areas free of vegetation, such as landslide material. Consequently, objects are selected as landslide candidates if they are covered by vegetation at tpre but are free of vegetation at tpost , i.e., if NDV I t pre ą `0.1 Λ H t post ď 0.8 is true (Equation (5)). 3.4. Refinement of Classification by Topographic Information Assuming a minimum slope δ value as a necessary requirement for a landslide event, the landslide detection map, described in Section 3.3, is refined as follows: only landslide candidates located at δ ě 20˝ are selected as final landslides (Equation (6)). # NDV I t pre ą `0.1 Λ H t post ď 0.8 Λ δ ě 20˝ final landslide (6) NDV I t pre ą `0.1 Λ H t post ď 0.8 Λ δ ă 20˝ no landslide To detect the foot of a landslide region-growing into neighboring areas of H ď 0.8 and δ > 12˝ is executed. Next, all neighboring landslide objects are merged to a common object. As the Yeager Airport landslide took place on an artificial slope, which was constructed in the year 2007 (cf. Section 2), the Shuttle Radar Topography Mission (SRTM) DEM [60] from the year 2000 is too old and could not be used for the slope analysis at this site. Therefore, we used a bi-static TanDEM-X [61] dataset acquired on 2 April 2014 to generate via SAR interferometric (InSAR) analysis an up-to-date DEM of 12 m spatial resolution. Therefore, a more accurate measurement of the pre-failure slope was obtained. Analysis of optical imagery (Landsat, as well as GoogleEarth) showed that the second study site, i.e., the mining waste landslide in Russia, is a very dynamic area with lots of changes that occurred after the last TanDEM-X acquisition on 23 August 2012 over this area. Therefore, neither the SRTM DEM nor a TanDEM-X DEM could be used for slope analysis in this area. Finally, to decrease the number of false classifications, all detected landslides smaller than a minimum mapping unit (MMU) of 30 m ˆ 30 m are excluded. 4. Results and Discussion 4.1. The Yeager Airport Landslide, Charleston, West Virginia, USA First, the methodology is applied to Test Case 1: the Yeager Airport landslide, located near Charleston, West Virginia, USA. Figures 4–6 show the results of the developed landslide detection procedure based on pre-event optical Landsat-8 imagery and post-event polarimetric VHR TerraSAR-X imagery acquired on 25 March 2015 (after the first failure of the slope) and 16 April 2015 (after the second slope failure). Figures 5 and 6 demonstrate that the landslide is very well detected by the classification. In the SAR image acquired on 25 March 2015, one can also see a small over classification east of the landslide. At the SAR image acquired after the second slope failure the landslide detection procedure was able to detect the main part of the landslide. However, the scarp area of the landslide is not detected. Here, the second slope failure extended the scarp area of the landslide. At this very steep part, geometric distortions such as layover and foreshortening occurred, changing the SAR backscattering values, which influence the landslide detection procedure.
Remote Sens. Sens. 2016, 2016, 8, 8, 307 307 Remote
10 of of 20 20 10
the SAR image and manual digitization. The landslide boundary is clearly visible in the SAR image Remote 2016, 8, 307roughness compared to the surroundings. Furthermore, photographs taken10inofthe 20 due toSens. its different
field or by airplanes (Figure 1), as well as the drone video (Supplementary Materials S2), were used to refine the reference polygon of the landslide.
Figure 4. 4. Overview Overview image the Yeager Yeager Airport Airport landslide. landslide. TerraSAR-X acquired on 25 March March Figure Overview image of of the the Yeager TerraSAR-X data data acquired acquired on 25 25 March Figure 4. Airport landslide. 2015 serves as background image. The orange box shows the area of the Figures 5 and 6. TerraSAR-X 2015 serves as background image. The orange box shows the area of the Figures 5 and 6. TerraSAR-X © 2015 serves as background image. The orange box shows the area of the Figures 5 and 6. TerraSAR-X © 2015 2015 German Aerospace Center (DLR), 2015 Airbus Defence and Space/Infoterra GmbH. 2015 German Aerospace Center (DLR), 2015 Airbus Defence and Space/Infoterra GmbH. © German Aerospace Center (DLR), 2015 Airbus Defence and Space/Infoterra GmbH.
Figure 5. Results (red) (red) of of the the landslide landslide detection detection procedure procedure at at the the Yeager Yeager Airport based on post-event Figure 5. 5. Results Yeager Airport Airport based based on on post-event post-event Figure dual-pol on on 25 2015; 2015; background image) and pre-event optical Landsat-8 dual-pol TerraSAR-X TerraSAR-X(acquired (acquired onMarch 25 March March 2015; background background image) and pre-event pre-event optical dual-pol TerraSAR-X (acquired 25 image) and optical (15 January 2015) imagery. The green polygon marks the reference landslide derived by visual Landsat-8 (15 January 2015) imagery. The green polygon marks the reference landslide derived by Landsat-8 (15 January 2015) imagery. The green polygon marks the reference landslide derived by interpretation and manual digitization of the TerraSAR-X imagery. TerraSAR-X © 2015 German visual interpretation and manual digitization of the TerraSAR-X imagery. TerraSAR-X © 2015 visual interpretation and manual digitization of the TerraSAR-X imagery. TerraSAR-X © 2015 Aerospace Center (DLR), 2015 Airbus Defence Space/Infoterra GmbH. GmbH. German Aerospace Aerospace Center (DLR), 2015 Airbusand Defence and Space/Infoterra Space/Infoterra GmbH. German Center (DLR), 2015 Airbus Defence and
Remote Sens. 2016, 8, 307 Remote Sens. 2016, 8, 307
11 of 20 11 of 20
Figure 6. 6. Result Result (red) (red) of of the the landslide landslide detection detection procedure at the the Yeager Yeager Airport Airport based based on on post-event post-event Figure procedure at dual-pol TerraSAR-X (acquired on 16 April 2015; background image) and pre-event optical dual-pol TerraSAR-X (acquired on 16 April 2015; background image) and pre-event optical Landsat-8 Landsat-8 January 2015) imagery. The green polygon marks the reference landslide by (15 January(152015) imagery. The green polygon marks the reference landslide derivedderived by visual visual interpretation and manual digitization of the TerraSAR-X TerraSAR-X © 2015 interpretation and manual digitization of the TerraSAR-X imagery. imagery. TerraSAR-X © 2015 German German Aerospace Center (DLR), 2015Defence Airbus and Defence and Space/Infoterra Aerospace Center (DLR), 2015 Airbus Space/Infoterra GmbH. GmbH. Table 2. Classification accuracies for the Yeager Airport landslide (12 March and 13 April 2015). Table 2 shows the accuracy values of the methodology applied to the Yeager Airport landslide at Overall accuracy (OA), user’s (UA), and producer’s accuracy (PA). the two stages of the landslide event. We applied an area-based accuracy assessment. The classification results are compared to a polygon the landslide by visual of the SAR image PA of Landslide UAderived Landslide PAinterpretation Other UA Other Date OA [%] and manual digitization. The landslide due to its KHAT different [%]boundary is clearly [%] visible in the [%]SAR image[%] roughness compared to the surroundings. Furthermore, photographs taken in the field or by airplanes 25 March 2015 99.9 87.0 67.4 99.9 100.0 +0.759 (Figure 1), as well as the drone video (Supplementary Materials S2), were used to refine the reference 16 April 2015 99.9 64.3 66.9 99.9 99.9 +0.655 polygon of the landslide.
It is important to note that for nottheonly theAirport relatively small shown in Figures 3–9 were Table 2. Classification accuracies Yeager landslide (12 areas March and 13 April 2015). Overall considered for the validation procedure, but the entire TerraSAR-X HS scene (5 km azimuth × 10 km accuracy (OA), user’s (UA), and producer’s accuracy (PA). ground range). The values of the confusion matrix are described as follows: the overall accuracy PA Landslide UAof Landslide PA Otherarea UA Other (OA), ranging from 0%–100%, describes the ratio correctly classified units (e.g., pixels) to the Date OA [%] KHAT [%] [%] [%] [%] total number of pixels of the satellite scene. The producer’s accuracy (PA), ranging from 0%–100%, 25 March 2015 99.9 87.0detected by the 67.4 classification, 99.9while the100.0 +0.759(also gives the percentage of reference data user’s accuracy 16 April 20150%–100%) 99.9 describes the 64.3 percentage of 66.9 99.9 matching 99.9with the+0.655 ranging from the classification reference data. Finally, the KHAT statistics gives information about the strength of the correlation between the classification resulttoand data. The KHAT coefficient from representing It is important notethe thatreference not only the relatively small areas shownranges in Figures 3–90,were considereda completely random match between classification result and reference data, to +1, representing no for the validation procedure, but the entire TerraSAR-X HS scene (5 km azimuth ˆ 10 km ground randomThe match between result the reference [62]. the overall accuracy (OA), ranging range). values of the classification confusion matrix areand described as follows: OA, asdescribes well as the UA and PA,classified of the class other very high (99.9%). This is due of to from The 0%–100%, thevalues ratio of correctly area unitsare (e.g., pixels) to the total number a two-class i.e., landslide and other (areas(PA), not affected by landslides), pixels of the problem, satellite scene. The producer’s accuracy ranging from 0%–100%, with givesthe the percentage area of the latter being much higher than the while percentage area accuracy coverage(also of landslide. Consequently, of reference data detected by the classification, the user’s ranging from 0%–100%) the interesting parametersofofthe theclassification accuracy assessment thethe UA and PA data. valuesFinally, of the the landslides describes the percentage matchingare with reference KHAT class. statistics gives information about the strength of the correlation between the classification result and the The good matching between the landslide classification result and the reference data, shown in Figure 5 for the SAR image acquired after the first slope failure, is reflected by the high UA and PA
Remote Sens. 2016, 8, 307
12 of 20
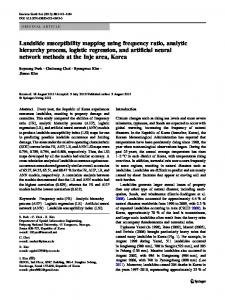
reference data. The KHAT coefficient ranges from 0, representing a completely random match between classification result and reference data, to +1, representing no random match between classification result and the reference [62]. The OA, as well as the values UA and PA, of the class other are very high (99.9%). This is due to a two-class problem, i.e., landslide and other (areas not affected by landslides), with the percentage area of the latter being much higher than the percentage area coverage of landslide. Consequently, the interesting parameters of the accuracy assessment are the UA and PA values of the landslides class. matching between the landslide classification result and the reference data, shown RemoteThe Sens.good 2016, 8, 307 12 of 20 in Figure 5 for the SAR image acquired after the first slope failure, is reflected by the high UA and values of the landslide class of of ca.ca.64% the PA values of the landslide class 64%and and87%, 87%,respectively respectively(cf. (cf.Table Table2). 2). Contrary Contrary to to this, this, the classification results of the image acquired after the second slope failure clearly show lower values classification results of the image acquired after the second slope failure clearly show lower values for for the landslide PA while the landslide UA is stable. The KHAT coefficient theSAR two the landslide classclass PA while the landslide classclass UA is stable. The KHAT coefficient of theoftwo SAR acquisitions shows a similar behavior. acquisitions shows a similar behavior. 4.2. Mining Waste Landslide near Bolshaya Talda, Talda, Kemerovo KemerovoOblast, Oblast,Russia Russia Second, the methodology is applied to Test Test Case Case 2: 2: the the mining mining waste waste landslide landslide near Bolshaya Bolshaya Talda, Russia. Figure 7 shows a falsea color pre-event Landsat-8Landsat-8 imagery Talda, Kemerovo KemerovoOblast, Oblast, Russia. Figure 7 shows false composite color composite pre-event acquired on 14 September 2014 of the mining site. imagery acquired on 14 September 2014 of thewaste mining waste site.
7. Landsat-8 Figure 7. Landsat-8 pre-event pre-event imagery imagery (14 (14 September September 2014) 2014) of of the Russian mining waste site (NIR/Red/Green). The (NIR/Red/Green). Themining miningarea area(cyan) (cyan)isisfree freeofofvegetation. vegetation.Landsat-8 Landsat-8©©USGS USGS2014. 2014.
The landslide 2626 April 2015 and 14 The landslide was was covered coveredtwice twiceby bydual-pol dual-polTerraSAR-X TerraSAR-XHS HSimagery: imagery:On On April 2015 and August 2015. Figures 8 and 9 show the corresponding classification results of the developed 14 August 2015. Figures 8 and 9 show the corresponding classification results of the developed landslide landslide procedure detection procedure as reference well as the reference derived by visual interpretation, i.e., detection as well as the data deriveddata by visual interpretation, i.e., visual change visual change detection between the pre-event optical HR and post-event SAR image data, and detection between the pre-event optical HR and post-event SAR image data, and manual digitization. manual digitization.
Remote Sens. 2016, 8, 307 Remote Sens. Sens. 2016, 2016, 8, 8, 307 307 Remote
13 of 20
13 of of 20 20 13
Figure 8. Result (red)ofof ofthe thelandslide landslidedetection detection procedure procedure at at the Russian mining waste site based onon Figure 8. 8. Result (red) at the theRussian Russianmining miningwaste waste site based Figure Result (red) the landslide detection procedure site based on post-event dual-pol TerraSAR-X (acquired on 26 April 2015; background image) and pre-event post-event dual-pol TerraSAR-X (acquired on 26 April 2015; background image) and pre-event optical post-event dual-pol TerraSAR-X (acquired on 26 April 2015; background image) and pre-event optical Landsat-8 Landsat-8 (14 September September 2014)Green: imagery. Green: Reference Reference derived by visual visual interpretation interpretation Landsat-8 (14 September 2014) imagery. Reference derived byderived visual interpretation and manual optical (14 2014) imagery. Green: by and manual digitization of the TerraSAR-X imagery. TerraSAR-X © 2015 German Aerospace Center digitization of the TerraSAR-X imagery. TerraSAR-X © 2015 German Aerospace Center (DLR), 2015 and manual digitization of the TerraSAR-X imagery. TerraSAR-X © 2015 German Aerospace Center (DLR), 2015 Airbus Defence and Space/Infoterra GmbH. Airbus Defence and Space/Infoterra GmbH. (DLR), 2015 Airbus Defence and Space/Infoterra GmbH.
Figure 9.Result Result(red) (red)of of the the landslide landslide detection detection procedure at at thethe Russian mining waste site based based on Figure Result (red) of the landslide at the Russian mining waste site on Figure 9. 9. detectionprocedure procedure Russian mining waste site based post-event dual-pol TerraSAR-X (acquired on 14 August 2015; background image) and pre-event image) and pre-event onpost-event post-eventdual-pol dual-polTerraSAR-X TerraSAR-X(acquired (acquiredonon1414August August2015; 2015;background background image) and pre-event optical Landsat-8 Landsat-8 (14 (14 September September 2014) 2014) imagery. imagery. Green: Green: reference reference derived derived by by visual visual interpretation interpretation and and optical optical Landsat-8 (14 September 2014) imagery. Green: reference derived by visual interpretation and manual digitization digitization of of the the TerraSAR-X TerraSAR-X imagery. imagery. TerraSAR-X TerraSAR-X © © 2015 2015 German German Aerospace Aerospace Center Center manual manual digitization of the TerraSAR-X imagery. TerraSAR-X © 2015 German Aerospace Center (DLR), (DLR), 2015 2015 Airbus Airbus Defence Defence and and Space/Infoterra Space/Infoterra GmbH. GmbH. (DLR), 2015 Airbus Defence and Space/Infoterra GmbH.
Remote Sens. 2016, 8, 307
14 of 20
The figures clearly show that the developed methodology is only able to detect parts of the landslide. UA values of the landslide class are very high, with ca. 90%, i.e., most of the classification results are correct. However, the low PA values (landslide class) show that only ca. 50% of the real landslide area is detected (Table 3). The reason for this is that the methodology assumes that the landslide area was covered by vegetation before the landslide event. However, this is only true for the area at the foot of the landslide, where the landslide ran over an area outside of the mining waste area (formerly vegetated area). The landslide moved from east to west. The mining waste area itself is free of vegetation and, therefore, shows low NDVI values in the pre-event optical imagery (Figure 7). Therefore, the developed methodology is not able to detect the part of the landslide which occurred inside the mining waste area. Furthermore, the entropy H, alone, would only detect the entire mining waste area and not only the landslide area, as the entire mining waste area is characterized by low H values, i.e., the area is free of vegetation (bare soil). Table 3. Classification accuracies for the Russian mining waste landslide (01 April 2015). Overall accuracy (OA), user’s (UA), and producer’s accuracy (PA). Date
OA [%]
PA Landslide [%]
UA Landslide [%]
PA Other [%]
UA Other [%]
KHAT
26 April 2015 14 August 2015
96.8 96.8
48.2 49.7
89.6 90.0
99.7 99.7
97.0 97.0
+0.612 +0.625
When considering only the area outside of the original mining site as affected landslide area, the PA of the landslide class increases to 83%–90%, while the UA of the landslide class slightly decreases (Table 4). The developed landslide detection methodology based on post-event polarimetric VHR SAR imagery showed promising accuracy values. However, the limitation of this methodology is that only landslides at slopes previously covered by vegetation can be detected. Table 4. Classification accuracies for the Russian mining waste landslide (1 April 2015). Only landslide material outside the original mining site is treated as a landslide. Overall accuracy (OA), user’s (UA), and producer’s accuracy (PA). Date
OA [%]
PA Landslide [%]
UA Landslide [%]
PA Other [%]
UA Other [%]
KHAT
26 April 2015 14 August 2015
98.8 99.1
83.1 90.0
76.4 81.6
99.3 99.4
99.5 99.7
+0.790 +0.850
4.3. General Discussion Other landslide detection methodologies reported in the literature are based on change detection approaches using pre- and post-event PolSAR imagery [16,29,35,37,39,63]. As the side-looking geometry of SAR systems causes geometric distortions (e.g., shadowing, foreshortening, etc.) identical acquisition geometries for pre- and post-disaster imagery are required for change detection applications. However, as mentioned in Section 1, VHR archive SAR imagery acquired shortly before a disaster event, in particularly at the same image geometry as the next possible post-event acquisition, is in most cases not available. The advantage of the methodology presented in this article is that in addition to freely available and systematically acquired pre-event HR optical imagery only post-event VHR PolSAR is required, which can be programmed before the next overpass of the satellite, independent of any geometrical restrictions by a pre-event SAR imagery. Nevertheless, to guarantee useful image acquisition geometries, i.e., to decrease the influence of layover and shadowing effects, the terrain and the slope’s orientation in space should be considered [64]. Also, the procedure proposed in the current article is based on change detection. Contrary to the aforementioned studies, we use an optical
Remote Sens. 2016, 8, 307
15 of 20
HR imagery, which is systematically acquired and freely available for the entire Earth’s landmass (cf. Section 3.1). Compared to other published procedures, which apply a pixel-based classification of the PolSAR imagery, e.g., [16,29,35,37], the proposed OBIA methodology enables an incorporation of optical pre-event imagery and also the additional use of DEM data, which strongly increases the classification accuracy. According to Shimada et al. [17] and Dabbiru et al. [65], L-band is better suited for landslide detection than X-band, as due to its longer wavelength, L-band is characterized by a better penetration through the forest canopy. On the other hand, the shorter wavelength of X-band enables the acquisition of higher spatial resolution imagery compared to L-band. Consequently, smaller and thinner landslides are only detectable by X-band. In summary, one has to find a compromise between the degree of penetration through vegetation (i.e., detection of landslide mass under tree canopy) and spatial resolution (i.e., detection of smaller landslides, not covered by vegetation)—and data availability. L-band imagery is currently only provided by ALOS-2/PALSAR-2. However, its imagery is acquired at a pre-planned acquisition schedule. Contrary to this, X-band satellite missions, such as TerraSAR-X, acquire imagery after an on demand tasking, enabling a very flexible acquisition and fast reaction in case of a disaster, e.g., a landslide event. Therefore, this article presented a methodology based on VHR X-band PolSAR imagery. The most important information for the landslide identification is the polarimetric entropy H derived from the post-event SAR imagery. As shown in Table 1, the proposed methodology is based on TerraSAR-X HS imagery of 1.2 m (range) ˆ 2.2 m (azimuth) spatial resolution. Based on our experience we can report that landslides with a minimum size of 30 m ˆ 30 m are detectable using only VHR PolSAR imagery. The pre-failure information on vegetation cover can be derived from 10 m to 30 m spatial resolution optical imagery (e.g., Sentinel-2 or Landsat-8). The aforementioned MMU of 30 m ˆ 30 m was also chosen to consider the spatial resolution of Landsat-8. Since very small landslides as mentioned above cover only 1 to 9 pixels in the optical imagery, it is very difficult to identify such landslides in the optical imagery itself. However, this does not influence the results of the methodology, as the optical data is only used to derive NDVI information for selecting pre-failure vegetated slopes. The segmentation of the OBIA approach is based on the higher spatial resolution PolSAR imagery (cf. Section 3.3). The proposed landslide detection methodology is based on change detection between pre-event optical and post-event PolSAR imagery. The change we focus on is the removal of the vegetation cover by the landslide. However, as slow-moving slides and slide-earth flows often still preserve entire portions of undisturbed vegetation cover, the proposed methodology is limited to the detection of rapid and faster movements [4], i.e., to the detection of landslides where the vegetation cover was removed. Czuchlewski et al. [21] used VHR L-band airborne SAR imagery of full polarization to map landslides after the 1999 Chi-Chi earthquake in Taiwan. Despite of their promising results, a worldwide applicability of airborne PolSAR sensors is not feasible. Only satellite-based remote sensing enables fast response to disasters with global applicability. Quad-pol imagery provides more information on the backscattering characteristics than dual-pol imagery. In general, the former achieves higher classification accuracies [28]. The methodology proposed in the current article is based on TerraSAR-X imagery. This SAR sensor provides only dual-pol imagery in operational mode (quad-pol data are only available in an experimental mode). Nevertheless, Sections 4.1 and 4.2 showed that high accuracy values can be achieved even with dual-pol imagery. 5. Conclusions This article presented a fast and transferable methodology for landslide detection. The procedure combines post-event Very High Resolution (VHR) Polarimetric Synthetic Aperture Radar (PolSAR) imagery of TerraSAR-X with pre-event multispectral imagery of Landsat-8 or Sentinel-2.
Remote Sens. 2016, 8, 307
16 of 20
First, vegetated slopes are selected in the pre-event imagery using the Normalized Difference Vegetation Index (NDVI) and a Digital Elevation Model (DEM). Second, based on the post-event VHR PolSAR imagery, areas of low polarimetric entropy H, derived by the entropy/alpha (H/α) polarimetric decomposition, are extracted. Low H values represent areas free of vegetation, e.g., areas covered by landslide material, whereas high H values are characteristic for densely vegetated areas, such as forests. Landslides are detected by change detection between the pre-event optical and the post-event PolSAR imagery. More precisely, possible landslides are areas, which are characterized by a high NDVI value in the pre-event imagery and a low H value in the post-event acquisition. The developed landslide detection procedure is characterized by the following advantages: 1.
2.
3.
The utilization of SAR imagery allows fast response in a crisis situation due to the day/night availability and almost complete weather independency of the SAR system. As heavy rain events are an important trigger for landslides, optical sensors, relying on a cloud-free sky to be able to provide a useful imagery are, in many cases, not suited. The presented methodology requires only freely-available and systematically-acquired pre-event optical high resolution imagery and post-event VHR PolSAR imagery. Other landslide mapping procedures, which are based on change detection using SAR imagery, require pre- and post-event VHR SAR imagery. However, the VHR archive SAR imagery acquired shortly before a landslide event are, in most cases, not available. This is especially true when a certain imaging geometry is required determined by the next possible SAR acquisition over the crisis area. Modern VHR SAR missions, such as COSMO-SkyMed, TerraSAR-X, or RADARSAT-2 do not systematically cover the entire Earth’s landmass. The methodology proposed in this article is also based on change detection. However, high-resolution optical imagery of Landsat-8 or Sentinel-2 is used as pre-event information. As these imagery are freely available and systematically acquired on the entire Earth’s landmass at high repetition rates (cf. Section 3.1), it is guaranteed that useful, i.e., cloud-free, pre-event imagery is available for the entire Earth’s landmass. In the ideal case, the optical imagery is acquired shortly before the landslide event. However, in cases where cloud coverage is too high, cloud-free optical imagery acquired at the same season one year before could be used.
The methodology was successfully applied to two landslide case studies of different characteristics: a rotational slide near Charleston, West Virginia, USA, which occurred on 12 March 2015, and a mining waste earthflow near Bolshaya Talda, Russia, which occurred on 1 April 2015. In the future, the developed methodology will be applied and tested on further upcoming landslide events, also including applicability tests during rapid mapping activities of DLR’s Center for Satellite Based Crisis Information (ZKI). In addition to the Landsat-8 data utilized in this study, imagery of the recently launched Sentinel-2 will also be employed as pre-event information. Supplementary Materials: The following are available online at www.mdpi.com/2072-4292/8/4/307/s1, Video S1: First slope failure of the Yeager Airport landslide (from AGU landslide blog of Dave Petley [43]), Video S2: Drone flight over the Yeager Airport landslide (AGU landslide blog of Dave Petley [43]), Video S3: Moving landslide mass at Bolshaya Talda mining waste landslide (It is originally from [47]). Acknowledgments: The authors would like to thank Dave Petley, who provided with his AGU landslide blog valuable background information about the studied landslides (http://blogs.agu.org/landslideblog/). The authors thank the three anonymous reviewers for their very constructive remarks. This work has been funded by ESA in the framework of the ASAPTERRA project (Contract No.: 4000112375/14/I-NB). TerraSAR-X and TanDEM-X data was provided by DLR through the MTH2790 and HYDR6913 projects. Author Contributions: Simon Plank, the principle author, wrote the paper and developed and tested the methodology. André Twele and Sandro Martinis supported the application of the technique and provided suggestions for its improvement. All authors read, revised and approved the final manuscript. Conflicts of Interest: The authors declare no conflict of interest.
Remote Sens. 2016, 8, 307
17 of 20
Abbreviations The following abbreviations are used in this manuscript: ALOS CNL DEM DLR EMAS EO FAA FNEA HR HS InSAR LiDAR MS NDVI NIR OA OBIA PA PALSAR PolSAR RVI SAR SRTM UA USGS VHR
Advanced Land Observing Satellite Cognition Network Language Digital Elevation Model German Aerospace Center Engineered Material Arrestor System Earth Observation Federal Aviation Administration Fractal Net Evolution Approach High Resolution HighResolution SpotLight Synthetic Aperature Radar Interferometry Light Detection And Ranging Multispectral Normalized Difference Vegetation Index Near-Infra-Red Overall Accuracy Object-Based Image Analysis Producer’s Accuracy Phased Array type L-band Synthetic Aperture Radar Polarimetric Synthetic Aperture Radar Radar Vegetation Index Synthetic Aperture Radar Shuttle Radar Topography Mission User’s Accuracy United States Geological Survey Very High Resolution
References 1. 2. 3.
4.
5.
6.
7.
Petley, D. Global patterns of loss of life from landslides. Geology 2012, 40, 927–930. [CrossRef] Voigt, S.; Kemper, T.; Riedlinger, T.; Kiefl, R.; Scholte, K.; Mehl, H. Satellite image analysis for disaster and crisis-management support. IEEE Trans. Geosci. Remote Sens. 2007, 45, 1520–1528. [CrossRef] Singleton, A.; Li, Z.; Hoey, T.; Muller, J.-P. Evaluating sub-pixel offset techniques as an alternative to D-InSAR for monitoring episodic landslide movements in vegetated terrain. Remote Sens. Environ. 2014, 147, 133–144. [CrossRef] Cruden, D.M.; Varnes, D.J. Landslides Types and Processes. In Landslides: Investigation and Mitigation. Special Report 247, Transportation Research Board, National Research Council; Turner, A.K., Schuster, R.L., Eds.; National Academy Press: Washington, DC, USA, 1996; pp. 36–75. Manconi, A.; Casu, F.; Ardizzone, F.; Bonano, M.; Cardinali, M.; de Luca, C.; Gueguen, E.; Marchesini, I.; Parise, M.; Vennari, C.; et al. Brief Communication: Rapid mapping of landslide events: The 3 December 2013 Montescaglioso landslide, Italy. Nat. Hazards Earth Syst. Sci. 2014, 14, 1835–1841. [CrossRef] Tralli, D.M.; Blom, R.G.; Zlotnicki, V.; Donnellan, A.; Evans, D.L. Satellite remote sensing of earthquake, volcano, flood, landslide and coastal inundation hazards. ISPRS J. Photogramm. Remote Sens. 2005, 59, 185–198. [CrossRef] Scainoi, M.; Longoni, L.; Melillo, V.; Papini, M. Remote Sensing for Landslide Investigations: An Overview of Recent Achievements and Perspectives. Remote Sens. 2014, 6, 9600–9652. [CrossRef]
Remote Sens. 2016, 8, 307
8.
9.
10. 11.
12. 13.
14. 15.
16. 17. 18. 19. 20. 21. 22.
23.
24. 25. 26.
27.
28. 29.
18 of 20
Joyce, K.E.; Samsonov, S.V.; Levick, S.R.; Engelbrecht, J.; Belliss, S. Mapping and monitoring geological hazards using optical, LiDAR, and synthetic aperture RADAR image data. Nat. Hazards 2014, 73, 137–163. [CrossRef] Martha, T.R.; Kerle, N.; Jetten, V.; van Westen, C.J.; Kumar, K.V. Characterising spectral, spatial and morphometric properties of landslides for semi-automatic detection using object-oriented methods. Geomorphology 2010, 116, 24–36. [CrossRef] Mondini, A.C.; Chang, K.-T.; Yin, H.-Y. Combining multiple change detection indices for mapping landslides triggered by typhoons. Geomorphology 2011, 134, 440–451. [CrossRef] Behling, R.; Roessner, S.; Segl, K.; Kleinschmit, B.; Kaufmann, H. Robust Automated Image Co-Registration of Optical Multi-Sensor Time Series Data: Database Generation for Multi-Temporal Landslide Detection. Remote Sens. 2014, 6, 2572–2600. [CrossRef] Behling, R.; Roessner, S.; Kaufmann, H.; Kleinschmit, B. Automated Spatiotemporal Landslide Mapping over Large Areas Using RapidEye Time Series Data. Remote Sens. 2014, 6, 8026–8055. [CrossRef] Hölbling, D.; Füreder, P.; Antolini, F.; Cigna, F.; Casagli, N.; Lang, S. A Semi-Automated Object-Based Approach for Landslide Detection Validated by Persistent Scatterer Interferometry Measures and Landslide Inventories. Remote Sens. 2012, 4, 1310–1336. [CrossRef] Othman, A.A.; Gloaguen, R. Automatic Extraction and Size Distribution of Landslides in Kurdistan Region, NE Iraq. Remote Sens. 2013, 5, 2389–2410. [CrossRef] Mondini, A.C.; Guzzetti, F.; Reichenbach, P.; Rossi, M.; Cardinali, M.; Ardizzone, F. Semi-automatic recognition and mapping of rainfall induced shallow landslides using optical satellite images. Remote Sens. Environ. 2011, 7, 1743–1775. [CrossRef] Shibayama, T.; Yamaguchi, Y. An application of polarimetric radar analysis on geophysical phenomena. In Proceedings of the IEEE IGARSS, Melbourne, Australia, 21–26 July 2013; pp. 3191–3194. Shimada, M.; Watanabe, M.; Motooka, T.; Ohki, M.; Wada, Y. PALSAR-2 and Pi-SAR-L2—Multi frequency Polarimetric Sensitivity on Disaster. In Proceedings of the EUSAR Berlin, Germany, 3–5 June 2014; pp. 93–94. Plank, S. Rapid Damage Assessment by Means of Multi-Temporal SAR—A Comprehensive Review and Outlook to Sentinel-1. Remote Sens. 2014, 6, 4870–4906. [CrossRef] McKean, J.; Roering, J. Objective landslide detection and surface morphology mapping using high-resolution airborne laser altimetry. Geomorphology 2004, 57, 331–351. [CrossRef] Santangelo, M.; Cardinali, M.; Rossi, M.; Mondini, A.C.; Guzzetti, F. Remote landslide mapping using a laser rangefinder binocular and GPS. Nat. Hazards Earth Syst. Sci. 2010, 10, 2539–2546. [CrossRef] Czuchlewski, K.R.; Weissel, J.K.; Kim, Y. Polarimetric synthetic aperture radar study of the Tsaoling landslide generated by the 1999 Chi-Chi earthquake, Taiwan. J. Geophys. Res. 2003, 108, 6006. [CrossRef] Christophe, E.; Chai, A.S.; Yin, T.; Kwoh, L.K. 2009 Earthquakes in Sumatra: The Use of L-band Interferometry in a SAR-Hostile Environment. In Proceedings of the IEEE IGARSS, Honolulu, HI, USA, 25–30 July 2010; pp. 1202–1205. Kawamura, M.; Tsujino, K.; Tsujiko, Y.; Tanjung, J. Detection Method of Slope Failures Due to the 2009 Sumatra Earthquake by Using TerraSAR-X Images. In Proceedings of the IEEE IGARSS, Vancouver, BC, Canada, 24–29 July 2011; pp. 4292–4295. Ferretti, A.; Prati, C.; Rocca, F. Nonlinear Subsidence Rate Estimation Using Permanent Scatterers in Differential SAR Interferometry. IEEE Trans. Geosci. Remote Sens. 2000, 38, 2202–2012. [CrossRef] Ferretti, A.; Fumagalli, A.; Novali, F.; Prati, C.; Rocca, F.; Rucci, A. A New Algorithm for Processing Interferometric Data-Stacks: SqueeSAR. IEEE Trans. Geosci. Remote Sens. 2011, 49, 3460–3470. [CrossRef] Berardino, P.; Fornaro, G.; Lanari, R.; Sansosti, E. A new algorithm for surface deformation monitoring based on small baseline differential SAR interferograms. IEEE Trans. Geosci. Remote Sens. 2002, 40, 2375–2383. [CrossRef] Raspini, F.; Ciampalini, A.; Del Conte, S.; Lombardi, L.; Nocentini, M.; Gigli, G.; Ferretti, A.; Casagli, N. Exploitation of Amplitude and Phase of Satellite SAR Images for Landslide Mapping: The Case of Montescaglioso (South Italy). Remote Sens. 2015, 7, 14576–14596. [CrossRef] Ainsworth, T.L.; Kelly, J.P.; Lee, J.S. Classification comparisons between dual-pol, compact polarimetric and quad-pol SAR imagery. ISPRS J. Photogramm. Remote Sens. 2009, 64, 464–471. [CrossRef] Rodriguez, K.M.; Weissel, J.K.; Kim, Y. Classification of Landslide Surfaces Using Fully Polarimetric SAR: Examples from Taiwan. In Proceedings of the IEEE IGARSS, Toronto, Canada, 24–28 July 2002; pp. 2918–2920.
Remote Sens. 2016, 8, 307
30. 31.
32. 33. 34.
35. 36. 37.
38. 39. 40. 41. 42.
43. 44. 45. 46. 47.
48. 49. 50. 51.
52.
19 of 20
Cui, M.; Prasad, S.; Mahrooghy, M.; Aastoos, J.V.; Lee, M.A.; Bruce, L.M. Decision Fusion of Textural Features Derived From Polarimetric Data for Levee Assessment. IEEE J-STARS 2012, 5, 970–976. [CrossRef] Plank, S.; Hölbling, D.; Eisank, C.; Friedl, B.; Martinis, S.; Twele, A. Comparing object-based landslide detection methods based on polarimetric SAR and optical satellite imagery—A case study in Taiwan. In Proceedings of the 7th International Workshop on Science and Applications of SAR Polarimetry and Polarimetric Interferometry, POLinSAR 2015, Frascati, Italy, 26–30 January 2015; p. 5. Freeman, A.; Durden, S.L. A three-component scattering model for polarimetric SAR data. IEEE Trans. Geosci. Remote Sens. 1998, 36, 963–973. [CrossRef] Yamaguchi, Y.; Moriyama, T.; Ishido, M.; Yamada, H. Four-component scattering model for polarimetric SAR image decomposition. IEEE Trans. Geosci. Remote Sens. 2005, 43, 1699–1706. [CrossRef] Yamaguchi, Y.; Sato, A.; Boener, W.-M.; Sato, R.; Yamada, H. Four-Component Scattering Power Decomposition with Rotation of Coherency Matrix. IEEE Trans. Geosci. Remote Sens. 2011, 49, 2251–2258. [CrossRef] Watanabe, M.; Yonezawa, C.; Iisaka, J.; Sato, M. ALOS/PALSAR full polarimetric observations of the Iwate-Miyagi Nairiku earthquake of 2008. Int. J. Remote Sens. 2012, 33, 1234–1245. [CrossRef] Yamaguchi, Y. Disaster Monitoring by Fully Polarimetric SAR Data Acquired With ALOS-PALSAR. IEEE Proc. 2012, 100, 2851–2860. [CrossRef] Shibayama, T.; Yamaguchi, Y. A landslide detection based on the change of scattering power components between multi-temporal PolSAR data. In Proceedings of the IEEE IGARSS, Quebec, Canada, 13–18 July 2014; pp. 2734–2737. Shibayama, T.; Yamaguchi, Y.; Yamada, H. Polarimetric Scattering Properties of Landslides in Forested Areas and the Dependence on the Local Incidence Angle. Remote Sens. 2015, 7, 15424–15442. [CrossRef] Yonezawa, C.; Watanabe, M.; Saito, G. Polarimetric decomposition analysis of ALOS PALSAR observation data before and after a landslide event. Remote Sens. 2012, 4, 2314–2328. [CrossRef] Cloude, S.R.; Pottier, E. An entropy based classification scheme for land applications of polarimetric SAR. IEEE Trans. Geosci. Remote Sens. 1997, 35, 68–78. [CrossRef] Charleston Gazette. 22 March 2015. Available online: http://www.wvgazettemail.com/article/20150322/ GZ01/150329837 (accessed on 23 March 2015). STGEC 2010. Available online: https://stgec.org/presentations/STGEC_2010/2010%20STGEC%20-%20 Yeager%20Airport%20-%20Tallest%20Reinforced%20Slope%20in%20N%20America.pdf (accessed on 21 December 2015). Petley, D. AGU Landslide Blog. Yeager Airport Landslide. 2015. Available online: http://blogs.agu.org/ landslideblog/2015/04/14/yeager-airport-landslide-next/ (accessed on 15 April 2015). Charleston Gazette. 12 March 2015. Available online: http://www.wvgazettemail.com/article/20150312/ DM05/150319672 (accessed on 13 March 2015). Charleston Gazette. 13 March 2015. Available online: http://www.wvgazettemail.com/article/20150313/ DM01/150319516/2007062715 (accessed on 14 March 2015). Charleston Gazette. 13 April 2015. Available online: http://www.wvgazettemail.com/article/20150413/ GZ01/150419806 (accessed on 14 April 2015). Petley, D. AGU Landslide Blog. The Bolshaya Talda Earthflow in Russia Was a Mine Waste Failure. 2015. Available online: http://blogs.agu.org/landslideblog/2015/04/20/bolshaya-talda-1/ (accessed on 21 April 2015). Lillesand, T.M.; Kiefer, R.W. Remote Sensing and Image Interpretation, 4th ed.; John Wiley & Sons: New York, NY, USA, 2000. Gupta, R.P. Remote Sensing Geology; Springer: Heidelberg, Germany, 2003. Albertz, J.; Wiggenhagen, M. Guide for Photogrammetry and Remote Sensing, 5th ed.; Wichmann: Paderborn, Germany, 2009. Rouse, J.W.; Haas, R.H.; Schell, J.A.; Deering, D.W. Monitoring vegetation systems in the Great Plains with ERTS. In Third Earth Resources Technology Satellite–1 Syposium, Volume I: Technical Presentations, NASA SP-351; Freden, S.C., Mercanti, E.P., Becker, M., Eds.; NASA: Washington, DC, USA, 1974; pp. 309–317. Lee, J.S. Refined filtering of image noise using local statistics. Comput. Graph. Image Process. 1981, 15, 380–389. [CrossRef]
Remote Sens. 2016, 8, 307
53. 54. 55. 56. 57.
58.
59.
60.
61.
62. 63.
64. 65.
20 of 20
Lee, J.S.; Jurkevich, I.; Dewaele, P.; Wambacq, P.; Oosterlinck, A. Speckle filtering of synthetic aperture radar images: A review. Remote Sens. Rev. 1994, 8, 313–340. [CrossRef] Cable, J.W.; Kovacs, J.M.; Shang, J.; Jiao, X. Multi-Temporal polarimetric RADARSAT-2 for land cover monitoring in northeastern Ontario, Canada. Remote Sens. 2014, 6, 2372–2392. [CrossRef] Qi, Z.; Yeh, A.G.-O.; Li, X.; Lin, Z. A novel algorithm for land use and land cover classification using RADARSAT-2 polarimetric SAR data. Remote Sens. Environ. 2012, 118, 21–39. [CrossRef] Jagdhuber, T.; Stockamp, J.; Hajnsek, I.; Ludwig, R. Identification of soil freezing and thawing states using SAR polarimetry at C-Band. Remote Sens. 2014, 6, 2008–2023. [CrossRef] Baatz, M.; Schäpe, A. Object-oriented and multi-scale image analysis in semantic networks. In Proceeding of the 1999 International Symposium on Operationalization of Remote Sensing, Enschede, The Netherlands, 16–20 August 1999. Baatz, M.; Schäpe, A. Multiresolution Segmentation: An Optimization Approach for High Quality Multi-Scale Image Segmentation. Available online: http://www.ecognition.com/sites/default/files/technology.pdf (accessed on 12 January 2016). Willhauck, G. Comparison of object oriented classification techniques and standard image analysis for the use of change detection between SPOT multispectral satellite images and aerial photos. Int. Arch. Photogramm. Remote Sens. 2000, 33, 214–221. Rabus, B.; Eineder, M.; Roth, A.; Bamler, R. The shuttle radar topography mission—A new class of digital elevation models acquired by spaceborne radar. ISPRS J. Photogramm. Remote Sens. 2003, 57, 241–261. [CrossRef] Krieger, G.; Zink, M.; Bachmann, M.; Bräutigam, B.; Schulze, D.; Martone, M.; Rizzoli, P.; Steinbrecher, U.; Antony, J.W.; DeZan, F.; et al. TanDEM-X: A radar interferometer with two formation-flying satellites. Acta Astronautica 2013, 89, 83–98. [CrossRef] Cohen, J. A coefficient of agreement for nominal scales. Educ. Psychol. Meas. 1960, 20, 37–46. [CrossRef] Furuta, R.; Sawada, K. Case Study of Landslide Recognition using Dual/Quad Polarization data of ALOS/PALSAR. In Proceedings of the Asia-Pacific Conference on Synthetic Aperture Radar (APSAR), Tsukuba, Japan, 23–27 September 2013; pp. 481–484. Plank, S.; Singer, J.; Minet, C.; Thuro, K. Pre-survey suitability evaluation of the differential synthetic aperture radar interferometry method for landslide monitoring. Int. J. Remote Sens. 2012, 33, 6623–6637. [CrossRef] Dabbiru, L.; Aanstoos, J.V.; Hasan, K.; Younan, N.H.; Li, W. Landslide Detection on Earthen Levees with X-band and L-band Radar Data. In Proceedings of the Applied Imagery Pattern Recognition Workshop Sensing for Control and Augmentation 2013 IEEE (AIPR), Washington, DC, USA, 23–25 October 2013; p. 5. © 2016 by the authors; licensee MDPI, Basel, Switzerland. This article is an open access article distributed under the terms and conditions of the Creative Commons by Attribution (CC-BY) license (http://creativecommons.org/licenses/by/4.0/).