EG UK Theory and Practice of Computer Graphics (2012). Hamish Carr ... efficiency and dispatching simulation jobs across multiple machines on the network.
EG UK Theory and Practice of Computer Graphics (2012) Hamish Carr and Silvester Czanner (Editors)
Large Scale Pedestrian Multi-Simulation for a Decision Support Tool T. Karmakharm1 and P. Richmond1 1 Department
of Automatic Control & Systems Engineering, University of Sheffield , United Kingdom
Abstract Ability to simulate pedestrian behaviour on a large scale is essential in identifying potential dangers in public spaces during an evacuation. Multiple designs must be tested with varying parameters and run multiple times to achieve statistical significance due to the model’s stochastic nature. In this short paper, we describe our prototype decision support tool that enables concurrent simulation on GPU-enabled computers by merging them to increase efficiency and dispatching simulation jobs across multiple machines on the network. Preliminary results with our GPU-optimised model have been shown to run at faster than real-time simulation speeds. Categories and Subject Descriptors (according to ACM CCS): I.2.11 [ARTIFICIAL INTELLIGENCE]: Distributed Artificial Intelligence—Multiagent systems
1. Introduction Safety of occupants during an evacuation of large public spaces is paramount to their design. Simulation of large scale pedestrian behaviour is an essential tool in identifying potential dangers that may arise during an emergency. Multi-agent simulation, where an individual agent is an independent operational unit with memory (e.g. a single pedestrian), has been widely adopted in representing pedestrian crowds for both research and commercial applications [Leg12, Exo12]. Using this approach, a complex simulation that shows emergent behaviour can be created by defining few simple rules. The independent nature of agents allow these type of simulations to be parallelised by running on suitable hardware such as a computing cluster or the GPU (Graphics Processing Unit) [RR11, HCS06]. Multiple simulations must be run as it is necessary to test different building layouts with varying parameters (e.g. number of pedestrians). Multiple runs for a same configuration is also required in order to achieve statistical significance due the stochastic nature of the model. The resulting metrics from these simulations must be collected and visualised to assist users in judging the effectiveness of a design. Our prototype decision support tool for pedestrian simulation is able to achieve concurrent multi-simulation by utilising multiple GPU-enabled computers connected over a stanc The Eurographics Association 2012.
dard TCP/IP network. Our test model shows it is possible to simulate at faster than real-time speeds. It is built up on a generalised agent-based framework and behaviours in the model are generally applicable to many other scenarios. 2. Related Work The social forces model [PAB08] uses physics and sociopsychological forces to describe the movement of individuals and groups within a crowd. Contact and altruism force were individually introduced later for the context of evacuation. More recently, potential fields [PAB08] and reciprocal velocity obstacles [vdBLM08] have been used to ensure collision-free movement between pedestrians. Clusters of GPUs have been used in many fields such as fluid dynamics for solving incompressible flow [JTS10] and shallow water equations [BSA12], in siesmic modelling [ACC∗ 09] and have also applied to agent based simulation [APS10]. This is however, still a relatively new area to explore in crowd simulation and evacuation modelling. Furthermore, their use for an evacuation decision support tool have yet to be exploited. The FLAME GPU framework [RR11] is used as a basis for the simulator in this paper. It is an implementation of the Flexible Large-scale Agent Modelling Environment (FLAME) framework [HCS06] targeted at GPU computing.
T. Karmakharm & P. Richmond / Pedestrian Multi-Simulation
Client PC 1
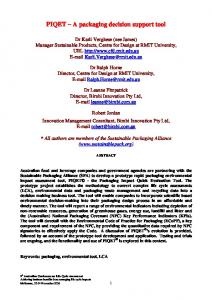
3. Multi-simulation decision support tool The tool is split in to four modules, each with a different responsibility.
Efficiency is increased by merging of multiple smaller simulations for running concurrently on individual GPUs. The four modules form a client-server relationship (Figure 1) and inter-application communication is performed over TCP/IP. The Simulator Manager handles all communications between the different modules. Simulation instances, containing all agent and parameter data required to start a single simulation, received from the Terminal are queued or dispatched to Simulators with available processing capacity. The metrics requested by Terminals also pass through the Simulator Manager. The Terminal is local to the user’s machine and allows for direct user interaction. It is responsible for the creation and loading of the simulation instances, dispatching a batch of them to be simulated and receiving sets of metrics from running and completed simulations. The Simulator contains the simulation framework and is responsible for the actual simulation of the model. An instance of a Simulator program is created per GPU that exists on the machine. This makes it modular and scalable across multiple machines. The Simulator uses a modified version of the CUDA based FLAME GPU framework [RR11] which enables simulation batching and collection of metrics. In order to save bandwidth and avoid overloading the network, all metrics data generated during a simulation run are saved locally on the machine and sent across the network when requested. As there may be multiple GPUs for each local computer, the Local Simulator Manager is responsible for detecting a machine’s configurations and launching instances of the Simulator accordingly. Large models involving ten of thousands of pedestrians are required in order to make effective use of the parallel processing capabilities of the GPU. Efficiency of smaller models is improved by merging multiple simulations together and running them simultaneously. This effectively increases the size of the simulation. When force vector fields are used for global navigation [KRR10], the grids from multiple simulations are spatially merged together. Continuous navigation methods such as graph-based navigation [PLT05] only requires transformation of the graph’s location coordinates. Pedestrians are assigned simulation identifiers in order to prevent interference in boundary cases. Real-time visualisation of multiple simulations is impractical for comparing their performances. Data obtained from these simulations must be aggregated and summarised to
Receive Simulation status and metrics Send simulation jobs
Simulation Queue
Host PC
• Terminal handles all user interaction. • Simulator Manager is a server for queueing and dispatching jobs. • Simulator performs simulation runs. • Local Simulator Manager manages multiple Simulators on the same. local machine
Terminal
Simulator Manager
Simulation status and metrics
PC Status, simulators status Init/Close Simulator
Schedule simulation job
Simulator
Simulator
GPU
GPU
Local Simulator Manager
Initialise Simulator
Simulator PC 1
Figure 1: The network diagram shows how the four modules of the decision support tool interact. The tool forms a client-server system with the Simulator Manager acting as the server.
users. One such method is the Fruin Level of Service (LOS) [Fru71] which measures density in terms of pedestrian comfort level. LOS output is similar to a density map and allows intuitive identification of dangerously congested areas. Because of simulation batching, metric results must be remapped in respect to each individual simulation. 4. Results & Discussion Two benchmarks were conducted to measure the performance of the tool. A multi-GPU performance benchmark was carried out to show the effect of running multiple Simulator instances on the same machine. The second benchmark measures the simulation speed relative to real time when the simulation is running a normal scenario. All benchmarking were performed on a 3.4GHz Intel Core i7 machine with 8GB of RAM using the dual-core Nvidia GTX590 GPU. Performance when running the Simulators on both available GPUs was measured. This is to evaluate the overheads in running multiple instance of the Simulator on the same machine. An environment was created and gradually filled with pedestrians. Each Simulator runs a batch of four simulations simultaneously. The simulations are then left to stabilise and the time step obtained is averaged over 100 simulation steps. First, the benchmark is run using one instance c The Eurographics Association 2012.
T. Karmakharm & P. Richmond / Pedestrian Multi-Simulation
of the Simulator (single GPU). It is then performed again using two instances of the Simulator (dual GPUs), effectively doubling the number of pedestrians simulated. The results show that the time for each simulation step increases in the dual GPU configuration on average of 2% across the range. For 5, 000, 50, 000 and 100, 000 pedestrian per GPU, it took an average time of 7.42, 16.99 and 39.14 ms for one time step respectively. The model used in the second benchmark represents an evacuation of a centrally located shopping mall after a dirty bomb has exploded. The simulation starts when the first pedestrian evacuates the mall. They try to take the nearest exit from the environment (Figure 2a). After a certain time, a cordon is established to prepare pedestrians for decontamination. When this happens, pedestrians starts to gather in a pre-designated location in the environment (Figure 2b). This scenario was created after consultation with Nottingham and Avon fire services and is representative of how the tool can be used in a real-time decision support situation. Local pedestrian dynamics are based on Helbing’s social forces model [PAB08] and global navigation and static obstacle avoidance are represented multiple force vector field maps [KRR10]. Variable time steps are used to prevent numerical instabilities from exponential repulsion forces. Use of dynamic time steps means the time needed to run a simulation can vary greatly according to the densities and forces experienced by pedestrians. The second benchmark measures the performance of the simulation taking this factor in to account. A maximum time step of 0.2 seconds was used, a total of 1200 pedestrian were generated and time for the cordon to be established was set to be 10 minutes in simulation time. The simulation ends at 45 minutes when the decontamination structure is established. The velocity threshold, a limit on how much pedestrians can change velocity in a single time step, was changed between each run. They take the values of 0.02, 0.05 and 0.1 as in the Figures 3a, 3b and 3c respectively. For the graphs in Figure 3, iteration count forms the x axis. The left y axis represents the real simulation speed calculated as the dynamic simulation time step (dt) in proportion of real time needed to process that iteration (rdt), values higher than 1 (represented by the red line) means that the simulation is running faster than realtime. The dt and rdt values are an average taken every 100 steps. Finally the right y axis (blue) shows the number of pedestrians currently in the environment. Until the cordon is established, it can be seen from the graphs that real simulation speed fluctuates wildly depending on the forces that pedestrians experience. Average speed then slightly decline as the behaviour changes and pedestrians stop trying to exit the environment and start to congregate at a designated gathering point. After all pedestrians have been generated and the simulation stabilises the speed can then be seen to increase rapidly due to the fact that pedestrians are able to spread out in to available spaces. c The Eurographics Association 2012.
a)
b)
c)
Figure 2: Screen captures of the running simulation. Image (a) shows pedestrians being generated and taking the shortest path out of the environment. The green lines are entrances and red lines exits. After a the cordons have been established, pedestrians congregate near a designated safe area (b). Image (c) shows the simulation when visualised with the 3D environment.
The velocity threshold has a drastic effect on the real simulation speed. Simulations with threshold value of 0.02, 0.05 and 0.1 took approximately 29, 13.8 and 7.2 minutes to complete respectively. This means a conservative threshold value of 0.05 would result in the the ability to perform simulations at 3 times the speed of real-time. 5. Conclusion This paper described the implementation of a prototype pedestrian multi-simulation tool intended for evacuation planning. The tool utilises multiple simulators connected through standard TCP/IP network in order to facilitate mul-
T. Karmakharm & P. Richmond / Pedestrian Multi-Simulation a)
25
Velocity treshold = 0.02
500 400
Cordon established
15
300
10
200
All pedestrians emitted
5
100
Pedestrian count
dt/rdt
20
0 0
b)
50000
100000
150000
200000
Iterations
250000
Velocity treshold = 0.05
500
20
dt/rdt
300 All pedestrians emitted
10
200
5
100
Pedestrian count
400 Cordon established
15
40000
60000
Iterations
80000
100000
120000
Velocity treshold = 0.1 20
500
Cordon established
15
400
All pedestrians emitted
300 10
200
5
100
0 0
10000
20000
30000
40000
Iterations
50000
[BSA12] B RODTKORB A. R., S ÆTRA M. L., A LTINAKAR M.: Efficient shallow water simulations on GPUs: Implementation, visualization, verification, and validation. Computers & Fluids 55 (Feb. 2012), 1–12. URL: http://dx.doi.org/10. 1016/j.compfluid.2011.10.012, doi:10.1016/j. compfluid.2011.10.012. 1
[Fru71] F RUIN J. J.: Pedestrian planning and design. Metropolitan Association of Urban Designers and Environmental Planners, 1971. URL: http://www.worldcat.org/oclc/ 216615. 2 Pedestrian count
dt/rdt
c)
20000
[APS10] A ABY B. G., P ERUMALLA K. S., S EAL S. K.: Efficient simulation of agent-based models on multi-GPU and multicore clusters. In Proceedings of the 3rd International ICST Conference on Simulation Tools and Techniques (ICST, Brussels, Belgium, Belgium, 2010), SIMUTools ’10, ICST (Institute for Computer Sciences, Social-Informatics and Telecommunications Engineering), pp. 1–10. URL: http://dx.doi. org/10.4108/ICST.SIMUTOOLS2010.8822, doi:10. 4108/ICST.SIMUTOOLS2010.8822. 1
[Exo12] E XODUS: Exodus Website [Last accessed Jan 2012], 2012. URL: http://fseg.gre.ac.uk/exodus/. 1
0 0
Time Migration on a GPU cluster. In High Performance Computing & Simulation, 2009. HPCS ’09. International Conference on (June 2009), IEEE, pp. 36–43. URL: http://dx. doi.org/10.1109/HPCSIM.2009.5192786, doi:10. 1109/HPCSIM.2009.5192786. 1
60000
Figure 3: The three graphs shows how the real simulation speed ( dt/rdt ) changes throughout a simulation in normal conditions. The value dt stands for the dynamic time step and the rdt stands for the amount of real time taken to process that step of the simulation. Real simulation speed values over 1 means it is running faster than real time. The blue line and right axis shows the number of pedestrians currently in the simulation.
tiple concurrent simulations. Smaller simulations are also batched in order to maximise efficiency. Feedback is provided through collected metrics. From preliminary results, the performance of simulation batching and running multiple simulator for each machine is promising. Testing on a machine equipped with larger numbers of GPUs will provide better indication of performance. A method to determine and rank effectiveness of a plan will be obtained by further investigation with our domain experts. References [ACC∗ 09] A BDELKHALEK R., C ALANDRA H., C OULAUD O., ROMAN J., L ATU G.: Fast seismic modeling and Reverse
[HCS06] H OLCOMBE M., C OAKLEY S., S MALLWOOD R.: A General Framework for agent-based modelling of complex systems. In Proceedings of the 2006 European Conference on Complex Systems (2006). 1 [JTS10] JACOBSEN D., T HIBAULT J. C., S ENOCAK I.: An MPICUDA Implementation for Massively Parallel Incompressible Flow Computations on Multi-GPU Clusters. In American Institute of Aeronautics and Astronautics (AIAA) 48th Aerospace Science Meeting Proceedings (2010). URL: http://www. gpucomputing.net/?q=node/576. 1 [KRR10] K ARMAKHARM T., R ICHMOND P., ROMANO D.: Agent-based Large Scale Simulation of Pedestrians With Adaptive Realistic Navigation Vector Fields. In Theory and Practice of Computer Graphics (TPCG) 2010 (2010), pp. 67–74. 2, 3 [Leg12] L EGION: Legion website [Last accessed Jan 2012]. URL: http://www.legion.com/. 1 [PAB08] P ELECHANO N., A LLBECK J. M., BADLER N. I.: Virtual Crowds: Methods, Simulation, and Control. Synthesis Lectures on Computer Graphics and Animation 3, 1 (Jan. 2008), 15–42. URL: http://dx.doi.org/10. 2200/S00123ED1V01Y200808CGR008, doi:10.2200/ S00123ED1V01Y200808CGR008. 1, 3 [PLT05] P ETTRE J., L AUMOND J., T HALMANN D.: A Navigation Graph for Real-Time Crowd Animation on Multilayered and Uneven Terrain. URL: http://vrlab.epfl.ch/ ~{}jpettre/publis/05vcrowdpettre.pdf. 2 [RR11] R ICHMOND P., ROMANO D.: Template-Driven AgentBased Modeling and Simulation with CUDA. In GPU Computing Gems Emerald Edition, Hwu W.-m. W., (Ed.), 1 ed., Applications of GPU Computing Series. Morgan Kaufmann, Feb. 2011, ch. 21, pp. 313–324. 1, 2 [vdBLM08] VAN DEN B ERG J., L IN M. C., M ANOCHA D.: Reciprocal Velocity Obstacles for Real-Time MultiAgent Navigation. In IEEE INTERNATIONAL CONFERENCE ON ROBOTICS AND AUTOMATION (2008), pp. 1928–1935. URL: http://citeseerx.ist.psu. edu/viewdoc/summary?doi=10.1.1.127.6140. 1 c The Eurographics Association 2012.