Large Scale Visualization on the Cray XT3 Using ParaView Kenneth Moreland, Sandia National Laboratories David Rogers, Sandia National Laboratories John Greenfield, Sandia National Laboratories Berk Geveci, Kitware, Inc. Patrick Marion, Kitware, Inc. Alexander Neundorf, Technical University of Kaiserslautern Kent Eschenberg, Pittsburgh Supercomputing Center May 8, 2008 ABSTRACT: Post-processing and visualization are key components to understanding any simulation. Porting ParaView, a scalable visualization tool, to the Cray XT3 allows our analysts to leverage the same supercomputer they use for simulation to perform post-processing. Visualization tools traditionally rely on a variety of rendering, scripting, and networking resources; the challenge of running ParaView on the Lightweight Kernel is to provide and use the visualization and post-processing features in the absence of many OS resources. We have successfully accomplished this at Sandia National Laboratories and the Pittsburgh Supercomputing Center. KEYWORDS: Cray XT3, parallel visualization, ParaView
1
Introduction
This approach of a co-located visualization cluster works well, and is used frequently today. However, the visualization cluster is generally built to a much smaller scale than the supercomputer. For the majority of simulations, this dichotomy of computer sizes is usually acceptable as visualization typically requires far less computation than the simulation, but “hero” sized simulations that push the supercomputer to its computational limits may produce output that exceeds the reasonable capabilities of a visualization cluster. Specialized visualization clusters may be unavailable for other reasons as well; budget constraints may not allow for a visualization cluster. Also, building these visualization clusters from commodity hardware and software may become problematic as they get ever larger. For these reasons, it is sometimes useful to utilize the supercomputer for visualization and postprocessing. It thus becomes necessary to run visual-
The past decade has seen much research on parallel and large-scale visualization systems. This work has yielded efficient visualization and rendering algorithms that work well in distributed-memory parallel environments [2, 9]. As visualization and simulation platforms continue to grow and change, so to do the challenges and bottlenecks. Although image rendering was once the limiting factor in visualization, rendering speed is now often a secondary concern. In fact, it is now common to perform interactive visualization on clusters without specialized rendering hardware. The new focus on visualization is in loading, managing, and processing data. One consequence of this is the practice of co-locating a visualization resource with the supercomputer for faster access to the simulation output [1, 3]. 1
ing out of the compute nodes on Red Storm. Ultimately, the ability to interactively control a visualization server on Red Storm, or most any other large Cray XT3, is of dubious value anyway as scheduling queues would require users to wait hours or days for the server job to start. Rather than force sockets on the Catamount operating system, we instead removed the necessity of sockets from ParaView. When running on the Cray XT3, ParaView uses a special parallel batch mode. This mode is roughly equivalent to the parallel server with the exception of making a socket connection to a client. Instead, the scripting capability of the client is brought over to the parallel server as shown in Figure 2. Process 0 runs the script interpreter, and a script issues commands to the parallel job in the same way that a client would.
ization software such as ParaView [7] on supercomputers such as the Cray XT3. Doing so introduces many challenges with cross compilation and with removing dependencies on features stripped from the lightweight kernel. This paper describes the approach and implementation of porting and running ParaView on the Cray XT3 supercomputer.
2
Approach
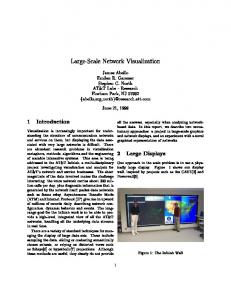
ParaView is designed to allow a user to interactively control a remote visualization server [3]. This is achieved by running a serial client application on the user’s desktop and a parallel MPI server on a remote visualization cluster. The client connects to the root process of the server as shown in Figure 1. The user manipulates the visualization via the GUI or through scripting on the client. The client transparently sends commands to the server and retrieves results from the server via the socket.
Client
Socket
Scripted “Server” Scripting
Server
0
0
GUI Scripting
Figure 2: Parallel visualization scripting within ParaView. Process 0 runs the script interpreter in lieu of getting commands from a client. Figure 1: Typical remote parallel interaction within ParaView. The client controls the server by making a socket connection to process 0 of the server.
Scripts, by their nature, are typically more difficult to use than a GUI. State files can be used to make script building easier. A user simply needs to load in a representative data set into an interactive ParaView visualization off of the supercomputer, establish a visualization, and save a state file. The same state file is easily loaded by a ParaView script running in parallel batch mode.
Implementing this approach directly on a Cray XT3 is problematic as the Catamount operating system does not support sockets and has no socket library. The port of the VisIt application, which has a similar architecture to ParaView, gets around this problem by implementing a subset of the socket library through Portals, a low level communication layer on the Cray XT3 [8]. We chose not implement this approach because it is not feasible for Red Storm, Sandia National Laboratories’ Cray XT3. The Red Storm maintainers are loath to allow an application performing socket-like communication for fear of the potential network traffic overhead involved. Furthermore, for security reasons we prefer to limit the communications going into or com-
3
Implementation
Even after removing ParaView’s dependence on sockets and several other client-specific features, such as GUI controls, there are still several pragmatic issues when compiling for the Cray XT3. This section addresses these issues. 2
3.1
Python
able. Mesa 3D has the added ability to render images without an X Window System, which Catamount clearly does not have. The Mesa 3D build system comes with its own cross-compilation support. Our port to Catamount involved simply providing correct compilers and compile flags. We have contributed back the configuration for Catamount builds to the Mesa 3D project, and the configuration is now part of the distribution since the 7.0.2 release.
ParaView uses Python for its scripting needs. Python was chosen because of its popularity amongst many of the analysts running simulations. Fortunately, Python was already ported to the Cray XT3 in an earlier project [4]. The porting of Python to the Cray XT3 lightweight kernel, involved overcoming three difficulties: the lack of dynamic library support, issues with cross compiling and problems with system environment variable settings. Python is designed to load libraries and modules dynamically, but the lightweight kernel does not allow this. This problem was solved by compiling the libraries and modules statically and replacing Python’s dynamic loader with a simple static loader. Cross-compiling was enabled by providing wrapper functions to the build system to return information for the destination machine rather than the build machine. Finally, the system environment variables which are not set correctly on the Cray XT3 were undefined in the Python configuration files so that the correct Python defaults would be used instead. Since this initial work, we have simplified the process of compiling Python by using the CMake configuration tool [6]. We started by converting the Python build system to CMake including all configure checks. Once the build was converted to CMake, providing the mechanism for static builds, selecting the desired Python libraries to include in the link, and cross compiling was greatly simplified. More details on the cross-compiling capabilities of CMake are given in Section 3.3. The process of compiling the Python interpreter for use in ParaView on the Cray XT3 is as follows. Rather than build a Python executable, only a static Python library with the necessary modules is built. During the build of ParaView, more Python modules specific for ParaView scripting are built. The ParaView build system automatically creates header that defines a function to register all of the custom modules with the python interpreter. This generated header and function is used in any source file where the Python interpreter is created and initialized.
3.2
3.3
Cross Compiling ParaView
ParaView uses the CMake configuration tool [6] to simplify porting ParaView across multiple platforms. CMake simplifies many of the configuration tasks of the ParaView build and automates the build process, which includes code and document generation in addition to compiling source code. Most of the time, CMake’s system introspection requires very little effort on the user’s part. However, when performing cross-compilation, which is necessary for compiling for the Catamount compute nodes, the user must help point CMake to the correct compilers, libraries, and configurations. CMake simplifies cross compilation with “toolchain files.” A toolchain file is a simple CMake script file that provides information about the target system that cannot be determined automatically: the executable/library type, the location of the appropriate compilers, the location of libraries that are appropriate for the target system, and how CMake should behave when performing system inspection. Once the toolchain file establishes the target environment, the CMake configuration files for ParaView will provide information about the target build system rather than the build platform. Even with the configuration provided by a toolchain file, some system inspection cannot be easily performed while cross compiling. (This is true for any cross-compiling system.) In particular, many builds, ParaView included, require information from “try run” queries in which CMake attempts to compile, run, and inspect the output of simple programs. It is generally not feasible to run programs from a cross-compiler during the build process, so this type of system inspection will fail. Rather than try this type of inspection during cross compilation, CMake will create user-editable variables to specify the system configuration. The ParaView source comes with configuration files that provide values appropriate for Catamount.
OpenGL
ParaView requires the OpenGL library for its image rendering. OpenGL is often implemented with special graphics hardware, but a special softwareonly implementation called Mesa 3D is also avail3
In addition to system inspection, the ParaView build also creates several intermediate programs that the build then runs to automatically generate documentation or more code. One example is the generation of “wrapper” classes that enable class creation and method invocation from within Python scripts. Clearly these intermediate programs cannot be run if they are compiled with a cross-compiler. To get around this issue, we simply build two versions of ParaView: a “native” build and a “Catamount” build. The native build is built first and without a cross-compiler. It builds executables that can run on the computer performing the build. The Catamount build uses the cross-compiler, but also uses the intermediate programs generated by the native build rather than its own. Projects usually require ParaView to be installed on platforms in addition to the Cray XT3, and often the platform used for cross compiling is one of the additionally required installs. In this case, building both the “native” and “Catamount” versions of ParaView is not an extra requirement. When the “native” build of ParaView is not really required, there is a special make target, pvHostTools, that builds only the intermediate programs required for the cross compilation. Using this target dramatically reduces the time required to compile.
4
Table 1: Scaling tests of a simple visualization script. processes 3 4 8 16 128 256 512 nodes 3 4 4 4 128 128 256 sec/frame 172 136 85 65 5.8 5.8 2.8 startup (sec) 175 187 145 115 79 46 201
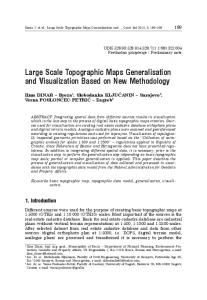
end, he is using the Enzo cosmological simulation code (http://lca.ucsd.edu/software/enzo/) performing density calculations on a grid of 20483 points. Each timestep, containing 32 GB of data, is stored in 4,096 files. One effective visualization of the density is a simple cut through the data at one timestep. We prepared a ParaView batch script that made cuts at 2,048 Z-planes and stored each in a file. The files were later combined into a high quality MPEG-2 video of less than 43 MB. Figure 3 shows a frame from the animation.
Usage
At the Pittsburgh Supercomputing Center, ParaView is being considered for those users who may wish to take a look at large datasets before deciding to transfer the data to other locations. Facilities at the Pittsburgh Supercomputing Center such as the Bigben Cray XT3 are utilized by institutions around the country. However, these same institutions do not have direct access to visualization resource at the Pittsburgh Supercomputing Center. Because sending large quantities of data across the country can be time consuming, it can be more efficient to run a visualization directly on Bigben where the data already resides. The visualization results are comparatively small and can be analyzed to determine if further analysis is needed or if transferring the data is justified. As an example, consider the recent studies of star formation by Alexei Kritsuk of the University of California, San Diego [5]. Kritsuk is studying the hydrodynamic turbulence in molecular clouds to better understand star formation. To this
Figure 3: One frame of a video showing density within a molecular cloud. Using 256 processes on 128 nodes the XT3 requires three and a half hours to complete this script. By changing the number cuts we can separate the startup time (mostly the time to read the files) from the time to calculate and write one cut. The startup time is 46 seconds and the time per frame is 5.8 seconds. To get an understanding to how well the system will scale, we instrumented the same script using different combinations of nodes and processes. These results are summarized in Table 1. The runs using less than 128 nodes were run on a smaller Linux cluster because the problem size was too large for an 4
equivalent number of nodes on the XT3. Despite the heterogeneity of the tests, the results show a remarkably consistent scaling. A plot of the time it takes to generate a frame of the animation with respect to the number of processes being used is shown in Figure 4. For the most part, the system scales well. There is some variance in the measurements that are probably caused mostly by an inconsistent process to node ratio. Resource limitations in memory, network, or file bandwidth could account for the reduced efficiency when allocating more processes per node.
1000 Measured Values
Startup Time (sec)
Ideal Scaling
100
10 1
10
100
1000
Processes
Figure 5: Time to startup the visualization (including reading data off of disk).
1000
Time per Frame (sec)
Measured Values Ideal Scaling
This work was done in part at Sandia National Laboratories. Sandia is a multiprogram laboratory operated by Sandia Corporation, a Lockheed Martin Company, for the United States Department of Energy’s National Nuclear Security Administration under contract DE-AC04-94AL85000.
100
10
1 1
10
100
1000
Processes
References
Figure 4: Time to generate a frame of the visualization animation with respect to the number of processes.
[1] Sean Ahern. Petascale visual data analysis in a production computing environment. In Journal of Physics: Conference Series (Proceedings of SciDAC 2007), volume 78, June 2007.
A plot of the time it takes to initialize the animation with respect to the job size is shown in Figure 5. The startup time does not scale as well as the per-frame time. This is most likely due to the fact that the startup will included most of the serial processing of the job, which, by Amdahl’s law, limits scaling. The startup also includes to time to load the data off of the disk, which we do not expect to scale as well as computation. There is an anomaly in the measurement for 256 processes. We are not sure what is causing this. We have not yet repeated these tests for a sufficient number of cases to consider this more than a preliminary result. For example, the current distribution of the 4,096 files across the XT3’s file system may be far from optimum and may explain the unexpected drop in efficiency for reading the files using 512 processes.
[2] James Ahrens, Kristi Brislawn, Ken Martin, Berk Geveci, C. Charles Law, and Michael E. Papka. Large-scale data visualization using parallel data streaming. IEEE Computer Graphics and Applications, 21(4):34–41, July/August 2001. [3] Andy Cedilnik, Berk Geveci, Kenneth Moreland, James Ahrens, and Jean Farve. Remote large data visualization in the ParaView framework. In Eurographics Parallel Graphics and Visualization 2006, pages 163–170, May 2006. [4] John Greenfield and Daniel Sands. Python based applications on red storm: Porting a python based application to the lightweight kernel. In Cray User’s Group 2007, May 2007.
Acknowledgments
[5] Alexei G. Kritsuk, Paolo Padoan, Rick Wagner, and Michael L. Norman. Scaling laws and intermittency in highly compressible turbulence. In AIP Conference Proceedings 932, 2007.
A special thanks to Alexei Kritsuk for access to his data and all around support of our work. 5
[6] Ken Martin and Bill Hoffman. Mastering CMake. Kitware, Inc., fourth edition, 2007. ISBN-13: 978-1-930934-20-7.
Berk Geveci Kitware, Inc. 28 Corporate Dr. Clifton Park, New York 12065, USA
[email protected] Berk Geveci received his Ph.D. in Mechanical Engineering in 2000 and is currently a project lead at Kitware Inc. His research interests include large scale parallel computing, computational dynamics, finite elements and visualization algorithms.
[7] Amy Henderson Squillacote. The ParaView Guide. Kitware, Inc., ParaView 3 edition, 2007. ISBN-13: 978-1-930934-21-4. [8] Kevin Thomas. Porting of VisIt parallel visualization tool to the Cray XT3 system. In Cray User’s Group 2007, May 2007.
Patrick Marion Kitware, Inc. 28 Corporate Dr. Clifton Park, New York 12065, USA
[email protected] Patrick Marion is a research engineer at Kitware. He received his B.S. in Computer Science from Rensselaer Polytechnic Institute in 2008. His research interests include visualization and rigid body physical simulation.
[9] Brian Wylie, Constantine Pavlakos, Vasily Lewis, and Kenneth Moreland. Scalable rendering on PC clusters. IEEE Computer Graphics and Applications, 21(4):62–70, July/August 2001.
About the Authors
Alexander Neundorf Technical University of Kaiserslautern Department for Real-Time Systems 67663 Kaiserslautern, Germany
[email protected] Alexander Neundorf is currently a graduate student at the Technical University of Kaiserslautern with his focus on adaptive real-time systems. In 2007 he worked at Kitware where he added crosscompilation support to CMake. He is also maintaining the CMake-based build system of KDE.
Kenneth Moreland Sandia National Laboratories P.O. Box 5800 MS 1323 Albuquerque, NM 87185-1323, USA
[email protected] Kenneth Moreland received his Ph.D. in Computer Science in 2004 from the University of New Mexico in 2004 and is currently a Senior Member of Technical Staff at Sandia National Laboratories. His research interests include large-scale parallel visualization systems and algorithms.
Kent Eschenberg Pittsburgh Supercomputing Center 300 S. Craig St. Pittsburgh, PA 15213, USA
[email protected] Kent Eschenberg received his Ph.D. in Acoustics from Penn State University in 1989 and is a scientific visualization specialist at the Pittsburgh Supercomputing Center.
David Rogers Sandia National Laboratories P.O. Box 5800 MS 1323 Albuquerque, NM 87185-1323, USA
[email protected] David Rogers is a manager at Sandia National Laboratories. Having just acquired his position, he is still in the process of his brain scrubbing and is still growing out a pointy hairdo. John Greenfield Sandia National Laboratories P.O. Box 5800 MS 0822 Albuquerque, NM 87185-0822, USA
[email protected] John Greenfield, Ph.D. is a post-processing and visualization support software engineer for ASAP under contract to Sandia National Laboratories in Albuquerque. 6