Journal of Statistical Physics, Vol. 107, Nos. 1/2, April 2002 (© 2002)
Lattice Boltzmann Simulation of Reactive Microflows over Catalytic Surfaces S. Succi, 1 , 2 G. Smith, 3 and E. Kaxiras 3 Received October 23, 2000; accepted June 11, 2001 We investigate the effects of geometrical micro-irregularities on the conversion efficiency of reactive flows in narrow channels of millimetric size with heterogeneous catalysis. Three-dimensional simulations, based upon a LatticeBoltzmann-Lax–Wendroff code, indicate that micro-corrugations may have an appreciable effect on the effective reaction efficiency of the device. Once extrapolated to macroscopic scales, these effects can result in a sizeable increase of the overall reaction efficiency. KEY WORDS: Catalysis; numerical simulation; Lattice Boltzmann.
1. INTRODUCTION Modern modelling science is confronted with phenomena of increasing complexity involving the simultaneous interaction of multiple spatio-temporal scales. The quantitative description of such complex phenomena commands sophisticated multidisciplinary approaches. (1) A typical example of such complex multiscale phenomena is the dynamics of reactive flows, a subject of wide interdisciplinary concern, with several applications in macro and micro-engineering, material science, biology, environmental and life sciences alike. The complexity of reactive flow dynamics is parametrized by three dimensionless quantities: the Reynolds number Re, the Damkohler number Da, and the Pe´clet number Pe. High Reynolds numbers are associated with turbulence, namely loss of coherence of the flow field in both
1
Istituto di Applicazioni Calcolo, CNR, viale Policlinico 137, 00161 Roma, Italy; e-mail:
[email protected] 2 Visiting Scholar, Lyman Laboratory of Physics, Harvard University. 3 Lyman Laboratory of Physics, Harvard University, Cambridge, Massachusetts 02138. 343 0022-4715/02/0400-0343/0 © 2002 Plenum Publishing Corporation
344
Succi et al.
space and time. High Damkohler numbers imply that chemistry is much faster than hydrodynamics, so that reactions are always in chemical equilibrium and take place in tiny regions (thin flames, reaction pockets) of evolving flow configurations. The opposite regime (‘‘well-stirred’’ reactor) characterizes situations where the chemistry is slow and always takes place at local mechanical equilibrium. The Pe´clet number, defined as UH Pe= D where U is a typical macroscopic flow speed, H a typical macroscopic length and D is the mass diffusivity of the generic transported species, plays a prominent role. High Péclet numbers imply that the transported species stick tightly to the fluid carrier (in the limit Pe Q . the tracer field is ‘‘frozen-in’’ within flow streamlines). Conversely, low-Pe´clet regimes imply fast diffusion of the tracer across the flow field, efficient mixing hence higher reaction efficiency. Navigation across the three dimensional Re–Da–Pe parameter space meets with an enormous variety of chemico-physical behaviours, ranging from turbulent combustion to hydrodynamic dispersion and many others. (2) The picture gets further complicated when geometry is taken into account, since boundary conditions select the spatio-temporal structures sustaining the non-linear interaction between the various fields. In this work we shall deal with moderate-Reynolds, reacting flows with heterogeneus catalysis. In particular, we wish to gain insight into the role of geometric micro-irregularities on the effective rate of absorption of tracer species (pollutant hereafter) at catalytic boundaries. Given the fact that almost all chemical reactions of industrial and biological relevance are catalytic, the subject of catalytic absorption is a a theme of broad interest, with applications in biology, physics, chemistry and environmental sciences. (3) This paper is organized as follows: In Section 2 we present the basic aspects of the mathematical model, while in Section 3 details of the computational model are discussed. In Section 4 we present some analytical considerations to estimate the effects of geometric irregularities on the catalytic efficiency. In Section 5 we present numerical results referring to a fast-reacting micro-channel flow with a single perpendicular barrier on the bottom wall. In Section 6 results pertaining to a slow-reacting flow with a trapezoidal corrugation are presented and compared with previous numerical and experimental data. Finally, some considerations on the need to assist numerical simulations with scaling theories to predict the efficiency of macroscopic devices are offered.
Lattice Boltzmann Simulation of Reactive Microflows
345
2. MATHEMATICAL MODEL OF REACTIVE MICROFLOW DYNAMICS We shall deal with a quasi-incompressible, isothermal flow with soluted species which are transported (advect and diffuse) by the flow and, upon reaching solid walls, undergo catalytic chemical reactions. The basic equations of fluid motion are: “t r+div ruF=0
(1)
“t ruF+div ruFuF=−NP+div[m(NuF+(NuF )) +l div uF ] T
(2)
where r is the flow density, uF the flow speed, P=rT the fluid pressure, T the temperature and m, l are the shear and bulk dynamic viscosities respectively (for the present case of quasi-incompressible flow with div uF ’ 0 the latter can safely be ignored). Finally, uFuF denotes the dyadic tensor ua ub , a, b=x, y, z. Multispecies transport with chemical reactions is described by a set of generalized continuity-diffusion equations for Ns species: ˙ s d(xF − xF w ) “t Cs +div Cs uF=div[Ds CT N(Cs /CT )]+W s=1, Ns
(3)
where Cs denotes the mass density of the generic sth species, Ds its mass ˙ s is a diffusivity, CT =; s Cs the total mass of transported species and W chemical reaction term which is non-zero along the reactive surface described by the coordinate xF w . Note that the diffusive term on the righthand-side of Eq. (3) secures mass conservation upon summation over all species because CT =; s Cs (we assume Ds =D for all species). According to Fick’s law, the outgoing (bulk-to-wall) diffusive mass flow is given by: Cw =F u+ C|wall − D“+ C|wall dS
(4)
S
where + denotes the normal-to-wall coordinate and S is the area of the exchange surface between the fluid and the solid wall. Upon contact with solid walls, the transported species react according to the following empirical rate equation (the species index being removed for simplicity): w ˙ — dC =Cw − Kc C w W dt V
(5)
346
Succi et al.
where V is the reaction volume. The wall-flux is taken in the simple linear form: Cw =Kw (C g − C w) V
(6)
where Kw is the wall to/from fluid mass transfer rate and Kc is the chemical reaction rate dictating species consumption once a molecule is absorbed by the wall. The subscripts w and g mean ‘‘wall’’ (solid) and ‘‘gas’’ in a contact with the wall respectively. The above rate equation serves as a dynamic boundary condition for the species transport equations, so that each boundary cell can be regarded as a microscopic chemical reactor sustained by the mass inflow from the fluid. In the absence of surface chemical reactions the species concentration in the solid wall would pile up in time, up to the point where no outflow would occur, a condition met when C g=C w. Chemistry sets a time scale for this pile-up and fixes the steadystate mass exchange rate. At steady state we obtain: Kw C w= Cg Kw +Kc
(7)
Cg C w= yw +yc
(8)
hence
where yw =1/Kw and yc =1/Kc . These expressions show that finite-rate chemistry (Kc > 0) ensures a non-zero steady wall outflux of pollutant. At steady state, this mass flow to the catalytic wall comes into balance with chemical reactions, thus fixing a relation between the value of the wall concentration and its normal-to-wall gradient (we set uF + |w =0): − D“z C g|w =d Cg /(yc +yw ) where d is the thickness (volume/area) of the reactive cell. This is a mixed Neumann-Dirichlet boundary condition which identifies the free-slip length of the tracer as: ls =D(yw +yc )/d This expression shows that in the limit of infinitely fast chemistry and wall transfer, the free-slip length tends to zero so that the cross-flow distribution of the tracer develops a vanishingly thin near-wall boundary layer (‘‘reaction sheet’’). In actual practice, the fluid cells in contact with reactive boundary cells receive a diffusive-advective mass flux from the bulk flow [Eq. (4)] and transfer to the wall a contribution given by Eq. (6).
Lattice Boltzmann Simulation of Reactive Microflows
347
3. THE COMPUTATIONAL METHOD The flow field is solved by a lattice Boltzmann method (4–7) while the multi-species transport and chemical reactions are handled with a variant of the Lax–Wendroff method. (8) A few details are given in the following. 3.1. Lattice Boltzmann Equation The simplest, and most popular form of lattice Boltzmann equation (Lattice BGK, for Bhatnagar, Gross, Krook), (7) reads as follows: fi (xF +cFi , t+1) − fi (xF , t)=−w[fi − f ei ](xF , t)
(9)
where fi (xF , t) — f(xF , Fv=cFi , t) is a discrete distribution function moving along the discrete speed cFi . The set of discrete speeds must be chosen in such a way as to guarantee mass, momentum and energy conservation, as well as rotational invariance. Only a limited subclass of lattices qualifies. In the sequel, we shall refer to the nineteen-speed lattice consisting of zerospeed, speed one c=1 (nearest neighbor connection), and speed c=`2, (next-nearest-neighbor connection). This makes a total of 19 discrete speeds, 6 neighbors, 12 nearest-neighbors and 1 rest particle (c=0). The right hand side of (9) represents the relaxation to a local equilibrium f ei in a time lapse of the order of w −1. This local equilibrium is usually taken in the form of a quadratic expansion of a local Maxwellian:
5
uF · cF uFuF · (cFi cFi − c 2s I) f ei =rwi 1+ 2 i + cs 2c 4s
6
(10)
where wi is a set of weights, wi =4/9, 1/9, 1/36 for particles of speed c=0, 1, `2 respectively in the 19-speed lattice considered here. Finally, cs is the lattice sound speed defined by the relation ; w cF cF c 2s I= i i i i d
(11)
where d is the space dimensionality and I denotes the identity tensor. For the 19-speed lattice considered here c 2s =1/3. The fluid density and speed are obtained by (weighted) sums over the set of discrete speeds: r=C fi , i
ruF=C fi cFi i
where we have assumed a unit mass for the fluid particles.
(12)
348
Succi et al.
LBE was historically derived as the one-body kinetic equation resulting from many-body Lattice Gas Automata via the following conceptual steps are: • Neglect of many-body correlations • Small Knudsen number expansion around local equilibria • Small Mach number expansion around global uniform equilibria We remind here that the Knudsen number is the ratio of particle mean-free path versus the smallest hydrodynamic length, whereas the Mach number is the ratio of fluid to sound speed. This analysis shows that the LBE fluid behaves like a quasi-incompressible fluid with kinematic viscosity: n=c 2s (1/w − 1/2) Owing to its flexibility toward grossly irregular geometries, the LBE has proved a very competitive tool for the numerical studies of hydrodynamic flows in grossly irregular geometries since its earliest days. (9)
3.2. Modified Lax–Wendroff Scheme for Species Transport Numerical schemes to integrate passive/active scalar equations within the LBE formalism come in a variety of choices. The simplest formulations are based on the introduction of an additional set of discrete populations, which evolve according to a simple LBE such that the population density corresponds to the desired scalar concentration C. These schemes are seamlessly coupled to LBE for the fluid flow, but very expensive in computer storage since any additional species requires at least 2d discrete populations in spatial dimension d. The other extreme is to couple LB to any generic finite-difference/volume/element solver. This does not waste any computer storage, but may require some interfacing effort with LBE if the finite-difference grid does not coincide with the LBE lattice. A convenient choice in this respect is provided by a variant of the Lax–Wendroff scheme recently developed precisely to address multicomponent fluid transport (and reaction) within a LBE-like language. Here we present a summary of the basic ideas behind this LBE-Lax Wendroff scheme, directing the reader fond of full details to the original reference. (8) The first observation is that since species transport equation is linear in the species concentration, we can solve it on a simple 2d-neighbors cubic lattice. Within this approach, each species is associated with a species density Cs , which splits into 2d+1 separate contributions along the lattice links plus
Lattice Boltzmann Simulation of Reactive Microflows
349
the lattice site itself. To the purpose of a compact notation, it proves expedient to denote the neighborhood of a given node by two indices l=−1, 0, 1 and a=x, y, z, so that xF la =xF +laˆ denotes the neighbor along the direction ± a, l=0 characterizing the node itself. Note that the transport lattice is simply the subset of the LBE lattice restricted to zero-speed and speed-one particles. Prior to discretization, a few analytic manipulations of the transport equation are in order. In particular, we recast (3) in the following standard advection-diffusion form “t Cs +div Cs uF −s =Ds DCs
(13)
where the effective speed uF −s is the sum of the fluid speed and an ‘‘apparent’’ speed due to inhomogeneities of the total concentration: uF −s =uF+uF˜ s uF˜ s =Ds
(14)
NCT CT
(15)
A simple Lax-scheme for Eq. (13) is known to introduce a high numerical viscosity, Dnum, a =2d1 (1 − du −2 a ) in lattice units. To remove this undesirable effect we add a counter-diffusive term − Dnum D to the transport equation, whose consequences shall be commented shortly. After all these preparations, we can finally write the transport operator in d dimensions in full splendor (still lattice units and with species index suppressed for simplicity): C(xF , t)=C C pla (t − 1) C(xF la , t − 1)+qla (t − 1) l
(16)
a
where:
1
2
1 1 pla (t − 1)= +lu −a +D −a , 2 d D −a =D −
l= ± 1
1 (1 − du −2 a ) 2d
p0 =−2 C D −a
(17) (18) (19)
a
l qla (t − 1)=− u −a C u −b C lC(xF la ) 8 b]a l
(20)
350
Succi et al.
with u −a is evaluated at xF la , t − 1. The transition coefficients pla represent the contribution to the concentration at xF at time t from the neighbor xF la at t − 1. The sources qla collect instead the contribution of the next-to-nearest neighbors, which are due exclusively to second order cross-derivatives of the velocity-dependent component of the effective diffusivity D −a . It is readily checked that transition probabilities and sources obey the following sum rules: C pla =1
(21)
la
C qla =0
(22)
la
This rearrangement proves fairly convenient from both computational and analytical purposes. In fact, it can be be shown by linear stability analysis that the resulting Lax–Wendroff scheme becomes hyper-diffusive (diffusion effects are shifted to fourth-order) without loosing stability (see Appendix of ref. 8). This is a very useful property for reactive flow simulations. The same analysis, as well as numerical experiments, also show that the scheme is affected by phase-errors which tend to develop spurious wiggles (Gibbs phenomena) if the fluid moves ‘‘too fast,’’ meaning by this a cell-Péclet − number in excess of about ten: uD > 10 in lattice units. This qualifies the present Lax–Wendroff scheme as a good candidate for (relatively) slow reactive flows, such as those addressed in the present work. 3.3. Multiple Time Scales The simulation of a reactive flow system is to all effects a multi-physics problem involving five distinct time scales: 1. Fluid Advection and Diffusion yA =L/U, yn =H 2/n
(23)
where L, H are the length and height of the fluid domain. 2. Species Diffusion, Wall-Mass Transfer and Reaction yD =H 2/D, yw =K w−1 , yc =K
−1 c
(24)
Lattice Boltzmann Simulation of Reactive Microflows
351
As discussed in the introduction, these time scales define the major dimensionless parameters Re=UH/n — yA /yn ,
(25)
Pe=UH/D — yD /yA ,
(26)
Dac =yf /yc ,
Daw =yf /yw
(27)
where f stands for fluid advection and/or diffusion. To acknowledge the simultaneous presence of multiple time scales, a sub-cycled time-stepper is adopted. This is organized as follows. The code ticks with the hopping time of the fluid populations from a lattice site to its neighbors dt=1. Under all circumstances dt is much smaller than both diffusive and advective fluid scales in order to provide a faithful description of fluid flow and transport. Whenever dt exceeds the chemical/wall transfer time-scales, fractional time-stepping, i.e., sub-cycling of the corresponding process is performed. This means that the chemical and wall transfer operators are performed dt/yc , dt/yw times respectively at each fluid cycle. As it will be appreciated shortly, since the flow solver ticks at the sound speed, the present microflow simulations proceed in very short time steps, of the order of tens of nanoseconds. This means that the present scheme can in principle be coupled to mesoscopic methods, such as kinetic Monte Carlo, affording a more fundamental description of the fluid-wall interactions. 4. CATALYTIC EFFICIENCY: QUALITATIVE ANALYSIS Ideally, we would like to synthesize a universal functional dependence of the catalytic efficiency as a function of the relevant dimensionless numbers and geometrical design parameters: g=F(Re, Da, Pe; g¯ )
(28)
where g¯ represents a vector of geometric parameters characterizing the boundary shape. The question is to assess the sensitivity of g to g¯ and possibly find an optimal solution (maximum g) within the given parameter space. Mathematically, this is a complex non-linear functional optimization problem. (10) We find it convenient to start from a simple—and yet representative—baseline geometry as an ‘‘unperturbed’’ zeroth order approximation, which is easily accessible either analytically or numerically. Perturbations to this baseline situation can then be parametrized as ‘‘topological excitations’’ on top of the geometrical ‘‘ground state.’’ In the present study, the unperturbed geometry is a straight channel of size L along the flow direction (x)
352
Succi et al.
and H × H across it (y, z). Perturbations are then defined as microcorrugations in the bottom wall of the form z=h(x, y), h — 0 being the smooth-wall unperturbed case. An important design parameter is the device efficiency, defined as the amount of pollutant burned per unit mass injected: F − Fout g= in Fin
(29)
F(x)=F [uC](x, y, z) dy dz
(30)
where
is the longitudinal mass flow of the pollutant at section x. The in-out longitudinal flow deficit is of course equal to the amount of pollutant absorbed at the catalytic wall, namely the normal-to-wall mass flow rate: F C=F Fc(x, y, z) · dS
(31)
S
where the flux consists of both advective and diffusive components: Fc=uFC − DNC
(32)
and the integral runs over the entire absorbing surface S. The goal of the optimization problem is to maximize C at a given Fin and S, or, conversely, minimize S at a given Fin . As it is apparent from the above expressions, this means maximizing complex configuration-dependent quantities, such as the wall distribution of the pollutant and its normal-to-wall gradient. For future purposes, we find it convenient to recast the catalytic efficiency as g=1 − T, where T is the channel transmittance, defined as: T — Fout /Fin
(33)
basically the probability for a tracer molecule injected at the inlet to exit the channel without being absorbed by the wall. Roughly speaking, this is controlled by the ratio of advection to diffusion time scales. More precisely, the escape rate is high if the cross-channel distance walked by a tracer molecule in a transit time yA is much smaller than the channel cross-length H/2. Mathematically: DyA ° H 2/4, which is: Pe ± 4 L/H
(34)
Lattice Boltzmann Simulation of Reactive Microflows
353
The above inequality (in reverse) shows that in order to achieve high conversion efficiencies, the longitudinal aspect ratio L/H of the device has to scale linearly with the Pe´clet number.
4.1. Efficiency of a Smooth Channel: Analytic and Scaling Considerations For a smooth channel, the steady state solution of the longitudinal concentration field away from the inlet boundary factors into the product of three independent one-dimensional functions: C(x, y, z)=X(x) Y(y) Z(z). Replacing this ansatz into the steady-state version of Eq. (3) we obtain: X(x)=X0 e −x/l Y(y)=Y0 sin(y/ly )
(35)
Z(z)=Z0 sin(z/lz ) with the longitudinal and cross-flow absorption lengths related via: l=(l 2y +l 2z )
¯ U D
(36)
¯ is the average flow speed where U
;
¯ (x)=C u(x, y, z) C(x, y, z) C C(x, y, z) U y, z
(37)
y, z
Note that because we stipulate that only the top and bottom walls host catalytic reactions, the profile along the span-wise coordinate y remains almost flat, so that we can define a transversal cross-flow diffusion length l+ ’ ly . To determine the cross-flow diffusion length l+ we impose that along all fluid cells in a contact with the wall, the diffusive flux is exactly equal to fluid-to-wall outflow, namely: C Cg 2 = l 2+ y Nz
(38)
where y the effective absorption/reaction time scale, 1 1 1 ’ + y yD (yc +yw )
(39)
354
Succi et al.
and the factor 2/Nz is the fraction of reactive cells along any given crosssection x=const. of the channel. The form factor Cg /C is readily obtained by the third of Eqs. (35) which yields Cg 4 cos(H/2ł+ ) C
(40)
Combining this equation with Eq. (38) we obtain a non-linear algebraic equation for l+ : Dy N l 2 cos(1/2l)= 2 z H 2
(41)
where we have set l — l+ /H. For each set of parameters this equation can be easily solved numerically to deliver l+ , hence l via the Eq. (36). Given the exponential dependence along the stream-wise coordinate x, the efficiency can then be estimated as: g0 4 1 − e −L/l
(42)
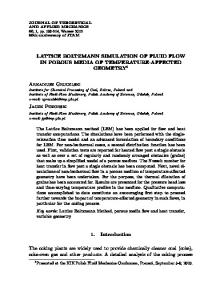
Note that in the low absorption limit L ° l, the above relation reduces to g0 ’ L/l, meaning that halving, say, the absorption length implies same efficiency with a twice shorter catalyzer. In the opposite highabsorption limit, L ± l, the relative pay-off becomes increasingly less significant. 4.2. Efficiency of a Corrugated Channel: Analytical Estimates Having discussed the baseline geometry, we now turn to the case of a ‘‘perturbed’’ geometry. Let us begin by considering a single barrier of height h on the bottom wall (see Fig. 1). The reference situation is a smooth channel at infinite-Damkohler (infinitely fast chemistry) with g0 =1 − e −L/l. We seek perturbative corrections in the smallness parameter g — h/H representing the the coupling-strength to geometrical perturbations and, more practically, a measure of the relative amount of reactive extra-surface contributed by the corrugation. The unperturbed wall-flux is C0 ’ 2D
Ch LH h
(43)
Lattice Boltzmann Simulation of Reactive Microflows
355
Fig. 1. Typical geometrical set up with a single barrier.
where Ch /h is an estimate of the normal-to-wall diffusive gradient. The geometrical gain due to extra-active wall surface is C1 4 Ch uh hH
(44)
uh 4 4U0 (g − g 2)
(45)
where
is the average longitudinal flow speed in front of the barrier. The shadowed region of size w in the wake of the obstacle yields an (advective) contribution C2 ’ a D
Ch wH h
(46)
where the coefficient a is a measure of the absorption activity in the wake region. Three distinctive cases can be identified: • a < 1: The wake absorption is smaller than with unperturbed flow (geometrical shielding prevails) • a=1: The wake absorption is exactly the same as for unperturbed flow • a > 1: The wake absorption is higher than with unperturbed flow (back-flowing micro-vortices can hit the rear side of the barrier).
356
Succi et al.
Combining these expressions we obtain the following expression: dg C1 +C2 − C2 (h=0) h = ’ Re (Sc+K(a − 1)) g0 C0 2L h
(47)
where Sc=n/D is the Schmidt number (fluid viscosity/tracer mass diffusivity) and the wake length can be estimated as w=K Reh with K ’ 0.1. The above expression shows a perturbative (quadratic) correction in h over the unperturbed (smooth channel situation). However, since the effective absorption in the shielded region is affected by non-linear phenomena, the factor a may itself exhibit a non-perturbative dependence on h. 5. APPLICATION: FAST-REACTIVE FLOW OVER A MICRO-BARRIER The previous computational scheme has been applied to a fluid flowing in a millimeter-sized box of size 2 × 1 × 1 millimeters along the x, y, z directions with a single barrier of height h on the bottom wall (see Fig. 1). The fluid flow carries a bulk-passive pollutant, say an exhaust gas flow, which is absorbed at the channel walls where it reacts due to heterogeneus catalysis. The flow is forced with a constant volumetric force which mimics the effects of a pressure gradient. The exhaust gas is continuously injected at the inlet, x=0, with a flat profile across the channel and, upon diffusing across the flow, it reaches solid walls where it gets trapped and subsequently reacts according to a first order catalytic reaction: C+A Q P
(48)
where A denotes an active catalyzer and P the reaction products. The initial conditions are:
u(x, y, z)=U0 ,
C(x, y, z)=1,
x=1
(49)
C(x, y, z)=0,
elsewhere
(50)
r(x, y, z)=1
(51)
v(x, y, z)=w(x, y, z)=0
(52)
The pollutant is continuously injected at the inlet and released at the open outlet, while flow periodicity is imposed at the inlet/outlet boundaries. On the upper and lower walls, the flow speed is forced to vanish, whereas the fluid-wall mass exchange is modeled via a mass transfer rate equation of the form previously discussed. We explore the effects of a sub-millimeter barrier of height h on the bottom wall. The idea is to assess the effects of
Lattice Boltzmann Simulation of Reactive Microflows
357
the barrier height, h on the chemical efficiency. Upon using a 80 × 40 × 40 computational grid, we obtain a lattice with dx=dy=dz=0.0025 (25 microns), and dt=cs dx/Vs ’ 50 · 10 −9 (50 nanoseconds). Here we have assumed a sound speed Vs =300 m/s and used the fact that the sound speed is cs =1/`3 in lattice units. Our simulations refer to the following values (in lattice units): U0 ’ 0.1 − 0.2, D=0.1, n=0.01, KC =KW =0.1. This corresponds to a diffusion-limited scenario: yc =yw =10 < yA ’ 800 < yD =16000 < yn =160000
(53)
or, in terms of dimensionless numbers: Pe ’ 40,
Re ’ 400,
DaA =80,
DaD =1600
(54)
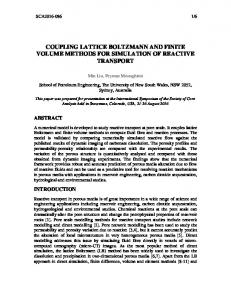
We consider a single barrier of height h placed in the middle of the bottom wall at x=L/2, z=0, with: h/H=0.05, 0.1, 0.2. For the sake of comparison, the case of a smooth wall (h=0) is also included. The typical simulation time-span is t=32000 time-steps, namely about 1.6 milliseconds in physical time, corresponding to two mass diffusion times across the channel. The physico-chemical parameters given above are close to catalytic converter operation, apart from the chemical time scales which have been taken according to a fast-chemistry assumption. With the above parameters we may estimate the reference efficiency ¯ ’ 0.1, and y=20, we obtain for the case of smooth channel flow. With U l ’ 200, hence g0 ’ 0.33. A typical two-dimensional cut of the flow pattern and pollutant spatial distribution in the section y=H/2 is shown in Figs. 2 and 3, which refer to the case h=8 (h/H=0.1). An extended (if feeble) recirculation pattern is well visible past the barrier. Also, enhanced concentration gradients in correspondence of the tip of the barrier are recognized from Fig. 3. A more quantitative information is conveyed by Fig. 4, where the integrated concentration of the pollutant: C(x)=C C(x, y, z)
(55)
y, z
is presented for the cases h=0, 2, 4, 8. The main highlight is a substantial reduction of the pollutant concentration with increasing barrier height. This is qualitatively very plausible since the bulk flow is richer in pollutant and consequently the tip of the barrier ‘‘eats up’’ more pollutant than the lower region. In order to gain a semi-quantitative estimate of the chemical efficiency, we measure the pollutant longitudinal mass flow: F(x)=C [Cu](x, y, z) y, z
(56)
358
Succi et al. u(x,z) at y=L/2: t=32000 40 35 30 25 U=0.15
20
Z
15 10 5
U=-0.01
0 0
10
20
30
40
50
60
70
80
X
Fig. 2. Streamwise velocity isocontours with a single barrier of heigth h=8 at t=32000.
The values at x=1 and x=L define the efficiency according to equation (29) (to minimize finite-size effects actual measurements are taken at x=2 and x=70). Leaving aside the initial portion of the channel, our numerical data are well fitted by an exponential with absorption length l=200, in a good agreement with the theoretical estimate l 4 200 obtained by solving Eqs. (36) and (38). The corresponding results are shown in Table I, where subscript A refers to the analytical expression (47) with a=1. These results are in a reasonable agreement with the analytical estimate (47) taken at a=1 (same absorption as the smooth channel). However, for h=8 the assumption a=1 overestimates the actual efficiency, indicating
Fig. 3. Concentration isocontours with a single barrier of heigth h=8 at t=32000.
Lattice Boltzmann Simulation of Reactive Microflows
359
Longitudinal pollutant concentration: single barrier 1800
1600
1600*exp(-x/200)
C(X)
1400
h=0 1200 h=2 h=4 1000 h=8 800
600 10
20
30 40 50 Streamwise coordinate X
60
70
Fig. 4. Integrated concentration C(x) of the pollutant with a single barrier of height h=0, 2, 4, 8 after 32000 steps. The dashed-dotted line represents an exponential fit with the theoretical estimate l=200.
Table I. Single Barrier at x=40: The Effect of Barrier Heigth on the Catalytic Efficiency. Second Column: Barrier Height versus Channel Height. Third Column: Conversion Efficiency, Numerical Data. Fourth Column, Left: Relative Perturbation Due to the Barrier, Numerical Results. Fourth Column, Right: Relative Perturbation Due to the Barrier, Analytical Estimate Run
h/H
g
R00 R02 R04 R08
0 1/20 1/10 2/10
0.295 0.301 0.312 0.360
dg g
,
dgA gA
0.00 0.02,0.025 0.06,0.10 0.22,0.40
360
Succi et al.
that the shielded region absorbs less pollutant than in the smooth-channel scenario. Indeed, inspection of the transversal concentration profiles (Fig. 5) along the chord x=3L/4, y=H/2 reveals a neat depletion of the pollutant in the wake region due to the shielding effect of the barrier. Besides this efficiency-degrading effect, the barrier also promotes a potentially beneficial flow recirculation, which is well visible in Fig. 6 showing the time evolution of the stream-wise velocity u(z) in the mid-line x=3L/4, y=H/2 at t=3200 and t=32000. This figure reveals that recirculating back-flow only sets in for h=8. However, these recirculation effects are feeble (the intensity of the recirculating flow is less than ten percent of the bulk flow) and depletion remains the dominant mechanism. In fact for h=8 the measured local Pe´clet number is of the order 0.01 · 8/0.01=0.8, seemingly too small to promote appreciable micro-turbulent effects. We conclude that, for blunt obstacles such as perpendicular barriers, shielding effects are likely to outdo the benefits of recirculation. It Transverse pollutant concentration at x=3L/4,y=H/2: 32000 steps 40
35
30
Z
25
20
15
10
h=8
h=4
h=0
5
0 0.1
0.2
0.3
0.4
0.5
0.6
0.7
0.8
0.9
1
1.1
1.2
Concentration C(Z)
Fig. 5. Transverse pollutant concentration C(z) at x=3L/4 and y=H/2. Single barrier of varying height, h=0, 4, 8 at t=32000.
Lattice Boltzmann Simulation of Reactive Microflows
361
Streamwise speed U(Z) at x=3L/4,y=L/2 40
35
30
Z
25
20 h=8 15 h=4
h=8
10
h=0 h=4
5
h=0
0 -0.01
0.04
0.09
0.14
0.19
0.24
U(Z)
Fig. 6. Time evolution of the transversal streamwise speed u(z) at x=3L/4 and y=L/2 at t=3200 and t=32000. Single barrier of varying height h=0, 4, 8. The two curves for each value of h refer to t=3200 and t=32000.
should also be noticed that raising the barrier height has an appreciable impact on the bulk flow as well, which displays some twenty percent reduction due to mechanical losses. 6. TRAPEZOIDAL CORRUGATION As a second application, we investigate a trapezoidal corrugation, a case of practical relevance for automotive catalytic applications. The reference situation is a fluid flow consisting of an exhaust gas at at P=1 Atm and T=600°K, carrying carbon mono-oxide CO as a main pollutant. The exhaust gas is continuously injected at the inlet, x=0, and upon reaching solid walls, carbon mono-oxide reacts with oxygen molecules according to the catalytic reaction: 2CO+O2 =2CO2
(57)
362
Succi et al.
The initial conditions in the bulk flow are: rCO =0, ux =const.,
rgas =const.
(58)
uy =uz =0
(59)
We consider a 3 × 1 × 1 millimeter channel, traversed by a flow at a speed of the order of 10 meters/second. Carbon mono-oxide is continuously injected at the inlet and released at the open outlet. In the present work, we explore the effects of a 0.1 millimeter-high trapezoidal microcorrugation on the bottom wall with height h and 45° degrees side angles (see Sketch 1). Our simulations refer to the following values (in lattice units): u ’ 0.1, D=0.1, n=0.01, KC =KW =0.001, corresponding to a slow-chemistry scenario (in lattice units): yA ’ 600, Re ’ 200,
yC =yW =1000 < yD =4000
Pe ’ 20,
DaA ’ 0.6,
DaD ’ 4
(60) (61)
The physico-chemical parameters given above are close to the working conditions of a catalytic converter, except for the chemical time scale, which, in order to reduce the simulation time-span is placed in the 100 microseconds range, about an order of magnitude faster than ordinary values.
Sketch 1. Template of a trapezoidal corrugation with h=4 in a x–z cross section. Each letter represents a lattice site. F: fluid, B: boundary. (The vertical direction is stretched out.)
Lattice Boltzmann Simulation of Reactive Microflows
363
Streamwise flow speed U(x,z) 20 18 16 14 12 U=0.1
10
Z
8 6 4
U=0.045
2
U=0.005 0
10
20
30
40
0 50
60
X
Fig. 7. Streamwise velocity field in the mid-span cross-section, y=10 at t=12000.
Let us now come to the actual results. A typical two-dimensional cut of the flow pattern is shown in Fig. 7, from which a high-shear flow in the near-obstacle region is again apparent. The corresponding two-dimensional CO pattern is shown in Fig. 8. The integrated concentration along the channel is shown in Fig. 9. Much of the observed depletion is purely geometrical (the channel restriction) and the truly dynamical effect is best appreciated by inspecting the longitudinal longitudinal outflow F(x). Comparison with the smooth-channel scenario shows a very tiny but yet visible effect (see Fig. 10). Inspection of the actual numbers (taken 20 sites away from the outlet in order to minimize boundary effects) yield T0 =0.953 (smooth channel) and T=0.946, namely g0 =0.047 versus C(x,z) at y=L/2,t=12000 20 18 16 14 12 10 8
Z
1.23 1.2 1.17 1.14 1.11 1.08
6 4 2 0 0
10
20
30
40
50
60
X
Fig. 8. Isocontours of the CO concentration in the mid-span section y=10 at t=12000.
364
Succi et al. Longitudinal CO concentration 500 'Trapezoidal' 'Smooth' 450 400 350
C(x)
300 250 200 150 100 50 0 0
10
20
30
40
50
60
X
Fig. 9. Integrated longitudinal CO mass concentration at t=12000. Solid line: corrugated wall, crosses: smooth wall.
g=0.054. This corresponds to dg/g0 ’ 0.15, which is significantly higher than the purely geometrical increase of the reactive surface: 2h(`2 − 1)/2L ’ 0.053 This is not surprising since owing to the relatively smooth shape of the obstacle, the flow ‘‘sticks’’ closely to the trapezoidal corrugation with only a minor detachment in the wake region, so that it can benefit of enhanced cross-flow concentration gradients. The conclusion is that relatively smooth obstacles are likely to provide a better catalytic efficiency.
6.1. Up-Scaling to Macroscopic Devices It is important to realize that even tiny improvements on the microscopic scale can result in pretty sizeable cumulative effects on the macroscopic scale of real devices, say 10 centimeters in the case of catalytic converters. Let us
Lattice Boltzmann Simulation of Reactive Microflows
365
19 'Trapezoidal' 'Smooth'
Longitudinal CO mass flux
18.5
18
17.5
17
16.5
16 10
20
30 X
40
50
60
Fig. 10. Longitudinal CO mass flow rate at t=12000.
assume for simplicity that the efficiency of an array of N serial microchannels can be estimated simply as gN =1 − T N
(62)
On a scale of L=10 centimeters (N=50) our simulation yields g0 =0.973 and g=0.984, much higher than experimental observation. This is due to the artificially faster chemistry used to save computing time. Realistic (and time consuming) simulations with ten times slower chemistry yield R0 =0.977, R=0.972, which on a scale of 10 centimeters, correspond to g0 ’ 0.687 and g ’ 0.758, in a good agreement with experimental evidence and previous two-dimensional simulation work. (11) It is clear that extrapolation to macroscopic scales based on the equation (62) must be taken very cautiously. In fact, a tight synergy between computer simulation and analytical scaling theories is called for in order to make robust predictions at the macroscopic scale.
366
Succi et al.
7. CONCLUSIONS This work presents an exploratory study of the complex hydro-chemical phenomena which control the effective reactivity of catalytic devices of millimetric and centimetric size. These simulations shed light on the competition between various non-perturbative effects, such as shielding and micro-recirculation in the wake of geometrical obstrusions, which are hardly amenable to analytical treatment. It is hoped that the flexibility of the present computer tool, as combined with semi-analytical scaling theories, can be of significant help in developing semi-quantitative intuition about the subtle and fascinating interplay between geometry, chemistry, diffusion and hydrodynamics in the design of chemical traps, catalytic converters and other related devices. (12) ACKNOWLEDGMENTS Work performed under NATO Grant PST.CLG.976357. S.S. acknowledges a scholarship and kind hospitality from the Physics Department at Harvard University. REFERENCES 1. F. Abraham, J. Broughton, N. Bernstein, and E. Kaxiras, Comp. in Phys. 12:538 (1998). 2. E. Oran and J. Boris, Numerical Simulation of Reactive Flows (Elsevier Science, New York, 1987). 3. G. Ertl and H. J. Freund, Catalysis and surface science, Phys. Today 52:32 (1999). 4. G. Mc Namara and G. Zanetti, Phys. Rev. Lett. 61:2332 (1988). 5. F. Higuera, S. Succi, and R. Benzi, Europhys. Lett. 9:345 (1989). 6. R. Benzi, S. Succi, and M. Vergassola, Phys. Rep. 222:145 (1992). 7. Y. Qian, D. d’Humieres, and P. Lallemand, Europhys. Lett. 17:149 (1989). 8. S. Succi, G. Bella, A. De Maio, H. Chen, K. Molvig, and C. Teixeira, J. Comp. Phys. 152:493 (1999). 9. A. Cancelliere, E. Chang, E. Foti, D. Rothman, and S. Succi, Phys. Fluids Lett. 2:2085 (1990). 10. F. Stepanek, M. Kubicek, M. Marek, and P. Adler, Chem. Eng. Sci. 54:1493 (1999). 11. A. Bergmann, R. Bruck, and C. Kruse, Society of Automotive Engineers (SAE) technical paper SAE 971027, Proceedings of the 1997 International SAE Congress, Detroit, USA, February 1997. 12. S. Succi, O. Filippova, G. Smith, and E. Kaxiras, Comput. Sci. Eng. 3(6):26 (2001).