Feb 22, 2013 - Development of a LC-MS/MS-Method for the. Determination of Colistin and Colistin methanesulfonate and. Application for Plasma-Samples of ...
Development of a LC-MS/MS-Method for the Determination of Colistin and Colistin methanesulfonate and Application for Plasma-Samples of Critically Ill patients Matthias Weber1, Thomas Muders2, Frank Dahmen2, Christian Putensen2
MVZ LaborDiagnostik, Karlsruhe, Am Hubengut 3, D-76149 Karlsruhe, Germany 2 Klinik und Poliklinik für Anästhesiologie und Operative Intensivmedizin, University Clinic Bonn, Sigmund-Freud-Str. 25, D-53105 Bonn, Germany 1
Introduction
Matrix-Effects
Results in Critically ill patients
The emerging of multidrug-resistant (MDR) strains of Pseudomonas aeruginosa and Acinetobacter baumanii has initiated a comeback of formerly known second line antibiotics. One of them is colistin. Colistin was isolated from Bacillus polymyxa subsp. colistinus and consists of a cyclic heptapeptide and a tripeptide side chain acetylated at the N-terminus by a fatty acid moiety. (Andrea L Kwa, 2008) Commercially available colistin, however, consists of a mixture of several chemically related subcomponents, including the two major components colistin A and colistin B. Owing to the (nephro-, neuro-, oto-) toxicity of colistin, for systemic use it has been derivatized yielding colistin methanesulfonate (CMS). Following parenteral application the pharmacologically inactive pro-drug CMS is hydrolyzed stepwise to active colistin. (Phillip J. Bergen, 2006) Only few pharmacokinetic data are available because at the time of approval, the analytical methods did not allow thorough and reliable pharmacokinetic testing. Recently case reports and clinical experience showed a poor predictability of the pharmacokinetic situation under different conditions, for instance under renal replacement therapy. Thus for therapeutic drug monitory of the colistin therapy a LC-MS/MS-Method was developed and applied for the monitoring of patients infected with 4MRGN Acinetobacter baumanii.
Matrix effects have been assessed by adding colistin to human plasma before and after protein precipitation. As reference a matrix free dilution of colistin in the same concentration was prepared in 0.1% TFA and 10% methanol in water and treated the same way as the plasma samples have been. Human plasma without colistin was precipitated and after precipitation spiked with colistin and polymyxin of the same concentration to assess the matrix suppression.
Five patients have been already under treatment with CMS when the tdm was started, with two of them having a colistin levels below the recommended minimum concentration of 2 µg/ml. It was found, that the measured colistin levels in general showed a great variability depending on the actual treatment situation with a mean value of 2.85 ± 1.59 µg/ml. There were no significant differences between trough and peak levels of colistin measured. (Fig. 5)
The post-column infusion experiment was performed using the motor syringe to infuse a solution of 1 µg/ml colistin and 1 µg/ml polymyxin B with a flow of 10 µl/min via a Tmanifold into the solvents flow. A drug free plasma sample has been worked up without addition of internal standard and injected and the influence on the signal has been evaluated.
Due to the short half-life of CMS the trough levels are low compared to the peak levels. (Fig. 6). Trough levels of up to 10 µg/ml have been measured.
Carryover For the auto sampler type used here, with the use of 10% methanol and 0.02% TFA in water as rinse solution it was possible to reduce the carryover below 1% which was acceptable.
16 2 y = -1.1501x + 47711 1 14
Nine critically ill patients some of them under renal replacement therapy (CVVHD, intermittent HD) infected with 4MRGN-Acinetobacter baumanii treated with CMS and for dose adjustment therapeutic drug monitoring on a regular basis was done. In the beginning of the study, patients are included which already received CMS-infusions (3x2 million units) before drug monitoring was started. Dose adjustments have been made according to the measured plasma levels of colistin. The samples normally are derived pre-administration and 30 minutes after administration of the CMS infusion. In 6 patients after stopping of the colistin treatment course, samples are derived until colistin was not detectable anymore to estimate the elimination half life. Blood samples were immediately refrigerated and centrifuged. The plasma was frozen and kept at -20 °C until analysis. After analysis it was kept at -80 °C for long term storage. In total 788 plasma samples have been analyzed.
For quantification the main constituents colistin E1 (colistin A) and colistin E2 (colistin B) have been used. Stock solutions have been prepared in distilled water yielding a concentration of 5 mg/ml and in aliquots kept frozen at -80 °C. Matrix-free dilutions have been made in 10% methanol and 0.1% TFA in water which effectively prevents any adsorption of colistin to the polypropylene surface of reaction vessels or wellplates.
12
0 -1 -2
y = -0.4346x + 18027
-3 10
[µg/ml]
Since colistin consists of a mixture of different similar substances and pure subcomponents are not commercially available, standardization only can refer to a “reference preparation”. For the standardization of the measurements Ph. Eur. Reference Standard of Colistin Sulfate, Batches 3.3 and 4 were used. The respective composition based on HPLC is provided by EDQM (Example Tab. 1). The calibrator content was derived from the provided composition data corrected by the sulfate moiety.
ln(C colistin)
Patient Samples
Materials and Methods Standards
-4 Colistin
8
CMS
6
4
2
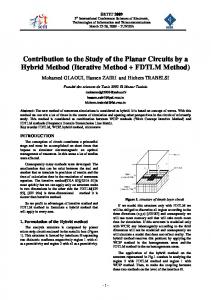
Pharmacokinetics The elimination half-life of colistin has been estimated by a first order kinetic. Because of the short half-life of CMS based on our retrospective data it was not possible to estimate it.
Calibrators with a concentration of 0.25, 2.5 and 25 µg/ml were prepared in blank plasma pool. The final contents of free colistin base of the respective subcomponents were calculated considering the composition data provided.
Colistin AcNTFA1_130222185334
As CMS is derived from colistin it has a complex composition of several different components as well. The commercially available CMS-preparations all contain about 80% colistin A and 20% colistin B. The CMS-reference preparation from EDQM was used for monitoring and control purpose. It was solved in distilled water and in aliquots kept frozen at -80 °C.
2/22/2013 6:53:34 PM
d:\routine\...\rawfiles\matrix08_059 Post-Column-Infusion
Colistin_ TFA AcN 50%
NH2 OH
95
H3C
90
O
75
TIC F: + c ESI SRM ms2 602.390 [100.915-100.925] MS Matrix08_53 NL: 5.92E3 TIC F: + c ESI SRM ms2 578.500 [100.865-100.875, 728.695-728.705] MS Matrix08_53
85
O
NH
HO
80
NH2
NH CH3 NH O
NH
O
NL: 4.71E3
70
TIC F: + c ESI SRM ms2 602.390 [100.915-100.925] MS matrix08_059
O
NH
65
201.69
NH
O
NL: 5.96E3
O
55
NH
H2N
N H
50
O 585.60
H2N
199.03
O
TIC F: + c ESI SRM ms2 585.400 [100.895-100.905, 728.695-728.705] MS matrix08_059
60
NH
H2N
60
TIC F: + c ESI SRM ms2 585.400 [100.895-100.905, 728.695-728.705] MS Matrix08_53
75
NH
70
Relative Abundance
NL: 4.34E3
NL: 5.37E3
O
45
D:\Routine\Medikamente\Colistin_1\Colistin_1.meth
90
CH3 H3C
80
Fig. 3. Patient course, example, Insert: ln-plot showing 2 compartment-elimination
95
NH
O 85
0
RT: 0.00 - 3.50 SM: 3B 100
Colistin AcNTFA1_130222185334 #1439-1465 RT: 8.12-8.41 AV: 27 NL: 5.79E4 F: + c ESI Full ms2 585.392 [10.000-1170.285] 100.92 100 240.89
65
As internal standard the structurally related polymyxin B (Sigma) was used. Stock solutions of 1 mg/ml in methanol with 0.1% trifluorocacetic acid (TFA) have been prepared. It was stored at -20 °C.
In 6 patients we have been able to gain elimination data for colistin and calculated halflifes of 19.7 ± 3 h. However in 3 patients a two-compartment model seems better to describe the elimination of colistin with half-lifes of 38, 52 and 87 h. (Fig. 3)
CH3
H3C
55
NL: 6.07E3
50
H3C
TIC F: + c ESI SRM ms2 578.500 [100.865-100.875, 728.695-728.705] MS matrix08_059
45
CH3
40
40 35
35 576.67 30
30
301.99
25
25 327.01
567.85
20
0.3153 0.2338 0.0183 0.0226 0.0254
85.76 73.32
5
156.95 183.68
912.14
535.61
397.18
485.41
729.85
384.21
126.87
55.98
15
628.75
284.05
693.43 648.77
811.87 776.83
929.89
10
829.94 5
893.90 931.59 969.58
1070.82
0
1131.66 0
50
100
150
200
250
300
350
400
450
500
550
600 m/z
650
700
750
800
850
900
950
1000
1050
1100
1150
0.0
Fig. 1. Colistin B, fragment ion spectrum Tab. 1. Composition Colistin Batch 4
Liquid Chromatography Mass Spectrometry LC-MS/MS system: Dionex UltiMate 3000 XRS autosampler, pump, RS Column compartment.
XRS quaternary UHPLC
Columns used: Aeris Peptide 1.7 µm XB-C18 2.1 x 100 mm and 2.6 µm XB-C18 2.1 x 250 mm (Phenomenex), 40 °C. Mobile phases: Gradient starting with 19% lcms-grade acetonitrile (Baker) and 0.05% TFA (Sigma) in water (Milli-Q) to 40% within 1.6 minutes at a flow rate of 500 µl / min. Mass spectrometer: TSQ-Vantage triple quad mass spectrometer (Thermo, San Jose), HESI-source, positive electrospray ionization mode, settings: ionization voltage 3500 V, vaporizer temperature 500 °C, sheath gas flow 40 (arb), auxiliary gas flow 15 (arb), capillary temperature 200 °C and declustering voltage 10 V. For multiple reaction monitoring (MRM) argon was used as collision gas at a pressure of 1.1 10-3 Torr. Doubly charged parent ions of colistins and polymyxin B are used for fragmentation and the product ions and collision energies have been optimized for best intensities.
Sample Preparation Due to the instability of CMS in biological matrices (see below) the sample preparation for determination of the free colistin completely was done on ice and the reagents have been cooled prior to use. 50 µl of plasma samples have been precipitated with 200 µl of ice cold isopropanol containing 0.5 µg/ml polymyxin B as internal standard and 0.02% TFA. After 10 minutes at -20 °C, centrifuging 5 minutes with 20000 g at 4 °C, 100 µl of the supernatant was diluted with 400 µl of the appropriate solvent (water or 30% DMSO in water respectively) and put into the auto sampler at 4 °C. Concerning the determination of colistin in the presences of CMS in the sample it was found, that hydrolysis of CMS in the worked up samples take place even at 5 °C in the autosampler. To stabilize the CMS we found, that dimethyl sulfoxide (DMSO) as polar aprotic solvent is able to decrease the hydrolysis rate in a concentration dependent manner.
CMS-Hydrolysis To quantify the CMS content, CMS and all partly sulfomethylated intermediates have to be hydrolyzed resulting in colistin A and B respectively. The CMS concentration was then calculated by subtracting the free colistin concentration from the total colistin concentration and multiplication by a factor derived from the comparison with CMS reference preparations. Hydrolysis: To 50 µl plasma 10 µl sulfuric acid (1M) and 10 µl 1% TFA were added, left at room temperature for 30 minutes. After neutralization with 10 µl of sodium hydroxide (1M) precipitation and extraction was performed as described above. After centrifugation 100 µl of the supernatant was diluted with water and left at room temperature to complete hydrolysis for another 30 minutes. Then the sample was put into the autosampler and measured.
Sample Stability To assess the stability of CMS in the primary sample 9 ml of blood anticoagulated with EDTA from a healthy volunteer was spiked with 100 µl of freshly prepared aqueous CMS solution (8 mg/ml). Stability at RT and 4 °C was compared over 7.5 hours.
Validation and Quality Control Calibration standards have been prepared by spiking human plasma with colistin stock solutions to obtain concentrations in the rage of 0.008 to 6.5 µg/ml colistin A and 0.006 to 4.826 µg/ml for colistin B. The concentrations reflect for each decade a series of 6 equidistant samples, each level determined in triplicate. QC samples for colistin: human plasma spiked with colistin to gain a theoretical target value of 0.312 / 3.124 µg/ml colistin A and 0.237 / 2.37 µg/ml colistin B respectively. For monitoring of the sample workup, stability of CMS during colistin determination and hydrolysis process respectively QC samples with 2 and 20 µg/ml CMS sodium have been prepared. Because even for the CMS reference mixture obtained from EDQM no data of the composition are provided we decided not to use CMS for calibration purpose. Carryover was monitored by measuring appropriate blank samples.
Homogeneity of variances, all levels Linearity (Mandel), all levels CV of the procedure R2 LOD Standard deviation, ng/ml LOD Calibration curve, ng/ml LOQ Calibration curve, ng/ml Matrix effect Extraction recovery Intra-Assay low CV% Intra-Assay high CV% Inter-Assay low CV% Inter-Assay high CV% Trueness low % Trueness high %
0.2
0.4
0.6
0.8
1.0
1.2
1.4
1.6
1.8 Time (min)
2.0
2.2
2.4
2.6
2.8
3.0
3.2
3.4
C 25
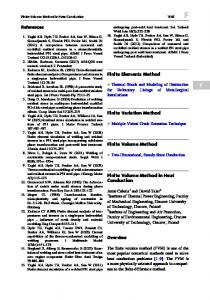
Fig. 4. CMS-Hydrolysis rate vs. DMSO-content
RT: 0.00 - 3.50 SM: 3B
Colistin A
Colistin B
NL: 2.17E4 TIC F: + c ESI SRM ms2 578.500 [100.865-100.875, 728.695-728.705] MS 140611-08
0.90
100 90 80 70
passed
passed
60 50 40 30
passed 7.18% 0.9910 4.7 12.2 38.7 96.5% 95.0% 6.7 2.56 10.4 3.76 -1.93 -8.23
passed 5.81% 0.9960 3.0 7.9 25.4 97.7% 90.0% 5.3 5.89 8.46 6.77 2.01 -4.33
Tab 2. Validation results
20 10 0.11 0.16
0 100
0.30 0.37
0.55 0.59
0.75 0.81
1.15
1.28 1.36 1.40
1.55 1.60 1.72
1.82 1.88 1.97 2.06
2.21 2.27
2.47 2.54 2.60
2.70 2.75 2.83
2.99 3.08 3.17 3.24 3.31
3.42 NL: 2.24E4 TIC F: + c ESI SRM ms2 585.400 [100.895-100.905, 728.695-728.705] MS 140611-08
1.24
90 80 70 60 50 40 30 20 10
1.10 0.11
0 100
0.20
0.31 0.37
0.51
0.66 0.72 0.83 0.90
1.48 1.56
1.01
1.67
1.82
1.98
2.07 2.15 2.21
2.37 2.42 2.49
2.64 2.70
2.82
2.91
3.04
3.18
3.31
3.45 NL: 2.47E3 TIC F: + c ESI SRM ms2 602.390 [100.915-100.925] MS 140611-08
1.44
90 80 70 60 50 40 30 20 1.26
10 0.10
0 0.0
0.21 0.2
0.30
0.43
0.52
0.4
Colistin A Colistin B Polymyxin B (IS)
0.67 0.71 0.83 0.89 0.95 1.01 0.6
0.8
1.0
1.58 1.63 1.70 1.82
1.15 1.2
1.4
1.6
1.8 Time (min)
MRM-Transition [m/z] 578.5→100.9 585.4→100.9 602.4→100.9
1.99 2.0
2.12 2.21
2.36
2.2
2.4
CE (Volt) 33 33 34
2.50
2.60 2.64 2.73 2.83 2.91 2.6
2.8
3.02 3.08 3.0
Dwell time (ms) 50 50 50
3.25 3.29 3.37 3.41 3.2
3.4
RT (min) 1.24 0.90 1.44
Results Method Sample Stability
Fig. 2 a-c. Post column infusion, chromatogram, MRM conditions
90 80
The rate of in vitro-conversion of CMS to colistin was estimated to be 0.6 % per hour at room temperature. At 4 °C CMS is stable and no significant artificial increase of the colistin level had to be expected. However, depending on individual hydrolytic activity the rate we expect to vary. According to these results, we recommend the use of refrigerated and immediately frozen plasma samples, especially because we find significant amounts of CMS even in samples taken prior to a dose. As a result in a sample shipped at ambient temperature (i.e. containing 2 µg/ml of colistin and 15 µg/ml of CMS the colistin concentration) would be estimated (more than 15%) to high. (Rajesh V. Dudhani, 2010). Sample Preparation Among the different precipitation methods tested the precipitation with 0.2% TFA in isopropanol resulted in an extraction yield of 95% and was used for the sample workup. In-process stability In contrast to other investigators in aqueous diluted plasma extracts we found a significant degradation of CMS in the worked up samples, most probably because of the acidic conditions present (Patrice Gobin, 2010). Because of long batches to be analyzed this effect was not acceptable for us. We have been able to control this effect, however by strictly keeping the sample temperature at 4 °C during the whole procedure and by adding of 24 % DMSO to the final dilution of the supernatant. We found a concentration depended inhibitory effect of DMSO drastically reducing the hydrolysis rate (Fig. 4). CMS-Hydrolysis The sample treatment with sulfuric acid for 1 hour at room temperature did not result in a quantitative hydrolysis of CMS, also prolongation of this step (2 h) did not increase the yield. The addition of 0.2% TFA improved the conversion rate and it was noted furthermore that the conversion continues in the diluted supernatant after centrifugation. Thus the samples have to be kept at room temperature for another hour to complete this process. The CMS concentration was calculated from CMS [mg/l] = 2.4972 • (colistin (hydrolysis) - colistin (free)) The factor of 2.4972 was determined from the hydrolysis of CMS reference preparations. LC-MS/MS method The selected MRM-transitions showed the needed selectivity and sensitivity to meet the requirements of the method. In blank samples interfering peaks have not been detected for colistin A and B, neither for the internal standard polymyxin B (Fig. 1, Fig. 2). Validation and Quality control The calibration curves were analyzed for homogeneity of the variances, linearity according to the method of Mandel and residual plots have been performed. The LOD and LOQ have been calculated from the calibration curve near the LOQ and from the standard deviation near the LOD. All LOD values determined are below 10 ng/ml, which is far below the concentrations expected under therapy. The imprecision is below 10% which is acceptable as well (Table 2). Matrix effects The post column infusion experiment did not show any significant ion suppression or enhancement in the appropriate retention time range of the analyte peaks or the internal standards (Fig. 2 a). The quantitative estimation of the matrix effect showed a 5% signal reduction for colistin A, colistin B and polymyxin B which is acceptable. The extraction recovery found for colistin A and colistin B was 95%, for polymyxin b 90% which is acceptable as well.
Salzburg, 09/04/2014
70 60 Frequency
44,6% 33,2% 2,6% 3,2% 3,6%
10
20
728.71
465.51
50 40 30 20 10 0
Colistin plasma level [µg/ml]
Fig. 5. Distribution of colistin-levels 180 160 140
CMS trough level CMS peak level
120 Frequency
Polymyxin E1 Polymyxin E2 Polymyxin E3 Polymyxin E1-I Polymyxin E1-7MOA
Molar contents
15
Relative Abundance
Subcomponent
456.24 415.29
241.57
Colistin base (mg / mg Colistin Sulfate)
710.84
100 80 60 40 20 0 CMS [µg/ml]
Fig. 6. Distribution of CMS-levels
Conclusion The presented method solved instability issues concerning the sample workup and process stability of CMS. The hydrolysis of CMS with sulfuric acid alone was found to be not quantitatively and therefore optimized with the addition of TFA. The presence of CMS also in trough-level samples makes it necessary to cool or freeze the samples during the preanalytical handling to avoid unwanted increase of the measured colistin levels. Although the measured elimination half-lifes showed a very small inter-patient variability and a good agreement with published data for critically ill patients, the measured patient samples reflected the great variability of the pharmacokinetics. These data and the treatment courses reflect the need of regular monitoring of the CMS treatment. In 3 patients we noticed a second elimination kinetic which has not been described until now. Because of very few data this has to be confirmed in further studies.