The last major environmental disaster that occurred in Brazil in 2015 .... Wikipedia (2015) Bento Rodrigues dam disaster, Wikipedia, (viewed in 15/01/2018,.
Leak Detection System using Machine Learning Techniques Eduardo Oliveira, Mário da Fonseca , Daniele Kappes and Arthur Medeiros IHM Stefanini, Brazil
ABSTRACT Data Science and advanced data analytics are technologies that enable the development of low cost solutions with a high degree of customization. Based on that, this article presents a leakage detection system in a slurry pipeline using a combination of machine learning techniques. The techniques used to detect leakage were based on artificial intelligence, a machine learning model for the energy balance of the pipe combined with an anomaly detection technique approach. The system predicts energy at one point of the pipe based on another point, in order to infer if there is loss of energy (leakage) on it. Although the machine learning model used is a simple parametric linear regression and this technique is well-known in the artificial intelligence domain, its competitive differential is the use of an open source machine learning platform to implement them, which allows clients to have a customized model instead of using costly instrumentation with embedded systems. This work was fully implemented in a ore tailings pipeline of one of the biggest Brazilian iron ore companies. It has already detected several real leakage occurrences, greater than 70 m³/h with only three to five leak false alarms per month. Based on these results, this solution can be considered as an alternative solution for leak detection in short length pipelines, especially for the ones that transport iron ore tailings. Although it can detect leakage between a pipe sections, it cannot detect the exact point of the leak that motivates further development, such the use of wavelet package technique.
1
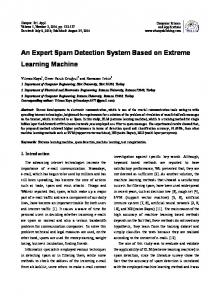
INTRODUCTION Transport of fluids and gases through pipe is widely used in the industry, including the iron ore beneficiation processes. Because these materials that eventually can cause environmental damage or injury persons, it is essential to monitor these pipes in order to prevent disasters and losses. As a result, several leakage detection techniques have been developed over the last thirty years (Datta & Sarkar, 2016). Figure 1 shows an overview of the different techniques used.
Figure 1 Techniques for pipeline leak detection
One of the first techniques used for detecting leaks in pipes was developed by (Billman & Isermann, 1987), in which a real time model of the transient behavior of the measurements in a pipe (flow, pressure, etc.) is used to detect leaks. Another widely used technique is based on the concept of negative pressure wave (NPW) (Silva et al., 1996), wherein the characteristic curve of the pressure drop due to a leak is used as reference for detection. Over the years, other interesting techniques were also applied in order to improve the accuracy of identification, including techniques using artificial intelligence, such as work (Laurentys et al.,2011) using fuzzy logic to detect leaks in transport pipes oil and the works of (Chen et al.,2004) and (Qu et al.,2010), both using supervised learning techniques (Support Vector Machine) for, given a set of training data, classify the presence or not of leaks. However, it is observed that most studies have been developed and applied to: (i) long-distance pipelines; (ii) transport of oil, gas or water. Few studies were found on pipelines transporting specifically iron ore, such as (Jian et al.,2010) and (Mao and Wang, 2016). Still, such projects were developed for large pipes (above 100 km). Although there are companies and systems on the market that monitor long distance pipelines around the world, there is little or no work for pipes that carry ore tailings. Because they are shorted length pipes (5 to 7 km only) and because they do not carry the "product", the market solutions and the mining companies themselves did not give due importance to this mode of transportation. The last major environmental disaster that occurred in Brazil in 2015 (Wikipedia, 2015), drew the attention of companies, media and government agencies regarding environmental safety with respect to ore transport (both the product and the waste). The result was the need to develop a leak detection system for small pipes and transporting the ore tailings. 2
In this study, to address the challenge posed by one of the largest mining of iron ore in Brazil, this work used techniques based on software, combining a dynamic model energy balance with a volume balance model. An interesting point of this work is that the dynamic models of energy balance is combined with a technique of machine learning, known as anomaly detection (Chandola, Banerjee & Kumar, 2009). This combination allowed the modeling of "normal" behavior of the pipeline and any "abnormal" behavior (outliers) shall be treated as a possible leak. Thus, one of the great challenges of this work was to find the optimum adjustment of the threshold that defines what is considered a normal or an abnormal behavior, so that the leak detection system generates the least amount of positive false alarms. In addition to technical matters, another important aspect of this work was the use of tools with open license, open source (KNIME, 2004), which allowed a specific customization to the reality of the plant and a significant reduction in costs compared to proprietary solutions. The purpose of this article is not to focus on technical details used, since there is already considerable literature on the subject, but show the main challenges and difficulties faced to develop, implement and validate this whole system, especially ensuring safe operation and continued use of the system by the customer. Moreover, the limitations and robustness of the system are discussed.
METHODOLOGY Pipeline characteristics The pipe for ore tailings is a pipe responsible for transporting mining waste. This waste is produced during ore processing operations, such as hydro cyclone, thickening and flotation pulp. Initially, the material is stored in tanks, where mechanical stirrers homogenize it. The waste is then pumped along the pipe to the reservoir, where the material is finally disposed. This pumping can occur with pumps arranged in series. In the case described in this article, the pumps are of the centrifugal type and the system comprises two sets in series, which operate alternately. The line is around 5.5 km and after each of the pump assemblies are installed two pressure gauges, and PITR PIT1 called in the flowchart of Figure 2. Then, there is a flow meter (FIT) and other density (DIT). Along the tailings line, there are two pressure gauges: PIT2, which is 3.3 km of pump sets and PIT3 which is 4.5 km from the beginning of the pipeline. Table 1 shows the average values of each normal instrument operation.
Leakage occurrences Before the development of the work presented in this paper, two leaks had been reported in that pipe. Although there are interlocks security to stop the transport of waste, if the pressure in one of the meters reach a critical level (+ - 40% of normal operation), these leak occurrences were not perceived by the security system, resulting in leaks tailings near the pipe. Another problem that occurred at the same time as the leak was the reading failure in one of the pressure sensors and because of that, the pressure behavior data during such episodes were not recorded, hindering the development of a system for the detection of future leaks. 3
Figure 2 Pipeline Overview
Table 1 Mean value in each of the sensors arranged along the pipeline Sensor
Mean Value
PIT1
1441.6 kPa
PITR
1412.2 kPa
PIT2
755.1 kPa
PIT3
931.6 kPa
DIT
1.5 g / cm³
FIT
1000 m³ / h
Dynamic modeling of the system The development of the leak detection system begins with the working fluid dynamics behavior modeling, using existing instrumentation. Mathematical modeling of the system was made based on the energy conservation principle (Khan Academy, 2014). For this, the pipe was simplified to a model close to that of Figure 3:
ρ Figure 3 Pipeline simplification
Where:
4
Pa, Pb: the pressure measurement points; � = average fluid density; Za, Zb = relative height of the points "a" and "b"; va, vb = flow velocity of the fluid at points "a" and "b" respectively. In addition to the quantities presented in Figure 3, the mathematical model includes the acceleration of gravity and the pressure drop along the pipe hf (which can be considered proportional to the square of the measured flow in the pipe). The latter quantity is associated with loss of energy of the fluid, mainly due to the contact between it and the inner wall of the pipe. In the case of a suspended material in water like the waste from mining, it is possible to approach this energy conservation principle by widespread relationship in fluid mechanics: Bernoulli's equation with pressure drop (Queen's University, 2015). Thus, the mathematical equation representing the system (taking into account two different points along the pipe) can be described as:
(1)
It is also possible to assume that the flow velocity is the same in two points of Figure 3 (va = vb = v), since the inner diameter is the same throughout its length and the waste fills all the system volume. It is also known that the flow velocity of the fluid along the pipe is proportional to the flow in the pipe, resulting in:
(2)
Machine learning techniques application According to the dynamic model formulated in equation (2), the application of machine learning basically consisted of using a linear regression algorithm to predict the energy in a point of the pipe (represented by Pa / � in equation (2)) from the energy measured at another point of the pipe. Figure 4 shows that, under normal conditions, the trained model fits well to the actual data (training data set). This step of "teaching" the model (equation (2)) what is the dynamic behavior of the system means the same as to teach the detection system what the “normal” behavior is or expected energy balance. The challenges and difficulties of this stage are: quantity, timing and quality of data used to train the algorithm. Important to remember that there was no data logging from sensors about the system behavior during the occurrence of leaks. So there was no way to teach the system what would be the "abnormal" behavior or anomalous (leak). For this reason, the anomaly detection technique was applied in order to define the threshold between anomalous and not anomalous behavior. An example is illustrated in Figure 5. The anomaly (or leakage) is defined as the difference between the mean and the standard deviation of the error for each model represented by (2). Therefore, the challenge of the work was to determine what would be the line between a simple system modeling error and a real energy difference meant that a leak in the pipeline. The definition of the threshold between normal or abnormal behavior influences a compromise between precision and robustness. The lower the threshold, the greater the accuracy, which means 5
more chances of detecting leakages lower than 70 m³/h. However, the amount of false positive alarms also increases, which reduces the reliability and robustness of the system. Since the system completely stops the flow in the pipeline each time an anomalous behavior is detected, the amount of false positive alarms generated cannot be excessive (what would lead to great production losses) or too reduced (only catastrophic leaks would be detected).
(a)
(b)
Figure 4 Dynamic response of the linear regression model: (a) input data for model training and (b) output data or model validation.
Figure 5 Anomalous Behavior
Implementation The implementation of the system used a very simple architecture, as shown in Figure 6. The data read from the plant historian (PIMS) are stored an updated in a SQL database every five minutes. The analytics platform (KNIME) reads such data (sensor signals) and interprets it using data mining techniques (cleaning and processing of data), and machine learning techniques (linear regression and anomaly detection). The results (which are leak alarms) are written in the same SQL database. The alarm signals are also made available via OPC to the plant supervisory system.
6
Figure 6 Online operation overview
RESULTS AND DISCUSSION To validate the system, three leak tests were performed on a real pipeline, which transports iron ore tailings. Two of them were about 35 m³/h and the last one was equal to 100 m³/h. The duration of all tests was around 10 minutes. Figure 7 shows that system detected all of them. In the figure below is also shown that each time the difference between the blue line (which represent the measured data or energy at one point of the pipe) and the green line (the calculated model or calculated energy in another point of the pipe) was above a certain value (threshold), the alarms were triggered. Every alarm that was triggered could be interpreted as loss of unusual energy between two points and makes the system shoot a leak alarm for that section of the pipe.
Figure 7 Real occurrences of pipeline leakage
Although the system was capable to detect leak of 35 m³/h this turned out in more than five false positive alarms per day, which was not viable for the plant operation personnel (they could not deal with this amount of false alarms). After discussing with the client, the trade-off between robustness and accuracy the threshold of the system was re-tuned using the leak data collected during the tests (Figure 7). This means that the energy balance model needed to be re-trained in order to be more generalist (less over fitting). This also mean that the trigger would have a higher threshold. A trial and error process, according to client’s desire of performance, sets the value of the 7
threshold. Now, the system triggers around three to five false positive alarms per month, which means that it can detect leak only above 70 m³/h. After that final adjustment customer's plant operating staff allowed the leak detection system to activate the security interlocks and cease the ore tailings flow in the event of any alarm in a regime of 24/7 operation. This same system has also been expanded and deployed in three other pipelines, two that transport ore tailings and one that transport iron ore.
CONCLUSION The leak detection system for short length pipes proved to be able to detect real leaks in an iron ore beneficiation plant. The work also shows that even using data from the already existing sensors in the plant it was it possible to develop a robust system using techniques of machine learning and open source platforms. The system uses a linear regression algorithm to model the energy balance of the pipeline, which can be easily replicated to other short length pipes. The biggest challenge is to find the “optimum” threshold for each pipeline, which is particular for each case. A business model of co-creation between client and solution provider shows a good fit for this type of problem, because it was not an off the shelf solution. Some considerations for further development are: get more leak data in order to find better generalization of the optimum threshold and use wavelet package algorithms to try to detect the exact point of leak.
REFERENCES Wikipedia
(2015)
Bento
Rodrigues
dam
disaster,
Wikipedia,
(viewed
in
15/01/2018,
https://en.wikipedia.org/wiki/Bento_Rodrigues_dam_disaster). Datta, S., Sarkar, S. (2016) ‘A review on different pipeline fault detection methods’, Journal of Loss Prevention in the Process Industries, 41, 97-106. Billman, L., Isermann, R. (1987) ‘Leak Detection Methods for Pipelines’, Automatica, 23, 3, 381-385. Silva, A. R., Buiatti, M. C., Cruz, L. S., Pereira, A.F.R.J.O.A.O., (1996). ’Pressure wave behaviour and leak detection in pipelines’. Comput. Chem. Engg, 20, 491-496. KNIME (2004), KNIME open for innovation, viewed 17/Jan/2018, https://www.knime.com Chandola, V., Banerjee, A., Kumar, V. (2009) ‘Anomaly Detection: A Survey’, ACM surveys, 41, 3, Article 15. Mao, M., Wang, X. (2016) ‘Interference signal analysis for leak detection in long-distance transmitting mineral slurry pipeline’, Proceedings of the The 28th Chinese Control and Decision Conference 28–30 May 2016 Yinchuan - China, IEEE Industrial Electronics Chapter, Singapore, 59-64. Jian, A. Jiande, W., Guangyue, P., Chengzhong, Q., Chaobing, H., Chunlei, P., Hongwei, L. (2010) ‘A Kind of Pressure Detection Method in Long Distance Ore Slurry Pipeline’, 3rd International Symposium on Knowledge Acquisition and Modeling, IEEE, 196-198.
8
Qu, Z., Feng, H., Zeng, Z., Zhuge, J., Jin, S. (2010) ‘A SVM-based pipeline leakage detection and prewarning system’, Measurement, 43, 513-519. Chen, H., Ye, H., Lv, C., Su, H. (2004) ‘Application of Support Vector Machine Learning to Leak Detection and Location in Pipelines’, Instrumentation and Measurement Technology Conference in Como Italy 18-20 May, IEEE, 2273-2277. Laurentys, C.A., Bomfim, C.H.M., Menezes, B.R., Caminhas, W.M. (2011) ‘Design of a pipeline leakage detection using expert system: A novel approach’, Applied Soft Computing, 11, 1057-1066. Queen’s
University
(2015)
Losses
in
pipes,
Khan
Academy,
(viewed
in
16/01/2018,
http://my.me.queensu.ca/People/Sellens/LossesinPipes.html) Khan Academy (2014) What is conservation of energy?, Khan Academy, (viewed in 16/01/2018, https://www.khanacademy.org/science/physics/work-and-energy/work-and-energytutorial/a/what-is-conservation-of-energy)
9