International Journal of Computer Science & Information Technology (IJCSIT), Vol 2, ... Network and system security is of paramount importance in the present data .... Support Vector Machines can exhibit a large degree of flexibility in handling ...
International Journal of Computer Science & Information Technology (IJCSIT), Vol 2, No 6, December 2010
NETWORK INTRUSION DETECTION SYSTEM BASED ON MACHINE LEARNING ALGORITHMS Vipin Das 1, Vijaya Pathak2, Sattvik Sharma3, Sreevathsan4, MVVNS.Srikanth5, Gireesh Kumar T 6 1,2,3,4,5,6
Amrita Vishwa Vidyapeetham,Coimbatore-641105,Tamil Nadu,India
{1das4all, 2vijayapathak90, 3sattviksharma, 4sreevathsan.ravi, 5 mvvnssrikanth 6gireeshkumart}@gmail.com
ABSTRACT Network and system security is of paramount importance in the present data communication environment. Hackers and intruders can create many successful attempts to cause the crash of the networks and web services by unauthorized intrusion. New threats and associated solutions to prevent these threats are emerging together with the secured system evolution. Intrusion Detection Systems (IDS) are one of these solutions. The main function of Intrusion Detection System is to protect the resources from threats. It analyzes and predicts the behaviours of users, and then these behaviours will be considered an attack or a normal behaviour. We use Rough Set Theory (RST) and Support Vector Machine (SVM) to detect network intrusions. First, packets are captured from the network, RST is used to pre-process the data and reduce the dimensions. The features selected by RST will be sent to SVM model to learn and test respectively. The method is effective to decrease the space density of data. The experiments compare the results with Principal Component Analysis (PCA) and show RST and SVM schema could reduce the false positive rate and increase the accuracy.
KEYWORDS IDS, RST, SVM, PCA
1. INTRODUCTION Intrusion Detection System (IDS) are software or hardware systems that automate the process of monitoring and analyzing the events that occur in a computer network, to detect malicious activity. Since the severity of attacks occurring in the network has increased drastically, Intrusion detection system have become a necessary addition to security infrastructure of most organizations. Intrusion detection allows organization to protect their systems from the threats that come with increasing network connectivity and reliance on information systems. Given the level and nature of modern network security threats the question for security professionals should not be whether to use intrusion detection but instead which intrusion detection features and capabilities can be used. Intrusions are caused by: Attackers accessing the systems, Authorized users of the systems who attempt to gain additional privileges for which they are not authorized, Authorized users who misuse the privileges given to them. DOI : 10.5121/ijcsit.2010.2613
138
International Journal of Computer Science & Information Technology (IJCSIT), Vol 2, No 6, December 2010
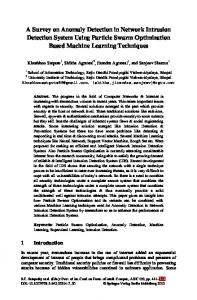
Intrusion detection systems (IDS) take either network or host based approach for recognizing and deflecting attacks. In either case, these products look for attack signatures (specific patterns) that usually indicate malicious or suspicious intent. When an IDS looks for these patterns in network traffic then it is network based (figure 1). When an IDS looks for attack signatures in log files, then it is host based. Various algorithms have been developed to identify different types of network intrusions; however there is no heuristic to confirm the accuracy of their results. The exact effectiveness of a network intrusion detection system’s ability to identify malicious sources cannot be reported unless a concise measurement of performance is available. The three main approaches we are considering is Paxson’s Bro, Leckie et al’s robabilistic approach and Jung et al’s sequential hypothesis testing for scan detection.
Figure 1. Overview of NIDS The paper is organized as follows. The related works in this field are discussed in Section 2. Section 3 provides an overview on the various machine learning algorithms. The proposed system is depicted in Section 4. Section 5 provides an overview on the feature extraction and selection process. Section 6 gives information regarding the classification procedure used. Section 7 provides the performance and experimental results. Finally, the discussion with conclusions is provided in Section 8.
2. RELATED WORKS 2.1 Bro NIDS Paxson’s Bro [8] monitors packet traffic entering and leaving the target network. Sources are identified as scanners if they make N failed connection attempts to a configurable list of services. A connection is considered to have failed if it is unanswered or it generated a TCP reset response. For other services, Bro records information for all connection attempts. If the number of connection attempts for these services exceed N, this source is also identified as a scanner. The list of services and N are configured in various policy scripts implemented by Bro. These policies can also contain signatures of well known types of attacks. 139
International Journal of Computer Science & Information Technology (IJCSIT), Vol 2, No 6, December 2010
2.2 Probabilistic Approach Leckie et al[12] is using a probabilistic model to distinguish between scanning sources and normal users. The algorithm is modeled around the theory that destinations accessed more often are more likely to be active hosts while destinations accessed less frequently are probably hosts that are not existent. Access to uncommon hosts are most likely generated by scanners aiming to explore the availability of destinations and an access to a common host is most likely regular usage. This ideal allows a measure of normality to be generated for each access to a particular destination in the target network. By assuming attackers are equally likely to access any source within the target network, a measure of irregularity can also be calculated. The probabilistic approach gives each source ψ that accesses the target network a probability of being a normal source pnorm and a probability of being an attacking source patt based on the set of destinations Di it accesses. The source is considered an attacker if patt(Di) > pnorm(Di). The probability that each set Di is accessed by a normal user is the probability that each dj within the set came from a normal user. A connection attempt to a host that receives traffic from many other sources is more likely to be a real host within the target network than an attempt to a host that rarely receives any connection attempts. The probability of a dj being a normal access is directly related to the number of other sources that have also accessed that host. A similar calculation is made for the probability that Di is generated by an attacking source. To calculate patt(dj), each accessed destination address is thought of as a random access: probability of accessing any destination within the target network is equally likely. The probability of a source being a host scanner is the probability of all host accesses being random accesses. For each new source to destination access, Di of ψ is updated and the distribution of accesses within the network is adjusted accordingly. If the new sets of destinations accessed are more likely to be from an attacking source than a normal source, the source is identified as a host scanner. Otherwise, the system waits or the next access attempt to be made before updating attacking and normal probabilities and testing for scan behavior again. After potential scanners have been identified, a filtering algorithm is used to remove sources that accessed ports 80 and 21. These services are HTTP and FTP respectively. The filtration technique aims to remove common false positives that can be generated due to excessive use of these popular ports. Filtering these services is not expected to have significant impact on produced results as ports other than 80 are commonly scanned. This algorithm can also be used to detect port scanners. The same theory that an access to a popular port is less suspicious than access to an unpopular port can be used to generate normal and attacking port usage likelihoods.
2.3 Sequential Hypothesis Testing Jung et al[11] approach uses sequential hypothesis testing to classify a remote host. Any source that accesses the target network can be identified as one of two hypotheses: H0 when the remote source is a normal user or H1 when the remote source is a scanner. The main theory behind this model is the observation that benign and malicious users differ in the proportion of connection attempts that are successful. Sources that have a large percentage of accesses to local hosts for which connection attempts failed are more likely to be possible scanners. Sources that have a small percentage of access connections that fail are potentially benign. Using this idea, each connection attempt Yi made by a remote source to a destination in the target network is evaluated according to the successful or failed connection outcome of that attempt. The likelihood ratio of a source being a scanner L(Y) is calculated using the likelihood ratio of all connection attempts Yi made by that source. The likelihood ratio of each Yi is calculated as the ratio of the probability of the connection outcome given the source is a scanner to the probability of the connection outcome given the source is benign. 140
International Journal of Computer Science & Information Technology (IJCSIT), Vol 2, No 6, December 2010
The L(Y) is then compared to pre-selected η0 and η1 thresholds. If L(Y) ≥ η1 the source is identified as a scanner (H1). Otherwise, if L(Y) ≤ η0 the source is lagged as a benign user (H0). If the likelihood ratio does not reach either threshold, the outcome remains unknown and the status is pending decision until further connection attempts are made. This algorithm depends critically on an oracle that predicts whether or not a given connection will establish a useful connection. In an offline system, the oracle could be a list of connections that connected successfully and exchanged data. In an online system, a prediction on whether or not the connection would connect successfully can be estimated depending on which host addresses are available and what port numbers are open in the target network.
3. MACHINE LEARNING CONCEPTS Machine Learning includes a number of advanced statistical methods for handling regression and classification tasks with multiple dependent and independent variables. These methods include Support Vector Machines (SVM) for regression and classification, Naive Bayes for classification, and k-Nearest Neighbors (KNN) for regression and classification.
3.1 Support Vector Machine (SVM) This method performs regression and classification tasks by constructing nonlinear decision boundaries. Because of the nature of the feature space in which these boundaries are found, Support Vector Machines can exhibit a large degree of flexibility in handling classification and regression tasks of varied complexities. There are several types of Support Vector models including linear, polynomial, RBF, and sigmoid[14].
3.2 Naive Bayes This is a well established Bayesian method primarily formulated for performing classification tasks. Given its simplicity, i.e., the assumption that the independent variables are statistically independent, Naive Bayes models are effective classification tools that are easy to use and interpret. Naive Bayes is particularly appropriate when the dimensionality of the independent space (i.e., number of input variables) is high (a problem known as the curse of dimensionality). For the reasons given above, Naive Bayes can often outperform other more sophisticated classification methods. A variety of methods exist for modeling the conditional distributions of the inputs including normal, lognormal, gamma, and Poisson[15].
3.3 k-Nearest Neighbour Algorithm k-Nearest Neighbors is a memory-based method that, in contrast to other statistical methods, requires no training (i.e., no model to fit). It falls into the category of Prototype Methods. It functions on the intuitive idea that close objects are more likely to be in the same category. Thus, in KNN, predictions are based on a set of prototype examples that are used to predict new (i.e., unseen) data based on the majority vote (for classification tasks) and averaging (for regression) over a set of k-nearest prototypes (hence the name k-nearest neighbors)[13].
4. PROPOSED SYSTEM We created a NIDS (figure 2) which will detect scan like port scan using SVM. It collects packet from the network for every 4 seconds. Using the change in frequency for normal packet and attack packet we train our SVM with normal and attack packets. So when an unknown 141
International Journal of Computer Science & Information Technology (IJCSIT), Vol 2, No 6, December 2010
packet is coming SVM can classify easily whether it is a normal or attack packet. Using this method we could detect 95% of attack packets correctly and warning the administrator about it. According to the administrators decision log file is created and stored for future reference. We capture all the packets within the network for analysis. The packets are captured with the help of two packages namely WINPCAP and JPCAP. WINPCAP interacts with the OS and NIC to capture the packets. While JPCAP is a java package which gets the captured packets from the WINPCAP to the java program.
Figure 2. Proposed Architecture
Obtain list of network interfaces
Choose network interface for capturing
Listen to network
Figure 3. Packet Capturing
4.1 WINPCAP Application of network analysis relies on an appropriate set of primitives to capture packets, monitor the network and more. WINPCAP provides easy access to the lower-level network layers. It allows programs to capture and transmit network packets. WINPCAP is an architecture that allows the Win32 application to interact with the network directly. It includes a set of innovative features such as packet monitoring, packet injection, including packet filtering and support for remote packet capture. Packet filtering is made up of a kernel mode component (to select packets) and a user mode library (to deliver them to the application). WINPCAP includes an optimized kernel mode driver called Net group Packet Filter (NPF) and set of user level libraries. WINPCAP can be used by different kind of tools for network 142
International Journal of Computer Science & Information Technology (IJCSIT), Vol 2, No 6, December 2010
analysis, troubleshooting, security and monitoring. In particular, classical tools that rely on WINPCAP are network and protocol analyser, network monitors, network intrusion detection systems (NIDS) and security tools. It is the industry-standard tools for link-layer network access in windows environments. It allows applications to capture and transmit network packets bypassing the protocol stack, and has additional useful feature, including kernel-level packet filtering, a network statistics engine and support for remote packet capture. WINPCAP consists of a driver that extends the operating system to provide low-level network access, and a library that is used to easily access the low-level network layers. The purpose of WINPCAP is to give this kind of access to Win32 applications; it provides facilities to: •
Capture raw packets, both the ones destined to the machine where it’s running and the ones exchanged by other hosts (on shared media).
•
Filter the packets according to user-specified rules before dispatching them to the application.
•
Transmit raw packets to the network.
•
Gather statistical data.
•
WINPCAP also support saving captured packets to a file, and reading files containing saved packets.
•
Applications can be written, using WINPCAP to capture network traffic and analyse it, or to read a saved capture and analyse it, using the same analysis code.
WINPCAP consists of: •
Implementations of a lower-level library for the listed operating systems, to communicate with those drivers.
•
A port of libpcap that uses the API offered by the low-level library implementations.
•
Drivers for Windows 95/98/ME and for the Windows NT family which use NIDS to read packets directly from a network adapter.
4.2 JPCAP JPCAP is a java library for capturing and sending network packets. Using JPCAP, we can develop applications to capture packets from a network interface and visualize/ analyze them in java. We can also develop Java applications to send arbitrary packets through a network interface. JPCAP can capture Ethernet, IPv4, IPv6, ARP/RARP, TCP, UDP, IGMP and ICMPv4 packets. JPCAP uses an event model to allow the user to process packets. In order to capture packets, the user needs to tell JPCAP which network device is to be listened. After choosing a device, 143
International Journal of Computer Science & Information Technology (IJCSIT), Vol 2, No 6, December 2010
we open it for listening. The packets passing through the network are captured and are stored in the specified file. It also enables the user to set filters for specific protocols.
5. FEATURE EXTRACTION AND SELECTION 5.1 Pre-Processing In the preprocess part, we use the packet sniffer, which is built with Jpcap library, to store network packet information including IP header, TCP header, UDP header, and ICMP header from each promiscuous packet. After that, the packet information is divided by considering connections between any two IP addresses (source IP and destination IP) and collects all records every 2 seconds. From real time network, we extracted 14 features (shown in Table I). TABLE I. THIRTEEN FEATURES IN PRE-PROCESS DATA
No 1 2 3 4 5 6 7 8 9 10 11 12 13 14
Feature Description No: of TCP packets No: of TCP source port No: of TCP destination port No: of TCP fin flag No: of TCP syn flag No: of TCP reset flag No: of TCP push flag No: of TCP ack flag No: of TCP urget flag No: of UDP packets No: of UDP source port No: of UDP destination port No: of ICMP packets Answer class
Data Type Integer Integer Integer Integer Integer Integer Integer Integer Integer Integer Integer Integer Integer String (Normal, DoS, Probe)
Here feature selection is done using two different methods ROUGH SET and PCA. We did comparative study and selected rough set as optimal feature selection method.
5.2 Rough Set Theory Rough set theory can be regarded as a new mathematical tool for imperfect data analysis. The theory has found applications in many domains, such as decision support, engineering, environment, banking, medicine and others. Rough set philosophy is founded on the assumption that with every object of the universe of discourse some information (data, knowledge) is associated. Objects characterized by the same information are indiscernible (similar) in view of the available information about them. The in-discernible relation generated in this way is the mathematical basis of rough set theory. Any set of all indiscernible (similar) objects is called an elementary set, and forms a basic granule (atom) of knowledge about the universe [16].
144
International Journal of Computer Science & Information Technology (IJCSIT), Vol 2, No 6, December 2010
One of the fundamental steps in classifier design is reduction of pattern dimensionality through feature extraction and feature selection. Feature selection is often isolated as a separate step in the processing of pattern sets. Features may be irrelevant (having no effect on the processing performance) or relevant (having an impact on the processing performance). A feature may have a different discriminatory or predictive power. We present rough sets methods and Principal Components Analysis in the context of feature selection in pattern classification. This section focuses the discussion on feature selection criteria including rough set-based methods.
5.2.1 Rough Sets and Feature Selection Rough sets theory has been proposed by Professor Pawlak for knowledge discovery in databases and experimental data sets. It is based on the concept of an upper and a lower approximation of a set, the approximation space and models of sets. An information system can be represented as S = ( U, Q, V, f ), where U is the universe, a definite set of N objects { x1, x2,…, xN} (a nonempty set), Q is a finite set of attributes, V = Uq Є Q Vq (where Vq is a domain of the attribute q), f : U х Q → V is the total decision function (called the information function) such that f(x,q) Є Vq for every q Є Q, x Є U. IND (A) = {(x,y) Є U: ∀ a Є A, f(x,a) = f(y,a ) }, denoted also by A. The information system can also be defined as a decision table DT = (U, C υ D, V, f), where C is a set of condition attributes, D is a set of decision attributes, V = Uq Є C υ D Vq, where Vq is the set of the domain of an attribute. Certain attributes in an information system may be redundant and can be eliminated without losing essential classificatory information. One can consider feature (attribute) reduction as the process of finding a smaller (than the original one) set of attributes with the same or close classificatory power as the original set. Rough sets provide a method to determine for a given information system the most important attributes from a classificatory power point of view. The concept of the reduct is fundamental for rough sets theory. A reduct is the essential part of an information system (related to a subset of attributes) which can discern all objects discernible by the original set of attributes of an information system. Another important notion relates to a core as a common part of all reducts. The core and reduct are important concepts of rough sets theory that can be used for feature selection and data reduction.
5.2.2 Rough Sets in KDD Rough sets have many applications in KDD among them, feature selection, data reduction, and discretization. Rough sets can be used to find subsets of relevant (indispensable) features. Combining rough sets theory with a known classifier yields a wrapper feature selection method since it uses the class label information to create the indiscernability relation. It provides a mathematical tool that can be used to find out all possible feature subsets. In Feature selection problem, the purpose of using Rough sets is to find the indispensable features. The principal idea is to recognize the dispensable and indispensable features, using the discernibility matrix.
5.2.3 Reduction of attributes We say that the set of attributes R ⊆ Q depends on the set of attributes P ⊆ Q in S if P ⊆ R. Discovering dependencies between attributes enables the reduction of the set of attributes. 145
International Journal of Computer Science & Information Technology (IJCSIT), Vol 2, No 6, December 2010
Subset P ⊆ Q is independent in S if for every P ′ ⊆ P; otherwise subset P ⊆ Q is dependent in S.
5.3 PCA Based Feature Selection Principal Component Analysis is a well-established technique for dimensionality reduction and multivariate analysis. Examples of its many applications include data compression, image processing, visualization, exploratory data analysis, pattern recognition, and time series prediction[17]. The popularity of PCA comes from three important properties: •
It is the optimal (in terms of mean squared error) linear scheme for compressing a set of high dimensional vectors into a set of lower dimensional vectors and then reconstructing the original set.
•
The model parameters can be computed directly from the data - for example by diagonalizing the sample covariance matrix.
•
Compression and decompression are easy operations to perform given the model parameters - they require only matrix multiplication.
PCA summarizes the variation in correlated multivariate attributes to a set of non-correlated components, each of which is a particular linear combination of the original variables. The extracted non-correlated components are called Principal Components (PC) and are estimated from the eigenvectors of the covariance matrix of the original variables. Therefore, the objective of PCA is to achieve parsimony and reduce dimensionality by extracting the smallest number components that account for most of the variation in the original multivariate data and to summarize the data with little loss of information. The model which uses PCA detects and identifies intrusions by profiling normal network behaviour as well as various attack behaviours. This is very useful for preventing intrusions according to the associated individual type of attack. The model can also achieve real-time intrusion identification based on dimensionality reduction and on a simple classifier. In the proposed method, each network connection is transformed into an input data vector. PCA is employed to reduce the high dimensional data vectors and identification is thus handled in a low dimensional space with high efficiency and low usage of system resources. The distance between a vector and its reconstruction onto those reduced subspaces representing different types of attacks and normal activities is used for identification. The low computational expense of the distance allows a real-time performance of intrusion identification.
6. CLASSIFICATION The term SVM is typically used to describe classification with support vector methods and support vector regression is used to describe regression with support vector methods. SVM (Support Vector Machine) is a useful technique for data classification.
146
International Journal of Computer Science & Information Technology (IJCSIT), Vol 2, No 6, December 2010
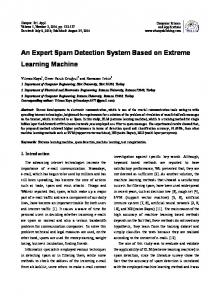
The classification problem can be restricted to consideration of the two-class problem without loss of generality. In this problem the goal is to separate the two classes by a function which is induced from available examples. The goal is to produce a classifier that will work well on unseen examples, i.e. it generalizes well. Consider the example in figure 4. Here there are many possible linear classifiers that can separate the data, but there is only one that maximizes the margin (maximizes the distance between it and the nearest data point of each class). This linear classifier is termed the optimal separating hyper plane. Intuitively, we would expect this boundary to generalize well as opposed to the other possible boundaries.
Figure 4. Optimal Separating Hyper Plane
A classification task usually involves with training and testing data which consist of some data instances. Each instance in the training set contains one “target value" (class labels) and several “attributes" (features). The goal of SVM is to produce a model which predicts target value of data instances in the testing set which are given only the attributes. To attain this goal there are four different kernel functions. 1. Linear: K (xi, xj) = xiTxj 2. Polynomial: The polynomial kernel of degree d is of the form. K (xi, xj) = (xi, xj)d 3. RBF: The Gaussian kernel, known also as the radial basis function, is of the form K ( X i , X j ) = exp( −
xi − x j 2σ 2
) , w here σ stands for the window width.
4. Sigmoid: The sigmoid kernel is of the form K (xi, xj) = tanh (k (xi, xj) + r) RBF is a reasonable first choice. The RBF kernel nonlinearly maps samples into a higher dimensional space, so it, unlike the linear kernel, can handle the case when the relation between class labels and attributes is nonlinear. Furthermore, the linear kernel is a special case of RBF show that the linear kernel with a penalty parameter C has the same performance as the RBF kernel with some parameters (C, r). In addition, the sigmoid kernel behaves like RBF for certain parameters.
147
International Journal of Computer Science & Information Technology (IJCSIT), Vol 2, No 6, December 2010
The second reason is the number of hyper parameters which influences the complexity of model selection. The polynomial kernel has more hyper parameters than the RBF kernel. Finally, the RBF kernel has less numerical difficulties. One key point is 0 < Kij 1) or zero (r xiTxj + r < 1) while the degree is large. Moreover, we must note that the sigmoid kernel is not valid (i.e. not the inner product of two vectors) under some parameters. However, there are some situations where the RBF kernel is not suitable. In particular, when the number of features is very large, one may just use the linear kernel. The SVM uses a portion of the data to train the system, finding several support vectors that represent the training data. According to this model, the SVM will classify a given unknown packet as normal or attack. We used libsvm library to do it. For training the SVM we used KDD99 CUP dataset.
7. PERFORMANCE ANALYSIS The following comparative study (Table II) the kernel functions and possible features are selected. TABLE II. FEATURE SELECTION COMPARISON
Kernel Function No. of Features 1-10 Features
Linear
Polynomial RBF
Sigmoid
All Correct
Everything is wrongly found as teardrop attack
Everything is wrongly found as teardrop attack
10-21 Features
All ipsweep and Neptune attacks are found as teardrop Only ipsweep and Neptune are found
Everything is wrongly found as normal Everything is wrongly found as teardrop attack Only ipsweep and Neptune are found Excepted 15 normal got 15 normal
Everything is wrongly found as teardrop attack
Everything is wrongly found as teardrop attack
Only ipsweep and Neptune are found
Found everything as teardrop attack
Excepted 15 normal got 15 normal. One teardrop attack wrongly as ipsweep attack Everything is wrongly found as teardrop attack
Only teardrop attack can be detected
21-31 Features
31-41 Features
Rough Set 29 Features
Excepted 15 normal got 20 normal. No buffer overflow error found All Correct
Everything is wrongly found as teardrop attack
Everything is wrongly found as teardrop attack
148
International Journal of Computer Science & Information Technology (IJCSIT), Vol 2, No 6, December 2010
Those features and kernel function leads to better classification result is given to alert module where the alerts are created for every attack packets. For real time we train SVM using two sets of features: •
Having all 13 features that are extracted from real time packets using feature extraction.
•
Having 7 features that are selected from extracted features using rough set.
From the table (Table III and IV) we could compare the accuracy of the result of classification using different feature selection algorithms. This comparative study can be done for real network packets too. TABLE III. KDD DATASET
Principal Component Analysis Rough Set Theory
No: of features selected 27
Accuracy
29
98.7%
84.32%
TABLE IV. KDD DATASET
Principal Component Analysis Rough Set Theory
No: of features selected 12
Accuracy
7
93.33%
86.66%
8. CONCLUSION AND FUTURE WORK The IDS is designed to provide the basic detection techniques so as to secure the systems present in the networks that are directly or indirectly connected to the Internet. But finally at the end of the day it is up to the Network Administrator to make sure that his network is out of danger. This does not completely shield network from Intruders, but IDS helps the Network Administrator to track down bad guys on the Internet whose very purpose is to bring your network to a breach point and make it vulnerable to attacks. We proposed an intrusion detection method using an SVM based system on a RST to reduce the number of features from 41 to 29. We also compared the performance of RST with PCA. Our framework RST-SVM method result has a higher accuracy as compared to either full feature or entropy. The experiment demonstrates that RST-SVM yields a better accuracy.
149
International Journal of Computer Science & Information Technology (IJCSIT), Vol 2, No 6, December 2010
In the future, we will increase number of testing data for our system and to find vary of accuracy. We also hope to combine RST method and genetic algorithm to improve the accuracy of IDS. The present system just displays the log information but doesn’t employ any techniques to analyze the information present in the log records and extract knowledge. The system can be extended by incorporating Data Mining techniques to analyze the information in the log records which may help in efficient decision making. The present system only detects the attacks only the known attacks. This can be extended by incorporating Intelligence into it in order to gain knowledge by itself by analyzing the growing traffic and learning new Intrusion patterns.
REFERENCES [1] C.
Chang and C. J. Lin, LIBSVM, “A Library for Support Vector Machines”, the use of LIBSVM,
2009. [2] Rung-Ching Chen, Kai-Fan Cheng and Chia-Fen Hsieh, “Using Rough Set and Support Vector Machine for Network Intrusion Detection”, International Journal of Network Security & Its Applications (IJNSA), Vol 1, No 1, 2009. [3] Phurivit Sangkatsanee, Naruemon Wattanapongsakorn and Chalermpol Charnsripinyo, “Real-time Intrusion Detection and Classification”, IEEE network, 2009. [4] Liberios Vokorokos, Alzebeta Kleniova, “Network Security on the Intrusion Detection System Level”, IEEE network, 2004. [5] Thomas Heyman, Bart De Win, Christophe Huygens, and Wouter Joosen, “Improving Intrusion Detection through Alert Verification”, IEEE Transaction on Dependable and Secure Computing, 2004. [6] T. Lin and C.J. Lin, “A study on sigmoid kernels for SVM and the training of non- PSD kernels by SMO-type methods”, Technical report, Department of Computer Science, National Taiwan University, 2003. [7] Lindsay I Smith, “A tutorial on Principal Components Analysis”, 2002. [8] Vapnik, “The Nature of Statistical Learning Theory”, Springer-Verlag, New York, 1995. [9] Need and study on existing Intrusion Detection System. Available at: http://www.sans.org/resources/idfaq. [10] Resources about packet capturing. Available at: http://www.netsearch.org/jpcap. [11] J. Jung, V. Paxson, A. Berger and H. Balakrishnan. Fast Portscan Detection Using Sequential Hypothesis Testing. In Proceedings of the IEEE Symposium on Security and Privacy, Berkeley, CA, United States, May 2004. [12] C. Leckie and R. Kotagiri. A Probabilistic Approach to Network Scan Detection. In Proceedings of the 8th IEEE Network Operations and Management Symposium (NOMS 2002), pages 369–372, April 2002. [13] Bremner D, Demaine E, Erickson J, Iacono J, Langerman S, Morin P, Toussaint G (2005). "Outputsensitive algorithms for computing nearest-neighbor decision boundaries". Discrete and Computational Geometry 33 (4): 593–604. [14] David Meyer, Friedrich Leisch, and Kurt Hornik. The support vector machine under test. Neurocomputing 55(1–2): 169–186, 2003. [15] Domingos, Pedro & Michael Pazzani (1997) "On the optimality of the simple Bayesian classifier under zero-one loss". Machine Learning, 29:103–137 [16] Pawlak, Zdzisław (1982). "Rough sets". International Journal of Parallel Programming 11 (5): 341– 356.
150
International Journal of Computer Science & Information Technology (IJCSIT), Vol 2, No 6, December 2010 [17] Krzanowski, W.J., “Selection of Variables to Preserve Multivariate Data Structure, Using Principal Component Analysis”, Applied Statistics- Journal of the Royal Statistical Society Series C, 1987, pp. 2233 vol. 36.
AUTHORS PROFILE Mr Vipin Das attained his M.Tech(Cyber Security) from Amrita University, Coimbatore. He is currently an Asst.Professor in the Computer Science Department of Amrita University, Coimbatore. His research interests are in the field of Network Security, Machine. Learning and Algorithms.
Miss Vijaya Pathak is currently pursuing her BTech(3rd year) in Computer Science from Amrita Vishwa Vidyapeetham University, Coimbatore. She is currently working in the field of Computer Networks. She is also CCNA certified.
Master Sattvik Sharma is currently pursuing final year (4th) BTech(Information Technology) from Amrita Vishwa Vidyapeetham University, Coimbatore. He is currently working in the field of computer vision and digital image processing. He has a springer publication title“Tracking of nose tip as an alternative to mouse.” His work is to be published in the Inder science journal of science and technology. He also has a paper “Human Face Detection and Recognition using a hybrid approach” which got selected for the International conference on Computing. Master Sreevathsan R. is currently pursuing final year (4th) BTech(Information Technology) from Amrita Vishwa Vidyapeetham University, Coimbatore. He is currently working in the field of computer vision and digital image processing. He has a springer publication title“Tracking of nose tip as an alternative to mouse.” His work is to be published in the Inder science journal of science and technology. He also has a paper “Human Face Detection and Recognition using a hybrid approach” which got selected for the International conference on Computing. MVVNS Srikanth is currently pursuing his B.Tech in Information Technology from Amrita Vishwa Vidyapeetam, Coimbatore. His major research interests are Artificial Intelligence and Computer Networks.
Gireesh Kumar T received B.Tech degree in Mechanical Engineering from N.S.S.college of engineering, Palghat, Kerala in 1998 .He attained his MTech degree in Computer and Information Science from Cochin University of Science and Technology, Cochin, Kerala in 2002. He is currently pursuing PhD. In Artificial Intelligence at Anna University, Chennai. He is working as a Assistant Professor (Sr.Grade) with TIFAC Core in Cyber security at Amrita Vishwa Vidyapeetham, Ettimadai, Tamilnadu.
151