relied on value stream maps to model the proposed improved versions ofthe
extended value ... extended value streams resulted in a successful cost savings ...
Lean Principles Applied to Extended Value Stream Mapping To Achieve a Costs Savings in the North American Automotive Industry
by Daniel A. Ramos A Research Paper Submitted in Partial Fulfillment of the Requirements for the Master of Science Degree 10
Manufacturing Engineering
3 Semester Credits
The Graduate School University of Wisconsin-Stout May 2010
2
The Graduate School University of Wisconsin-Stout Menomonie, WI
Author:
Ramos, Daniel A.
Title:
Lean Principles Applied to Extended Value Stream Mapping to Acltieve a Cost Savings il1 tlte Nortlt American Automotive Industry
Graduate Degree/ Major: Master of Science in Manufacturing Engineering Research Adviser:
James Keyes, Ph.D.
MonthfVear:
May, 2010
Number of Pages:
72
Style Manual Used: American Psychological Association, 6 th edition
Abstract
In 2007, Toyota surpassed General Motors as the world's largest automaker. This signaled the beginning of a very challenging time for N O1ih America's automakers. Amidst a worsening global economy and slumping consumer demand, the SUV and pick-up truck sectors found themselves in deep crisis. Sales plummeted between 2007 and 2008. It became imperative for these automakers to provide better value for consumers by implementing costs savings. This paper deals with one such cost savings that was achieved through the application oflean principles to an extended value stream. Value stream maps were used as the instrument to study and identify improvement 0ppoliunities. The lean improvement methodology also relied on value stream maps to model the proposed improved versions ofthe extended value stream. By passing on part of the savings to the consumer, the automaker was able to provide better value to its customers. As predicted by the literature, the lean principles for improving
3 extended value streams resulted in a successful cost savings implementation that benefitted the automaker, its supplier, and most importantly consumers.
4
The Graduate School University of Wisconsin Stout Menomonie, WI Acknowledgments First and foremost, I would like to thank my advisor Dr. Jim Keyes for his constant support, guidance, and understanding throughout the thesis writing process. I would also like to thank Dr. Danny Bee for his encouragement and sound advice during my studies at the University of Wisconsin-Stout. I am paliicularly grateful to Dr. Pete Heimdahl for encouraging me to apply to the Master of Science in Manufacturing Engineering. Last but not least, I would like to thank my family for their suppOli.
5 Table of Contents ............................................................................................................................... Page Abstract ....................................................................................................................... 2 List of Figures ............................................................................................................. 8 Chapter I: Introduction ............................................................................................... 9 Statement of the Problem ............................................................................... 10 Purpose of the Study ...................................................................................... 11 Assumptions of the Study .............................................................................. 12 Definition of Terms ....................................................................................... 13 Limitations of the Study ................................................................................ 16 Methodology .................................................................................................. 17 Chapter II: Literature Review ................................................................................... 19 North America's Awakening to Lean Manufacturing .................................... 19 Principles of Lean ........................................................................................... 20 Ford's Contributions to Lean Manufacturing ................................................. 20 The Beginnings of Lean Production ............................................................... 22 The Objective of a Lean Production System .................................................. 23 Jidoka: A First Pillar of the Toyota Production System ................................. 24 Just-in-Time: A Second Pillar of the Toyota Production System ................... 24 The Role of Standardization in the Toyota Production System ...................... 25 The Role Stabilization in the Toyota Production System ............................... 25 At the He31i of the Toyota Production System ............................................... 27 Value Stream Mapping ................................................................................... 27
6
Extended Value Stream Mapping ................................................................... 29 Extended Value Stream: Future States ........................................................... 30 Cooperation in Extended Value Streams ........................................................ 32 Chapter III: Methodology ......................................................................................... 34 Subject of the Study .... ................................................................................... 35 Instrumentation ... ... .... .......... ......................................................................... 35 Data Collection ...................................................................... .. ..................... 36 Data Analysis ................................................................................................ 37 Current state analysis (future state I) ................................................ 37 Future state II analysis ...................................................................... 42 Ideal state analysis ............................................................................ 46 Limitations of the methodology .................................................................... 52 Chapter IV: Results ................................................................................................... 54 Results of the CUlTent State Extended Value Stream Map ........................... 55 Table 1: Results of Extended Value Stream Improvements ......................... 55 Results ofIdeal State Extended Value Stream Map ..................................... 56 Results of the Lean Implementation ............................................................. 58 Chapter V: Discussion .............................................................................................. 60 Limitations of the Study ............................................................................... 61 Development of the Current State Extended Value Steam Map .................. 62 Development of the Ideal State Extended Value Stream Map ..................... 63 Future state II .................................................................................... 63 Ideal state .......................................................................................... 63
7 Implementation of the Ideal State Extended Value Stream Map .................. 65 Conclusions ............................................................................ .................. ...... 66 Recommendations ... .................................. :.................................................... 67 Center of knowledge .......................................................................... 67 Value stream manager .............................................................. .. ....... 67 Value stream continuous improvement ............................................. 67 Value stream mapping up-front ........................................................ . 67 References .............. ................................................................................................. 68 Appendix A: Takt Time Calculation ...................................................................... 70 Appendix B: Process Cycle Efficiency Calculation ........................................ ...... . 71 Appendix C: Expected Cost Savings Calculation ................................................... 72
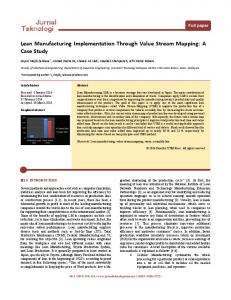
8 List of Figures Figure 1: Framex-Universal current state extended value stream map ....................... .40 Figure 2: Framex Facility current state value stream map .................................... .41 Figure 3: Framex-Universal future state II extended value stream map ...................... .44 Figure 4: Framex Facility future state II value stream map ................ .. ...... .. .......... .45 Figure 5: Framex-Universal ideal state extended value stream map .......................... .49 Figure 6: Framex-Mexico facility ideal state value stream map ................................ 50 Figure 7: Framex Canada facility ideal state value stream map ................................ 51
9
Chapter I: Introduction
The pressure on American vehicle manufacturers to remain competitive has never been greater. Competition from foreign automakers and decreasing consumer demand have forced domestic car companies to focus on reducing costs while revamping product lines to include vehicles that are more appealing to consumers. In short, domestic car companies are striving to provide better value in order to survive. In The Machine That Changed the World, Womack, Jones, and Roos (1990) made the case that lean manufacturing would eventually unseat the mass production model of the early American automakers such as Ford and General Motors.
American companies, the authors
asserted, would have to embrace lean manufacturing to remain competitive with their Japanese counterparts. Indeed, in 2007, Toyota assumed the rank of the world's largest auto maker. It is now clear that lean production philosophy, as embodied in the Toyota Production System, has set a new standard of competition in the global automotive industry. In NOlih America, auto makers and their suppliers are grappling with the problem of having to reduce costs while increasing the value passed on to consumers.
Adopting lean
manufacturing practices is not only a matter of being competitive these days, it is also a matter of staying in business (Womack, 2009). The SUV and pick-up truck sectors have been the hardest hit in this economic downturn. High gas prices and lower demand have created an urgent need to implement costs savings to make up for lost revenues.
If auto makers and their suppliers can reduce costs, pali of those
savings can be passed on to consumers providing them with better value. These savings can also help to improve profit margins.
10
Statement of the Problem Framex is a Tier 1 supplier of body frames for pick-up trucks and SUV's. It operates facilities in Mexico and Canada and supplies frames to Universal who is a leading US automaker based in Michigan.
As requested by the companies involved, the names "Universal" and
"Framex" have been used instead of the real company names.
Framex's Canadian facility
specializes in the production of steel frames , while its Mexican facility specializes in the production of aluminum frames. In 2005, when the pick-up platform was launched, the cost of shipping aluminum frames from Framex Mexico to Michigan was considered relatively inexpensive. At that time, the American dollar was stronger. Fuel and aluminum prices were relatively low and a specialized teclmology approach was acceptable (Pinkham, 2005). These conditions no longer held true in 2008. The basic problem is as follows. 90% of the pick-up trucks built at Universal's Michigan assembly plant are built with steel frames shipped from Canada. However, the other 10% are aluminum frames shipped from Mexico. While Framex Canada is located 126 miles away from Universal's Michigan location, Framex Mexico is located over 2000 miles away. Given the new economic circumstances of 2008, it would be ideal if both types of frames could be shipped from the Canadian Framex facility. However, moving Framex's entire manufacturing operations from Mexico to Canada is simply not possible within the time constraints of this field problem. This study will deal with the problem of reducing Universal's cost of purchasing aluminum frames from Framex, currently shipped from Mexico. In March of 2008, Universal asked Framex to implement changes to its manufacturing operations that will result in a significant cost savings. Universal requires that the cost savings be implemented in time for the new model year change due in August of 2008.
11
Purpose of the Study The purpose of this study is to implement lean improvements in the manufacturing operations of aluminum frames supplied by Framex to Universal ' s Michigan assembly plant. These improvements needed to be implemented within a period of six months and result in a cost savings for Universal. If Universal can reduce its costs, some of the savings can be used to increase its profit margins.
Some of the savings can also be passed on as incentives to
consumers, thereby providing better value. To achieve the purpose of this study, the researcher will use a lean manufacturing approach based on extended value stream mapping. The process of extended value stream mapping in this study can be broken down into three sub-problems. The first sub-problem is to establish the CUlTent state of Framex manufacturing and supply operations. The current state extended value stream map will serve as a baseline for comparison with the proposed future state. The second sub-problem will be to analyze the current state and propose changes that will improve transpOliation links and optimize manufacturing locations. This will result in an ideal state extended value stream map.
The third sub-problem will be to carryout the lean
improvements and evaluate whether the implementation ofthe ideal state was successful. A lean manufacturing approach is expected to yield benefits for Universal, Framex, and most importantly for the consumer. As with any lean implementation, a reduction of non-value added activities is expected as a results of process improvements.
A leaner transpOliation
network is also expected as a main outcome including reduced inventories and lead times.
12 Assumptions of the Study This study assumes that Universal and Framex will share the burden of financing any investments required for this cost savings initiative. In other words, the researcher assumes that Universal and Framex will work cooperatively. This assumption is fundamental to a successful extended value stream implementation (Dolcemascolo, 2006).
It is also assumed that changes in manufacturing location or equipment will not affect the quality or reliability of the product. This assumption provides the rationale for not planning for product validation after the lean implementation is done. This field problem will be focused on improving the extended value stream.
The
researcher assumes that lean production is already taking place within each of the individual manufacturing locations.
Theoretically, the implementation of lean manufacturing within
individual facilities should happen before the extended value stream can be optimized (Jones & Womack, 2002). Furthermore, this study assumes that market conditions will remam stable once the project is completed. Market conditions include cost of materials, fuel prices, and labor. Stable market conditions also include a stable consumer demand.
If market conditions change
drastically immediately after the project is complete, the benefits may not materialize as anticipated. Lastly, it is assumed that Universal only pays the cost of shipping of finished goods from Framex to its pick-up truck assembly plant. facilities is paid by Framex.
Any transportation of PaIts between Framex
13
Definition of Terms Changeover time. The time required to adjust a piece of manufacturing equipment to enable it to make a different product. It is measured as the time between the last good piece of the previous product to the first good piece of the next product being made at a workcell or workstation (Duggan, 2002). Current state extended value stream map. An extended value stream map representing what is actually in the status quo. It is based on data obtained from observations (Jones & Womack, 2002). Cycle time. The time that elapses between two consecutive parts exiting a process O\Tash & Poling, 2008).
Extended value stream. The series of steps, both value added and non-value added, required to bring a product or service from material inputs to the customer. These include steps between facilities and within facilities, as well as transp0l1ation links (Jones & Womack, 2002). ERP System: Enterprise Resource Planning system (Nash & Poling, 2008). Facility value stream map. Same as a value stream map. The use of word facility is used in contrast to extended value map (Jones & Womack, 2002). Future state I. An improvement over the CUlTent state where all the facilities
In
an
extended value stream have been converted to lean production (Jones & Womack, 2002). Future state II. An improvement over the current state where all the facilities in an extended value stream have been converted to lean production and transp0l1ation has been optimized (Jones & Womack, 2002). Heijunka. The discipline of leveling the quantity and mIX of parts being produced (Rother & Shook, 1999).
14 Ideal state. An improvement over the current state where all the facilities in an extended value stream have been converted to lean production, transportation has been optimized, and location of facilities has been optimized (Jones & Womack, 2002). Inter-modal cross-dock. A cross-dock that unloads cargo from a truck and loads this same cargo onto a train (Jones & Womack, 2002). Jidoka. Refers to automation smart enough to detect defects and halt production when they occur (LikeI', 2004). Kaizen. Incremental improvement to a process or a product within a manufacturing context (Rother & Shook, 1999). Kaizen burst. This is a planned improvement initiative usually identified on a future state value stream map (Rother & Shook, 1999). Kanban. A request signal to produce or withdraw upstream materials in a production process (Rother & Shook, 1999). Lead-time. The amount of time elapsed between the order of a product or service to the time of delivery (Jones & Womack, 2002). Lean manufacturing. An approach to production based on the philosophy of eliminating all waste from production operations. In lean manufacturing, production only occurs when there is a demand from a downstream process (Rother & Shook, 1999). Non value-added worl{. Work done by a supplier that the customer is not willing to pay for (Rother & Shook, 1999). Pacemaker process. The process that receives the production orders and originates the pull signal for the value stream (Rother & Shook, 1999).
15
Process cycle efficiency. The ratio of value added time to the total lead-time for a value stream map Pull production. The production of pat1s based on a signal received from a downstream process (Womack & Jones, 1996) Push production. The production of pat1s without a signal received from a downstream process (Rother & Shook, 1999). Tald time. The rate of production required to keep up to the rate of customer orders (Rother & Shook, 1999). Tier 1 supplier. A company that sells to an auto maker Value. Value can only be defined by the ultimate customer. It is only meaningful when expressed in terms of a specific product (a good or a service, and often both at once), which meets the customer's needs at a specific price at a specific time.
(Womack & Jones,
1996, p.16) Value stream. The series of steps, both value added and non-value added, required to bring a product or service to the customer (Jones & Womack, 2002). Value stream map.
A diagrammatic representation of a value stream from material
inputs to the delivery of finished good to the customer. Value stream maps contain symbols and information characterizing the flow of materials and infonnation within a facility. In the case of extended value stream maps, the transp0l1ation links and multiple facilities are included (Womack, 2006).
16
Value-added work. Work done by a supplier that the customer is willing to pay for (Nash & Poling, 2008).
WIP: Work in process. Unfinished parts accumulated between processes waiting to be finished (Nash & Poling, 2008).'
Limitations of the Study This paper will not analyze which product family will result in the value stream with the best improvement oppOliunities. Instead, the value stream selection is driven by a customer request. In this study, the extended value stream is limited to Framex's North American supply of aluminum pick-up frames to Universal's assembly plant in Michigan. Many value streams exist between Universal and Framex, consisting of several products and locations, but these will not be studied here. Any proposed changes to the extended value stream must be implemented within 6 months: between March and August of2008. This rapid return on investment strategy demonstrates the urgency that Universal places on this project. In contrast, a typical return on investment period is one year. A lean transformation of the individual plants would be a multi-year project and does not fit with the timing requirements. The researcher will limit this study to lean improvements that benefit the extended value stream. Lean initiatives within plants will only be undeliaken if they support improvements to the extended value stream. All lean initiatives will need to be implemented within the limitations of the existing ERP system. No significant changes to information systems will be considered in this study.
17 Finally, the details of the business case that support the lean implementation will not be addressed. Instead, the researcher will limit the analysis of the value stream to lean manufacturing metrics.
Methodology In this study, the researcher used an extended value stream mappmg methodology developed in Seeing the Whole (Jones & Womack, 2002).
In this book, the authors deal with
improvements to a value stream that involves multiple manufacturing locations. This scenario corresponds closely to the relationship between Universal and Framex in the context of their NOlih American operations. In general, value stream mapping consists of three steps (Rother & Shook, 1999). The first step involves the analysis of the current state. A current state map records what is actually happening initially at the level of manufacturing and transpOliation operations. Lean metrics such as non-value added time and travel distances are recorded. This data is used later as a baseline to determine whether the value stream has become leaner.
18 The second step consists of proposing lean improvements. Lean principles, such as onepiece flow, reduction of waste, and minimization of transportation links, are the basis for lean improvement ideas. In the third step, the plans for improving the value stream are implemented and a future state is achieved. The objective is to achieve a value stream that is as close as possible to ideal state. The same metrics that were used to characterize the cUlTent state are reevaluated to see whether the value stream has in fact become leaner and whether non-value added work has been reduced.
In general, the value stream methodology also allows for
continuous improvement. Rother and Shook (1999) call this "the present becomes future" cycle
(p. 101). In the case of this study, a single iteration of the future state will be attempted due to time constraints.
19
Chapter II: Literature Review North America's Awakening to Lean Manufacturing Although lean production has been practiced by Toyota since the 1950s, the widespread study of lean in North America started in the early 1990s with the publication of Th e Machine
ThaI Changed the World (Womack et aI., 1990). That book surveyed the global automotive industry and compared global efficiencies and trends. It documented the fact that some Japanese manufacturers were applying fundamentally different concepts in their approach to vehicle development and manufacturing. Ultimately, The Machine ThaI Changed the World came to represent something of an awakening for the North American auto industry. Womack and his research team at MIT in the early 1990's employed the term "lean" to describe this business model pioneered by Toyota. Since then, interest in lean manufacturing has resulted in a steady stream of books, articles, and seminars on the topic, all explaining the Toyota Production System (Blanchard, 2007).
It is clear that lean has gained acceptance in the North American
manufacturing community, despite the fact that widespread implementation of lean is still a work in progress. Essentially, lean manufacturing seeks to produce a product that is exactly what the customer wants, when the customer wants it, while minimizing all non-value added activities in production (Womack & Jones, 2005).
In the literature, value is simply defined as what the
customer is willing to pay for. Non-value added activities are generally understood to be either waste, or incidental activities that are necessary but add no value to the product.
The best
example of a non-value added activity is quality assurance. Quality inspections do not add value to a product; they merely detect defects before they reach the consumer.
20
Principles of Lean The Lean Institute lists five principles of lean philosophy (Lean Enterprise Institute, 2008). These are: 1. Value should be specified from the point of view of the customer, and it should relate to a specific product family 2. The value stream must be identified. This means identifying all the actions and steps that need to happen to bring a product to the customer 3. Make the value-creating steps flow. This requires optimizing the value stream for the product family.
Batch production and depal1mentalization of skills are
impediments to flow 4. Produce according to customer pull. Once the production system has been setup according to the above principles, production can be scheduled in accordance to actual customer demand 5. Pursue perfection.
This principle acknowledges that there are endless
opportunities for improvements. A truly lean enterprise will engage in continuous improvements of the value stream
Ford's Contributions to Lean Manufacturing Lean manufacturing is modeled mainly after the Toyota Production System. However, even Toyota bOlTowed some concepts from Henry Ford (Womack et aI., 1990). Although Ford is known as the inventor of mass production, he also originated the concept of continuous flow (he called itjlOYI' production) which is an important building block for lean production. His flow production concept was best exemplified by his car assembly line at Highland Park. In this line, vehicles traveled along a moving conveyor setting a constant pace for assembly operations. In
21 order to feed the main line he had to organize feeder processes in a way that approximated cellular manufacturing, where components were assembled in areas of continuous flow. Toyota would later take note of these practices and integrate them into their own production philosophy. Some of Ford's practices have even been described as approximating lean production within an emerging mass production system (Womack et ai., 1990; Dennis, 2007).
Ford's
accomplishments were revolutionary for the times. Ford's mass production system increased productivity by fine-tuning the division of labor, decreasing capital expenses through large size batching, and infrequent changeover times.
Standardized work practices were another major
component of the success of the Ford system. Standardized work at Ford subscribed to the "one best way" philosophy pioneered by W. Taylor. Taylor took the responsibility for work procedures out of the hands of the operators and mandated that the industrial engineers would henceforth design the work. Here again Ford helped to lay the groundwork for a lean approach . Toyota would later adopt standardized work, but not as a static approach. Instead, at Toyota, standardized work involves continuously improving work procedures mainly with the help of the people on the assembly line (Liker, 2004). These were the tenets of Ford's mass production system that at the beginning of the twentieth century were on their way to displacing the traditional craft approach to vehicle production (Dennis, 2007). In so doing, Ford was making industrial history by making cars relatively affordable while providing higher paying jobs to low skilled labor.
Ford's mass
production system was so successful that it essentially became the benchmark for vehicle production in the first half of the twentieth century in North America and Europe. Automotive industrialists visited from all over the world to see Ford's mass production system, including Toyota (Womack et ai., 1990).
22
The Beginnings of Lean Production Mass production remained unchallenged until about the 1960s when a new production system, pioneered by Toyota, started to increase its market share at the expense of the American big three (Womack et aI., 1990). The post-war 1950s was a time of economic hardship in Japan characterized by limited access to capital funds and impOliation of goods. The Toyota motor company, who had been put to work assembling military trucks by the Japanese wartime government, was now returning to its core business of manufacturing civilian vehicles. In a bid to study America's successful automotive industry, Eji Toyoda visited Ford's Rouge Plant in Detroit in 1950.
What he saw there was impressive.
Neveliheless, Eji Toyota was clever
enough to understand that mass production was wholly unsuited for Japan's post war reality. Not only was Japan's car market smaller than America's, it was also more diverse in its needs. Furthermore, bOlTowing capital in the quantities necessary to finance a mass production operation would not have been possible as post-war Japan was cash strapped. Right from the stmi, Toyota's operating principles were forged in an environment marked by extreme scarcity. Toyota recognized that in order to produce cars for its domestic market it would have to do more with less.
It needed to take a radically different approach from what Eji Toyoda
observed at Ford (Liker, 2004). Furthelmore, Japan's economic situation along with Toyota's own cash flow problems were of such a magnitude that Toyota saw itself forced to ask for one qumier of its workers to retire. This move resulted in a strike that would eventually result in a deal where Toyota signed-up to secure employment for its remaining staff. Toyota would now have to devise a survival strategy that hinged on getting the most from its remaining resources: namely modest capital assets and a permanent work force.
23
The Objective of a Lean Production System After the strike of 1950, Toyota would be guided by one overarching objective: to eliminate all waste while producing exactly what the customer. wants (Liker, 2004; Dolcemascolo, 2006).
All other effo11s in the Toyota Production System would support this
objective. Taiichi Olmo, former Chief Engineer at Toyota and architect of the Toyota Production System, identified seven wastes of manufacturing that the Toyota Production System would seek to el iminate. The elimination of these wastes is the basis of the guidel ines for implementing lean improvements in value streams. These wastes are reported by Dolcemascolo (2006, p. 4): 1. Overproduction 2. Transpo11ation 3. Unnecessary inventory 4. Inappropriate processing 5. Waiting 6. Excess Motion 7. Defects
24
Jidoka: A First Pillar of the Toyota Production System The fact is that Ohno was not staliing from scratch productivity.
III
his quest to match Ford's
In addition to being inspired by Ford's continuous flow invention, Ohno was
drawing on the ideas of his Toyota predecessors. Most notably, Ohno would eventually integrate Jidoka as one of the pillars of the Toyota Production system.
The concept of Jidoka, or
automation with intelligence, was in fact pioneered by Sakichi Toyoda, Eji's uncle in the late 1800s when Toyoda was in the business of fabricating looms for the textile industry (Mass & Robertson, 1996). This concept was a great technological leap as well as a philosophical tourde-force. Essentially, when a thread broke in the weaving process, the loom was not allowed to go on producing defective material (waste). This became the original instance of Jidoka.
Just-in-Time: A Second Pillar of the Toyota Production System The other pillar of the Toyota Production System, Just-in-Time (lIT), came from Japanese observations of American supermarkets during the early visits of Taiichi Ohno in the year 1956 (Liker, 2004).
The Japanese observed that supermarket shelves were easily
replenished in the US.
When the product was below a certain level, this would trigger re-
stocking of the item.
There was only enough stock on hand to supply to the immediate
customers. The significance of JIT was that it was integrated into the Toyota Production System in the form of Kanban tools. These Kanban tools are the signaling apparatus that allows a pull system to exist (Jones & Womack, 2002). This is completely different from the mass production approach of having multiple orders sent simultaneously to multiple manufacturing locations in the production process.
In a JIT operation, an upstream process only produces when a
downstream is asking for a unit of production. This simpler and more efficient solution to satisfy demand is at the heart of pull production.
25
The Role of Standardization in the Toyota Production System While JIT and Jidoka are known as the pillars of the Toyota Production System, the foundation of the Toyota Production System consists of standardization and stability (Dennis, 2007). Like in the mass production system, standardization ensures that work is carried out in a predictable and well thought-out manner. Unlike in the mass production system, in the Toyota Production System, the purpose of standards is not to impose a static way of doing things. The opposite is in fact true (Nicholas & Avi, 2006). In the Toyota Production System, standards exist so they can be continuously improved. Through Kaizen sessions, a cross-functional team gets together to target improvements based according to strategic company direction (lmai, 1997). The purpose of a Kaizen session is primarily to eliminate waste by making incremental improvement to processes. The intimate knowledge held by workers is critical to the success of Kaizen sessions.
The Role Stabilization in the Toyota Production System In the lean system, even before there can be standardization there must be stability (Dennis, 2007).
The Toyota Production System emphasizes the importance of a stable
environment. Without a stable environment, any lean improvements would be swept away in the chaos of clutter, unpredictable breakdowns, and material fluctuations. Several key disciplines were integrated into the lean production system by Ohno to reinforce stability. 5-S, for example, is a visual management tool that is meant to eliminate clutter and helps to see what is out of place (Gapp, Fisher, & Kobayashi, 1998). In 5-S, there is a place for everything, and everything has its place. The power of 5-S comes from the fact that it is a visual tool: it can provide an assessment at a glance.
A person can see immediately if their environment is out of place
because a 5-S'ed environment has visual markers for the storage location of things.
Most
26 importantly, 5-S makes underlying problems apparent so they can be addressed . In this respect, 5-S is also a star1ing point for discovering and solving problems. A discipline meant to prevent unforeseen downtime is Total Productive Maintenance, or TPM (Black & Hunter, 2003).
In a Total Productive Maintenance environment, workers
themselves take responsibility for performing basic maintenance on the equipment they operate on a daily basis. This seemingly small contribution from the operators makes a big difference on the reliability of the equipment and most importantly to the overall stability of the operations. Breakdowns do not occur as often and operators can concentrate on adding value to the product instead of dealing with downtime due to unreliable equipment. Lastly, the practice of heijunka as a stabilizing discipline helps to level the demand on production (Liker, 2004; Rother & Shook, 1999). Firstly, the production mix is leveled to avoid making one large batch of one pali followed by another large batch of another pal1. Batching ultimately leads to hidden quality issues. In a lean operation, it is preferable to mix the type of pal1s produced by running small batches more frequently . Heijunka also means stabilizing the volume thus avoiding spikes in production. Instead of making the number of parts exactly as requested in the daily release schedule, the manufacturer should use historical demand data in order to make a daily average number of pa11s while keeping a standard inventory of pm1s.
27 At the Heart of the Toyota Production System At the heaIt of the Toyota Production System, there is one important idea: that people make all the difference.
Through their creativity and their engagement, workers provide the
driving force that sustains lean manufacturing (Dennis, 2007). Unlike in the mass production system, lean manufacturing personnel are involved in making decisions about the processes that they operate. In fact, the Toyota philosophy is to push down the responsibility for improving processes. Not only are plant workers encouraged to paIticipate in decision-making, they are expected to do so. Through process kaizens, associates engage in waste reduction, problem solving, and cost savings. Employee suggestion programs, for example, are a common way for employees to be involved in the improvement of the company.
Thus in a lean production
environment, all employees, even those doing repetitive work, are expected to think critically about their work and contribute to the continuous improvement of work standards. For this reason, some have called the Toyota Production System the Thinking Production System (Liker, 2004). Value Stream Mapping Value stream mapping was originated by Mike Rother and John Shook in collaboration with James Womack (Womack, 2006). Rother and Shook's value stream map idea was based on a similar a technique used by Toyota called in/ormation and materials jlovv diagrams.
In
configuring value stream maps, Rother and Shook intended to capture process information, materials flow, and information flow for a given product family. Although value stream maps were developed within the context of the automotive industry, they have become popular in other fields such as health care and the service sector.
28 The value stream mapping process begins with a map of the current state. The current state should faithfully depict the operations as they are happening at the present time (Rother & Shook, 1999).
Both value and non-value added steps are shown in, a value stream map.
Information flows also appear and are considered just as important as material flows. Icons are used to depict processes, material flows, and information flows. In addition, part accumulations in the fOlm of WIP, inventories, and safety stocks also appear in the value stream.
Special
alTOWS are used to depict "pull" or "push" production. In addition to icons, value stream maps also record lean metrics inside data boxes located beneath process icons. Data boxes typically include cycle times, changeover times, and travel distances.
The types of metrics used to
populate the data boxes are chosen according to the specifics of the value stream being mapped and the industry under consideration. In general, a timeline is also plotted along the bottom of the value stream to track metrics used for cumulative quantities such as total lead time, total travel distance, and total value added time. These cumulative quantities help to characterize the value stream and serve as a baseline for later comparison. The power of value stream mapping comes from its usefulness in integrating and representing all the important elements of the lean enterprise (Tapping, Luyster, & Shuker, 2002). Once the current state value stream map has been drawn, improvement oppo11unities can now be identified in a visual manner in conjunction with an assessment of the metrics. With respect to improving the current state value stream, Rother and Shook (1999) take the view that the main objective in a lean enterprise is simply for any process to only make what the next downstream process requires, within the sho11est lead-time, at the highest quality, and at the lowest cost.
To attain this lean objective, they identified the following lean principles for
achieving a lean future state value stream map (Rother & Shook, 1999, p. 44)
29 1. Produce to the takt time 2. Develop continuous flow wherever possible 3. Use supermarkets where continuous flow does not extend upstream 4. Send the customer schedule to only one production process: the pacemaker 5. Level the production mix 6. Create pull by releasing consistent increments of work at the pacemaker process 7.
Develop the ability to make every part every day. (p.44)
Extended Value Stream Mapping The extended value stream map goes a step further. In the extended value stream map, the flow of value is mapped from the supplying facilities through to the customer's facility (Womack & Jones, 2002). Transportation between supplying facilities and transpOliation to the customer's facility is considered. A closed loop supply network is formed with product moving down stream and demand moving upstream. The concept of extended value stream mapping does not require the practitioner to map the supply chain back to the extraction of raw materials from the ground. For practical purposes, the extended value stream map can be limited to the number of suppliers that are useful to the value stream manager (Drickhamer, 2003). Just as in facility value stream mapping, extended value stream mapping stalis with a representation of the CUlTent state. Since the flow of materials and information between facilities is the main consideration in extended value stream mapping, the focus of lean improvements shifts to addressing issues at interfaces between facilities.
These include minimizing
transpOliation between facilities and minimizing inventories of finished goods (Jones & Womack, 2002).
In order to achieve the goal of a lean extended value stream, Jones and
Womack (2002, p.43) proposed the following guidelines:
30
1. Produce at a rate that is consistent with the customer' s takt time 2. Keep minimal inventory 3. Minimize the number of transport links 4. Minimize the amount of information processing while ensuring clarity of available information 5. Minimize the lead time to deliver a product to the customer 6. Changes made to improve the extended value stream map should ideally have no associated cost or at worst have very little associated cost
Extended Value Stream: Future States When making improvements to an extended value stream, the very first step is to address the implementation of lean production in the individual facilities (Jones & Womack, 2002). Building a lean supply chain staris from the bottom up. Any company in the supply chain that is not prepared to implement lean within its own facility will be of little help in sustaining an extended value stream. The term future state I, therefore, describes the state of the supply chain when all suppliers have convelied to lean production within their own facilities. Future state II, on the other hand, deals with transportation and communications links between facilities. In their book Seeing the Whole, Jones and Womack (2002) recommend direct transportation links between upstream suppliers and downstream customers, instead of intermediate warehousing or cross-dock facilities. Moreover, just as with value stream mapping within a single facility, it is recommended that suppliers and customers be linked by a kanban type of information flow meant to establish a pull system between upstream suppliers and downstream customers. These are analogous to kanban loops within a facility. For instance,
31 large once-a-week batch loads should be replaced by milk runs whose transportation loops connect several facilities. Before achieving a Future state II, suppliers and customers must work cooperatively toward a lean extended value stream. It is critically important that suppliers and customers strive toward what Dolcemascolo (2006, p. 39) refers to as an "open book policy". customers need to disclose oppOliunities for improvements.
Suppliers and
Ultimately, this means cost
information may also have to be shared in order to select lean improvement projects that make sense for all. For example, if a supplier is buying raw material at a high price, but the customer can negotiate a lower price, then there is obviously an oppOliunity for improvement. Without disclosure of costs, this simple extended value stream improvement could not happen. This open book policy then leads to the possibility of re-drawing the extended value stream map on a collaborative footing. Only then can extended value stream maps be truly optimized. Beyond future state II, there is one last type of future state called the ideal state (Jones & Womack, 2002). In the ideal state, the overriding principle is to compress the value stream as much as possible while bringing the value stream closer to the end customer. This literally means bringing production operations geographically closer together as well as closer to the customer. This is similar to including all operations within a single workcell. Compressing the extended value stream and moving it closer to the customer, however, has to be balanced against the possibility that the customer may be located in a high cost region. In this case, moving operations may be undesirable due to labor costs in the high cost region.
Unless new labor
saving technologies can be used , moving to all operations to a high cost region cannot be a foregone conclusion. High local labor costs may well justify keeping supplier operations in a
32 lower cost region.
Striking this balance represents a major improvement opportunity for the
extended value stream.
Cooperation in Extended Value Streams Sharing the costs of investments is discussed in the literature as an element of extended value stream improvement that is sometimes necessary. The concept is simple. A supplier sells a product to a customer for a profit, despite the existence of waste in supplier's pOliion of the extended value stream.
In theory, value stream improvements should not cost anything to
implement (Tapping et aI., 2002). In practice, however, extended value stream improvements can often involve significant changes to manufacturing locations and equipment and therefore investments may be required. It is unlikely that a supplier will pay for these changes despite a positive return on investment. If the value stream improvements disproportionately benefit the customer rather than the supplier, it becomes even more unlikely that the supplier will make such investments.
In this scenario, the customer will need to assist the supplier in making the
necessary changes. Jones & Womack (2002) characterize this collaboration as the need to have the "winners compensate the losers" (p.73). This suggests that extended value stream thinking should occur early in the development of plant operations to avoid in-eversible non-lean extended value streams. It also suggests that changing economic conditions, like currency fluctuations, fuel price increases, and labor costs, should prompt the periodic review of extended value stream maps. Extended value stream mapping, therefore, provides a visual summary of how value travels between supplying facilities into the customer's facility.
In order to implement lean
production in the extended value stream it is necessary to have lean implemented in the individual locations first.
Using the principles developed in the Toyota Production System,
33 which seeks to eliminate waste, a lean future state for the extended value stream map can be achieved. The last step in improving the extended value stream is to consider the possibility of compressing the extended value stream and bringing it closer to the customer. between customer and suppliers is critical to realizing and Ideal State.
Cooperation
34
Chapter III: Methodology The purpose of this study was to implement lean improvements in the manufacturing operations of aluminum frames supplied by Framex Mexico to Universal's Michigan assembly plant.
Universal required that Framex implement a costs savings within six months of its
original request. Cost savings resulting from product changes were out of the question since Universal wanted to carryover the frame design into the new model year - also because of cost savings. This meant that process, logistics, and manufacturing locations all needed to be taken into consideration when Framex was investigating possible lean improvements.
The
methodology prescribed by Jones and Womack (2002) was adopted because it addressed the specific areas where Framex had to find cost savings. This chapter will identify the subject of the study in terms of an extended value stream. It will also identify value stream maps as the instrument used to collect data and analyze the extended value stream. Next, this chapter will demonstrate how lean principles discussed in the literature were used to generate improvement ideas for the extended value stream. Finally, an ideal state extended value stream map will be created by working through future states I and II, according to the methodology al1iculated by Jones & Womack (2002) in Seeing the Whole.
35 Subject of the Study The subject of the study was the extended value stream consisting of the Framex manufacturing facility located in Mexico and the transportation of aluminum frames up to Universal's pick-up truck assembly plant in Michigan. At the outset of the study, Framex was purchasing aluminum coils that were stamped into components PaIts (brackets, gussets, cross members, etc.) and then were welded into frame sub-assemblies. The three sub-assemblies were then bolted together and finally e-coated for corrosion protection. The frames assemblies were then put into containers and shipped via truck over to Laredo, Texas where a cross-docking operation took place. The containers were removed from the truck and transferred onto a train that would transpolt the frames the rest of the way to Michigan. Instrumentation The instrument used to study the extended value stream under investigation was the value stream map. Value stream maps are used to provide a visual representation of the value stream. Processes, material flows, and information flows appear on the value stream map. Extended value stream maps also include transpOlt link infOlmation as well as information about geographic locations. In addition, value stream maps also contain information about the takt time that sets the production pace for the value stream under investigation. In this study, the takt time is constant. Improvements to the extended value stream map had to conform to a constant takt time of 63.4 seconds, per appendix A. The value stream map is also used to collect lean metrics data, which quantifies the elements in a value stream. For example, value added and non-value added times were recorded for each process. Because it is a visual instrument, a value stream map is well suited for quick visual reference and efficient analysis. Furthermore, value stream maps also have a temporal
36 element. In general, a value stream will be represented either in a current state map or in a future state map. Extended value stream mapping methodology makes use of several future states: future state I, future state II, and finally the ideal state value stream map.
Data Collection The following lean metrics were selected in order to establish a method for evaluating and comparing the lean states of the extended value streams:
1. Lead times (days) 2. Value added time (seconds)
3. Process cycle efficiency (percentage)
4. Raw materials inventory (days) 5. Work in progress inventory (days)
6. Finished goods inventory (days) 7. Transportation distance (miles)
8. Transp0l1ation time (days) Standard data taken from work instructions was used to populate the value stream data boxes.
Cross-functional meetings that included production supervisors, logistics personnel ,
project managers, and sales personnel were held. The purpose of the meetings was to plan and implement the costs savings. Each member was responsible for validating the data obtained from documented sources. Once the data was compiled, the extended value stream maps were populated by entering the data into the data boxes in the value stream maps.
37
Data Analysis The lean principles discussed in the literature provided guidance in identifying lean improvements to both facility and extended value streams. Working meetings were held to bring together the team with the aim of bringing the extended value stream in line with lean principles as stated in Seeing the Whole (Jones & Womack, 2002).
The following lean principles for
extended value streams were used to drive improvements at every step of the way toward the ideal state: 1. Produce at a rate that is consistent with the customer's takt time 2. Keep minimal inventory 3. Minimize the number of transpOli links 4. Minimize the amount of information processing while assuring the clarity of available information 5. Minimize the lead-time to deliver a product to the customer 6. Changes made to improve the extended value stream map should ideally have no associated cost or at worst have very little associated cost The future state principles used to step through the progression of future state I, future state II, and finally the ideal state were: 1. Future state 1: implement lean production within the individual facilities 2. Future state II: install pull between facilities & install loops between facilities 3. Ideal state: geographically compress the value stream
Current state analysis (future state I). The analysis of the CUlTent state extended value stream map was conducted using lean principles.
The analysis of the current state began
immediately with a focus on improving transportation links i.e. working toward a future state II.
38 This is because the Framex facility had essentially implemented lean production. Therefore, in this study the CUlTent state and future state I are the same. The first step in the analysis of the current state was to create an extended value stream map. This allowed the team to locate the areas where the value stream was not lining-up with lean principles. The following key elements were identified as essential to building a current state extended value map : •
The transp011ation link between the aluminum supplier and Framex
•
The Framex Mexico facility
•
The transp011ation link between Framex Mexico and the inter-modal (truck-to-train) cross-dock at Laredo, TX
•
The transp011ation link between the cross-dock at Laredo and the Universal assembly plant in Michigan The current state extended value stream was consequently mapped with these elements as
shown on Figure 1.
Lean metrics data for each of the elements was obtained in order to
complete the value stream map.
The cross-functional team members obtained the data by
consulting and validating process documentation.
It was then handed over to the project
manager to populate the value stream map with the data. Obtaining the lean metrics data for the Framex facility, however, required an extra step.
A separate facility value stream map for
Framex Mexico (Figure 2) had to be created. Once again the data for the facility value stream map was provided by the cross functional team. Once the facility value stream map was created , the aggregate lean metrics were used in data box for Framex Mexico in the extended value stream map (Figure 1). The facility and the extended value stream maps were analyzed using lean principles.
39 The analysis yielded several key observations. The facility value stream map for Framex (Figure 2) showed that the value added time of 188 seconds relative to the lead-time of23.0123 days resulted in an extremely low process cycle efficiency of 0.0194%.
Looking fUliher
upstream within the Framex value stream, the team felt that the safety stocks of raw materials (10 days) and finished goods (10 days) were too high and that an oPPOliunity existed to improve process cycle efficiency by reducing inventory. However, getting rid of the safety stock would require management buy-in. The safety stocks were put in place to deal with unforeseen supply problems and rush orders that had occurred in the past year. The extended value stream map in Figure 1 made it clear that the transpOliation link between Framex and Universal had become a problem.
In response to urgent calls from
Universal, Framex had to fly material to Michigan six times in the last year. This transpOliation link included trucking, a cross-dock, and then rail transpOli. The team felt that the transpOliation lin1e between Framex and Universal was too unreliable and time consuming. The lead-time for that transpoliation link was 14 days, which was perceived by all to be essentially inventory on the road.
The cross-dock in particular had been a source of delays at customs.
When the
extended value stream was evaluated, the value added time of 118 seconds vs. the total lead-time for the extended value stream of 37 days resulted in a process cycle efficiency of 0.0121 %, worse than for the facility value stream.
CURRENT STATE.igx
..."
~.
Frarrex
00
MEXICAN HQ
..... 'TJ
;;J
3
(1)
x
2 ::s < (1)
Framex - Universal Current State Extended Value Stream Map
;;;
'" (")
c
~ ;:;.
!l..£.l.~
IN niT l ll.[ .!>TATE 1 FN:Jl.m r S.\R£ ~'ll'KiSED
TO BE Cc»."\T RTED TO
LEA'\' Il::('I)!;,,- :nOX A'\' .\S.\."\1i l'TIO:-; [); TI-lIS STlUY IS T1L\T TI ll' S [S ,\LItE.\DY
IN I'I... Kl : . TI IERH1)RE H.!Tl"RE ST,\TE 1 [STIlE CURREl'.T ST:\TE
on
Ei
ro x ro ::s (1)
0(1)
0-
< c(1)
INTER MODAl
'"
~~
on
@ 3'" 3
'"
"0
- --~
Distance Traveled: 556 rri.
VA/T'" 118.0seconds RM,., 1a.Od;
IMP
=3.0 day>
FG· 10.0 day> peE = 0.0194%
23.0d~ (118.0seconds)
I
TransportTirre:2d¥
------ ---- --
CHAN'GE
=< ;;;> £:.
reM
(1)
,
q ()
c
=l
(1)
;::. V>
5)" (D
:;;
co
x
w
:J
Transport Time: 7 days
'2)(JOAY
(1)
co
Distance Traveled: 2225 ml.
a. (1) a.
lant Time = 19 days Transport Time:::: 7.0 days RM= 10.0 days
-0
WIP =9.0 days
.ay
FG= 7.0 days traveled:::: 2225.0 miles
travel 0-0--0
v
\{
V-\
~ ~
Customer Demand: 100000 pieces per Year (Takt Time 63.4 seconds)
..." ~.
ALUMNUM COWANY M::XICO
:>
~
~.
~I
f
2' C ...., (1)
en ....
I
------D-----r
i
I
~
ro
/ /
ST AMPI NG
'"tJ
M ANUAL
TRANS FER
~
:> C (t)
,--v',---
,-----0----,,
5"",
TGlalCfT· 2 ~ Va.ocAdd. 2 ~~
,- OicnCIfICO T~
·a,., Add. ED S«ORb.
200 II.
W A :Ie 170 SCCOI'lC2t
r..t3rcoTr,wc/cd: BOn.
W I." 06CCond$ Dil.l:tTIC.(l Tr..... eIod: OU .
~
....
(t)
:>:>
3 3
:>:> "0
Vl
o
Customer Dem;,nd:
100000 plecos perVo"r (Ta1o:J Time 63.4 seconds) Framex
CANADA
~:::
Fr2Imcx~XICO


![[PDF] Download Value Stream Mapping: How to ... - Google Sites](https://m.moam.info/img/260x300/pdf-download-value-stream-mapping-how-to-google-si_6477447d097c474b228be22e.jpg)
![[PDF BOOK] Value Stream Mapping: How to Visualize ... - Google Sites](https://m.moam.info/img/260x300/pdf-book-value-stream-mapping-how-to-visualize-goo_6477284c097c4796708b6456.jpg)
![[PDF] Value Stream Mapping: How to Visualize Work ... - Google Sites](https://m.moam.info/img/260x300/pdf-value-stream-mapping-how-to-visualize-work-goo_64781de1097c474c228cc72d.jpg)