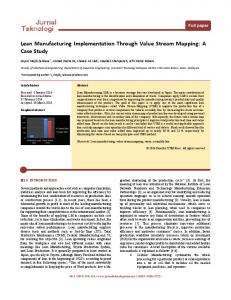
In this competitive world, manufacturing companies has to look at redefining and ... INTERNATIONAL JOURNAL OF INNOVATIVE RESEARCH & DEVELOPMENT ... The present work is carried out in XYZ manufacturing company in Bangalore for a .... Seth, D. and Gupta, V. , ''Application of value stream mapping for lean ...
www.ijird.com
May, 2014
Vol 3 Issue 5
ISSN 2278 – 0211 (Online)
Value Stream Mapping as a Tool for Lean Implementation: A Case Study Manjunath M. PG Scholar, Manipal Institute of Technology, Manipal, India Dr. Shivaprasad H. C. Professor, Manipal Institute of Technology, Manipal, India Keerthesh Kumar K. S. PG Scholar, Manipal Institute of Technology, Manipal, India Deepa Puthran PG Scholar, Manipal Institute of Technology, Manipal, India Abstract: The main purpose of the paper is to know how value stream mapping(VSM) is a powerful tool in lean implementation and to tackle the improvement areas from the current state & to propose the future state which helps in reducing the lead time, manufacturing cost and delivery in time without compromising for the quality of the product. VSM helps firms to understand and to improve continuously to work towards becoming lean enterprise. A case study was carried out in XYZ manufacturing company in Bangalore and comparison was made between current state and future state where the opportunity was identified for improvements. Key words: Lean manufacturing, Value stream mapping (VSM), Takt time, Current state, Future state, Work in process, Lead time 1. Introduction In this competitive world, manufacturing companies has to look at redefining and redesigning of their production systems to attack the competitiveness demanded by the markets [1]. Therefore it is essential to have tools which help in redesign manufacturing process [2]. In this scenario, developed and presented value stream mapping tool as a practical method for redesigning the production systems [3].The main aim of lean manufacturing is to reduce waste, time to delivery, produce the quality products with economical and efficient manner with response to customer demand. The organizations which are practicing lean manufacturing have quality & cost advantages compared to the organizations that are still using traditional production. The VSM process is straight forward and simple. It always starts at customer demand and work back through documenting all the process and collecting data which is required for manufacturing of a product. It shows the map “Value stream” containing all the data such as work in process, cycle time, lead time, number of equipment’s, operators. Documenting relationship between the controls used to manage the manufacturing process is very important in VSM. Unlike other mapping techniques that only map product flow, VSM documents material & information flow. 2. Literature review Tools such as visual control, single-piece flow, Kaizen, Poka yoke, Standard WIP, Cellular manufacturing, 5s, scrap reduction to reduce manufacturing waste are used in Lean manufacturing. To become lean enterprise VSM is the best tool [6].VSM is defined as a power ful tool that guides in improvements but also highlights communication and transactional mismatches, inefficiencies in process [3].Value stream is the collection of value added and non-value added activities that provides graphical view of the elements in a process which customer is willing to pay. VSM is defined as ‘‘the simple process of directly observing the flows of information and materials as they now occur, summarizing them visually, and then envisioning a future state with much better performance’’ [8,9]. An attempt has been made to expand VSM for entire supply chain by [14].From VSM an attempt made to develop lean logistics strategy by [15]. A successful approach had made to use VSM as a lean tool to achieve improvement in productivity in automotive industry by [10, 16 and 17].Many researchers contributed for improvement of the supply chain process in an organization using VSM. New value stream tools are emerging due to growing of complexity in manufacturing.Many tools in lean manufacturing have been developed and are in process to support value stream [10, 11, 12, and 13]. Table 1 shows the major contributions in VSM.
INTERNATIONAL JOURNAL OF INNOVATIVE RESEARCH & DEVELOPMENT
Page 477
www.ijird.com
May, 2014
Major contributors Monden (1993) Jessop and Jones (1995)
Hines et al. (1998); Hines (1999); Grewal andSareen (2006); Grewal and Singh (2006)
Brunt (2000); Abdulmalek and Rajgopal (2007); Seth et al. (2008); McDonald et al. (2002) Emiliani and Stec (2004) Mcmanus and Millard (2002) Seth and Gupta (2005) Snyder et al. (2005) Seth et al. (2008)
Faisal et al. (2006)
Klotz et al. (2008)
Lasa et al. (2008)
Vol 3 Issue 5
Area of work Defined value from customers’ viewpoint Developed tools to understand different value streams and their overlapping nature Identification and elimination of muda
Improved productivity of process industry
Leadership development Product development (PD) Productivity improvement at supplier end Health care center Address various wastes in the supply chain of the edible cottonseed oil industry Mapped supply chains on these two dimensions risk and customers satisfaction Explained impact of process mapping on transparency in an employee training session VSM is a valuable tool for redesigning the productive systems Table1: Major contributions to the field of VSM
3. Current State Map The present work is carried out in XYZ manufacturing company in Bangalore for a particular product. The current state map is done with paper and pencil using different VSM symbols to represent pictorial view of information and material flow as product move through production line. Mapping is done based on lean manufacturing principles which are backbone of VSM [16]. All the data required for mapping current state is collected by taking walk across the production line, consulting employees, supervisors and managers. Fig 1 shows the current state map of an assembly line. The demand per week of product is 50.Number of working days per week is 5.5 days. Shifts per day are 3 and working hours per shift is 6.23 hours. Takt time = Available time per shift Customer demand = 6.23*3*5.5/50 = 2.05hrs Demand comes from customer to planning team & the material required for manufacturing of products is sent to supplier through electronic media. Production planning is done based on customer demand by production team. The different process in assembly line is shown in current state map. Data box in map shows cycle time, Takt time, number of operators, number of equipment and number of shifts. It provides information of inventory in between the process which is shown in triangle symbol. The bottom of the map shows the time line consisting of value added and the lead time. The current state map is existing state of the assembly line and helps in identifying problems which will be helpful in improvement of the current state. 4. Current State Analysis Data required for analysis of current state of the assembly line are obtained from the VSM of current state from figure 1.The processing time or value adding time is 16.93 Hrs and production lead time is 63.82 Hrs, an inventory of 31 units as shown in figure 1. There is great opportunity to reduce lead time, process inventory, to maintain a standard WIP (SWIP) and single piece flow.
INTERNATIONAL JOURNAL OF INNOVATIVE RESEARCH & DEVELOPMENT
Page 478
www.ijird.com
May, 2014
Vol 3 Issue 5
Figure 1: Current state VSM 5. Future State Map After analyzing the current state, improvement areas are identified using kaizen bursts which will lead to reduce process time as shown in Figure 2. The water spider was asked to change from shift wise supply of material to supply based on hourly demand. It was always a push system where the worker at Process A has to wait for material must be replaced by pull system to reduce the inventory, to reduce waiting timeand to maintain single piece flow with the help of Kanban system. To synchronize Takt time with cycle time the layout has to be changed, some activities should be eliminated which will not add value to the process by implementing Kaizens. In Process A the cycle time can be reduced from 93minutes to 67 minutes with the help of changing nonlinear work station to conveyor work station.The proposed future state is shown in figure 3.
Figure 2: Comparison between Current state and Future state Process time
Figure 3: Proposed Future state VSM 6. Future State Analysis From Figure 4it can be seen that the process inventory is reduced from 31 to 16 units. The lead time is reduced from 63.82Hrs to 39.43 Hrs, process time from 16.93Hrs to 16.48Hrs. The comparison of current lead time & future lead time and current inventory & future inventory is shown in figure 5 and 6 respectively. By implementing this proposed future state the high demand can be met as well as it leads to significant changes in reducing the cost at XYZ Company which will be in position to delivery at without comprising in quality & at lower production cost. When process layout is changed from nonlinear to conveyor system layout and by implementing Kaizens the Takt time can be synchronized with cycle time at Process A. The other improvements shown in figure 3 can be taken on priority depending on the requirements.
INTERNATIONAL JOURNAL OF INNOVATIVE RESEARCH & DEVELOPMENT
Page 479
www.ijird.com
May, 2014
Vol 3 Issue 5
Figure 4: Comparison between Current state and Future state
Figure 5: Comparison of Current state & Future state lead time
Figure 6: Comparison of Current state& Future state inventory 7. Conclusion It is proven that VSM is a powerful tool in lean manufacturing which helps firms to understand and to improve continuously to work towards becoming lean enterprise .It connects people, process, tools and even documents required data to achieve lean goals. It delivers clear communication between shop floor teams and management regarding lean outlooks. In this paper current state and future state is compared of a manufacturing firm and observed that reduction of 38.2 percent in lead time, process time reduction by 2.65percent, and 48.3 percent reduction in inventory. 8. References 1. European Commission,Manufuture,a Vision for 2020. Assuring the Future of Manufacturing in Europe, European Commission, Luxemburg, 2004. 2. Marchwinski, C.,State of Lean Report 2004, web document, available at: www.lean.org 3. Rother, M. and Shook, J., “Learning to See: Value Stream Mapping to Add Value and Eliminate Muda”, Lean Enterprise Institute, Cambridge, MA,1998. 4. Womack, J.P. and Jones, D.T. ,”Lean Thinking. Banish Waste and Create Wealth in your Corporation”, Touchstone Books, London,1996.
INTERNATIONAL JOURNAL OF INNOVATIVE RESEARCH & DEVELOPMENT
Page 480
www.ijird.com 5. 6. 7. 8. 9. 10. 11. 12. 13. 14. 15.
16. 17. 18.
May, 2014
Vol 3 Issue 5
Fleischer, M. and Liker, J.K., Concurrent Engineering Electiveness, Hanser Gardner, Cincinnati,OH,1997. Russell, R.S. and Taylor, B.W., Operations Management, 2nd ed., Prentice-Hall, Upper Saddle River, NJ,1999. Tapping, D. and Shuker, T., Value Stream Management for the Lean Office, Productivity Press, New York, NY,2003. Voelkel, J.G. and Chapman, C., ‘‘Value stream mapping’’, Quality Progress,2003 Vol. 25 No. 5,pp. 65-8. Womack, J. and Jones, D.T.,‘‘From lean production to lean enterprise’’, Harvard Business Review,1994, pp. 93-103. Taylor, D. and Brunt, D. , Manufacturing Operations and Supply Chain Management: The Lean Approach, Thomson Learning, London,2001. Dillon, A., The Sayings of Shigeo Shingo: Key Strategies for Plant Improvement, Productivity Press, Cambridge, MA,1985. Fleischer, M. and Liker, J.K., Concurrent Engineering Electiveness, Hanser Gardner, Cincinnati, OH,1997. Cusumano, M.A. and Nobeoka, K., Thinking Beyond Lean, Free Press, New York, NY,1998. Brunt, D., ‘‘From current state to future state: mapping the steel to component supply chain’’, International Journal of Logistics: Research and Applications,2000, Vol. 3 No. 3, pp. 259-71. Gallone, P. and Taylor, D., ‘‘From value stream mapping to the development of lean logistics Strategy: a case study’’, in Taylor, D. and Brunt, D. (Eds), Manufacturing Operations and Supply Chain Management: the Lean Approach, Thomson Learning, London, 2001. Seth, D. and Gupta, V. , ‘‘Application of value stream mapping for lean operations and cycle time reduction: an Indian case study’’, Production Planning and Control, 2005,Vol. 16 No. 1, pp. 44-59. Lamming, R., Johnsen, T., Zheng, J. and Harland, C., ‘‘An initial classification of supply networks’’, International Journal of Operations and Production Management,2000, Vol. 20, pp. 675-91. Bhim Singh and S K Sharma, “Value stream mapping as a versatile tool in lean implementation: an Indian case study of a manufacturing firm”, Measure of Business Excellence,2009, Vol 13 No 3, pp 58-68.
INTERNATIONAL JOURNAL OF INNOVATIVE RESEARCH & DEVELOPMENT
Page 481