Journal of Educational Psychology 2007, Vol. 99, No. 4, 808 – 820
Copyright 2007 by the American Psychological Association 0022-0663/07/$12.00 DOI: 10.1037/0022-0663.99.4.808
Learning by Doing Versus Learning by Viewing: Three Experimental Comparisons of Learner-Generated Versus Author-Provided Graphic Organizers Andrew T. Stull and Richard E. Mayer University of California, Santa Barbara Do students learn more deeply from a passage when they attempt to construct their own graphic organizers (i.e., learning by doing) than when graphic organizers are provided (i.e., learning by viewing)? In 3 experiments, learners were tested on retention and transfer after reading a passage with authorprovided graphic organizers or when asked to construct graphic organizers. In Experiment 1 (highest complexity), there were 27 author-provided graphic organizers or margin space for constructing graphic organizers. In Experiment 2 (intermediate complexity), there were 18 author-provided graphic organizers or 18 corresponding graphic organizer templates. In Experiment 3 (lowest complexity), there were 10 author-provided graphic organizers or 10 corresponding graphic organizer templates. On transfer, the effect size favored the author-provided group (Experiment 1: d ⫽ 0.24, ns; Experiment 2: d ⫽ 0.43, p ⬍ .05; Experiment 3: d ⫽ 0.84, p ⬍ .01). On retention, there were no significant differences. These results are consistent with cognitive load theory, which posits that excessive activity can create extraneous cognitive load, disrupting generative processing. These results are not consistent with activity theory, which posits that students learn by doing. Keywords: graphic organizer, cognitive load, generative processes, reading comprehension
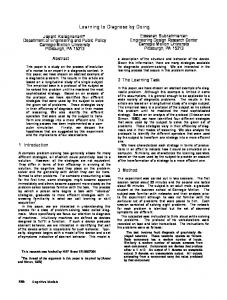
A more obvious approach to promoting learning is to ask learners to create their own graphic organizers, on the basis of pretraining in how to create common structures, such as hierarchies, lists, flowcharts, and matrices, such as exemplified in the bottom panel of Figure 1. When students construct their own graphic organizers, they are challenged to think deeply about how to select and organize the text into coherent structures. We refer to this process as learning by doing, and the treatment can be called learner-generated graphic organizers. Learning by doing (with learner-generated graphic organizers) appears to be an active treatment in that it is intended to induce generative processing in learners by challenging them to select and organize information from the text as they actually construct something new—a graphic organizer. However, learning by doing may also require the learner to engage in extraneous cognitive processing1 (Mayer & Moreno, 2003; Sweller, 1999).
Suppose a student is reading a biology textbook that contains a 1,133-word section on reproductive barriers, such as exemplified in the top left panel of Figure 1. What can be done to help the learner process the material more deeply—that is, engage in generative processing (Mayer, 2005; Sweller, 1999; Wittrock, 1974)—so he or she will perform better on subsequent tests of problem-solving transfer? One common approach is to include graphic organizers that provide a spatial arrangement of some of the key material in the text, such as exemplified in the top right panel of Figure 1.
Two Ways to Induce Generative Processing of Scientific Text Providing graphic organizers can induce students to engage in active learning, because they must think about how a linear text can be converted into a spatial structure such as a hierarchy or a flowchart—that is, they must verify how material in the graphic organizer was selected and organized from the original text. We refer to this process as learning by viewing, and the treatment can be called author-provided graphic organizers. Even though learning by viewing (with author-provided graphic organizers) appears to be a passive treatment, it can induce generative cognitive processing in learners when they seek to understand how the linear text was selected and organized to fit into the spatial structure of the graphic organizer.
Two Theoretical Frameworks Table 1 summarizes the rationale for author-provided graphic organizers on the basis of cognitive load theory and the rationale for learner-generated graphic organizers on the basis of activity 1 Extraneous processing is cognitive processing during learning that does not support the construction of knowledge and is caused by poor instructional design—that is, design features of the instructional message cause the learner to engage in cognitive processing that does not support learning. Although we do not have direct measures of generative and extraneous processing during learning in these studies, we use transfer test performance as an indirect measure. In short, higher transfer test performance is an indication of less extraneous processing and more generative processing during learning (Mayer, 2001, 2005).
Correspondence concerning this article should be addressed to Andrew T. Stull or Richard E. Mayer, Department of Psychology, University of California, Santa Barbara, CA 93106-9660. E-mail:
[email protected] or
[email protected] 808
GRAPHIC ORGANIZERS
Figure 1. Three graphic organizer treatments. Of the four graphic organizer forms represented in the authorprovided example (top right panel), the first and second are hierarchies, the third is a list, and the fourth is a flowchart. Of the three graphic organizer forms represented in the learner-generated example (bottom panel), the first is a hierarchy, the second is a list, and the third is a flowchart. Text in the left column of each panel is from Biology: Concepts and Connections (4th ed., p. 284), by N. A. Campbell, J. B. Reece, L. G. Mitchell, & M. R. Taylor, 2003, San Francisco: Benjamin Cummings. Copyright 2003 by Pearson Education, Inc. Used by permission of Pearson Education, Inc.
809
STULL AND MAYER
810
Table 1 Comparison of Two Theories of Graphic Organizer Design Theory
Author provided
Learner generated
Cognitive load
Providing graphic organizers decreases the level of extraneous cognitive processing and allows generative processing.
Generating graphic organizers increases the level of extraneous cognitive processing and limits generative processing.
Activity
Providing graphic organizers does not encourage generative processing.
Generating graphic organizers encourages generative processing.
theory. What is the rationale for learning by viewing? Cognitive load theory and the cognitive theory of multimedia learning are based on the idea that humans have limited cognitive capacity but that meaningful learning requires learners to engage in appropriate cognitive processing during learning (Chandler & Sweller, 1991; Mayer, 2001, 2005; Mayer & Moreno, 2003; Sweller, 1999, 2005). These cognitive processes include attending to relevant information, mentally organizing the selected information into a coherent structure, and mentally integrating the incoming information with existing knowledge. The triarchic theory of cognitive load proposes three kinds of cognitive processing during learning: extraneous processing, in which the learner engages in cognitive processing that is not related to the instructional goal and that is caused by ineffective instructional design; essential (or intrinsic) processing, in which the learner mentally represents the material and which is determined by the inherent complexity of the material; and generative (or germane) processing, in which the learner mentally engages in deeper cognitive processing of material, such as organizing and integrating the selected material with the desire to understand the lesson. According to cognitive load theory, author-provided treatments can encourage learners to engage in generative processing by challenging them to see how the linear text was converted into a graphic organizer through selecting relevant text and organizing it into a coherent structure (Mayer, 2005; Mayer & Moreno, 2003; Sweller, 2005). In addition, when the scaffolding of graphic organizers is provided, learners are less likely to waste precious cognitive capacity on extraneous processing—which thereby reduces cognitive load and frees up capacity for essential and generative processing. Reducing extraneous processing (by not asking learners to generate graphic organizers) does not necessarily encourage generative processing but rather frees cognitive capacity that can be used for generative processing (which is primed by authorprovided organizers). In contrast, the learner-generated treatment creates extraneous cognitive processing in which learners must focus on the mechanics of how to create graphic organizers, thereby leaving less available capacity for essential and generative processing (Mayer, 2005; Mayer & Moreno, 2003; Sweller, 2005). Thus, both author-provided and learner-generated treatments encourage generative processing in learners, but the level of extraneous processing is higher with learner-generated treatments, which leaves less remaining capacity for generative processing. The rationale for learning by viewing, on the basis of cognitive load theory, is summarized in the top row of Table 1. Cognitive load theory predicts that reading a text with author-provided graphic organizers will lead to deeper learning than reading a text with learner-generated graphic organizers. This pattern should be strongest for measures of deep learning—such as problem-solving
transfer—and when the level of complexity of the treatment is not overwhelming, so there is capacity available to engage in generative processing. What is the rationale for learning by doing? Activity theory is based on the idea that deep learning occurs when students are encouraged to engage in productive learning activities (de Jong, 2005; Kirschner, Sweller, & Clark, 2006; Klahr & Nigam, 2004; Lillard, 2005; Mayer, 2003, 2004). Constructing a graphic organizer can be considered a productive learning activity because the learner must engage in an activity that is related to the instructional objective—selecting relevant ideas from the text and organizing them into a coherent structure. According to activity theory, learner-generated graphic organizers encourage generative processing, whereas author-provided graphic organizers do not. The rationale for learning by doing, on the basis of activity theory, is summarized in the bottom row of Table 1. Activity theory predicts that students who read a scientific text in which they generate their own graphic organizers will perform better on retention and transfer tests than students who read the same text along with authorprovided graphic organizers. Even though learning by doing appears to be an active treatment, it can inhibit generative cognitive processing if learners become confused as to how to carry out the task. The complexity of the activity may create extraneous cognitive processing— cognitive processing that is not relevant to the goal of instruction—which reduces the amount of cognitive capacity available for generative processing.
Review of Research on Graphic Organizers A graphic organizer consists of spatial arrangements of words (or word groups) intended to represent the conceptual organization of text. This definition consists of three parts: (a) Elements in a graphic organizer are words or word groups, (b) relations among elements are indicated by the spatial arrangement of the elements on the page, and (c) the graphic organizer represents the conceptual organization of a text. This definition is broad enough to include concept maps (Novak & Gowin, 1984), knowledge maps (O’Donnell, Dansereau, & Hall, 2002), hierarchies (Cook & Mayer, 1988), matrices (Kiewra, Kauffman, Robinson, Dubois, & Stanley, 1999; Robinson, 1998), flowcharts (Chambliss & Calfee, 1998), and even outlines (Balluerka, 1995) or lists (Cook & Mayer, 1988) when they offer a spatially arranged organization of elements using blank space. Graphic organizers have been used as reading adjuncts to promote comprehension (DiCecco & Gleason, 2002; Dunston, 1992; Griffin & Tulbert, 1995; Robinson, 1998; Vekiri, 2002), as notetaking aids (Katayama & Crooks, 2003; Katayama & Robinson,
GRAPHIC ORGANIZERS
2000), as help for students with learning disabilities (DiCecco & Gleason, 2002; Horton, Lovitt, & Bergerud, 1990; Kim, Vaughn, Wanzek, & Wei, 2004), as aids for mathematic problem solving (Ives & Hoy, 2003), as a way to assess a learner’s understanding (Kinchin & Hay, 2000; Liu, 2004; Ruiz-Primo & Shavelson, 1996), as a way to assess a teacher’s training (Mclay & Brown, 2003), as intervention tools for drug addiction treatment (Czuchery & Dansereau, 1999; Dansereau, Joe, & Simpson, 1993), and as business management tools (Wexler, 2001). In this study, we distinguish between author-provided and learner-generated graphic organizers. Providing learners with graphic organizers has been suggested to benefit learners by more accurately and coherently representing expert knowledge (Rewey, Dansereau, Skaggs, Hall, & Pitre, 1989; Robinson & Kiewra, 1995) and by focusing learners on the integrated concepts rather than the disconnected facts (R. H. Hall, Hall, & Saling, 1999; O’Donnell et al., 2002). Author-provided graphic organizers are descended from advance organizers, which originally were prose passages (Ausubel, 1968) in the 1960s and later were adapted to include graphics (Mayer, 1979; Vekiri, 2002). A potential limitation of providing graphic organizers is that they might offer unnecessary complexity that may overwhelm the learner or confuse the learner with knowledge structures that are in conflict with his or her own. By contrast, learner-generated graphic organizers are suggested to be of benefit because they promote generative learning (V. C. Hall, Bailey, & Tillman, 1997; Katayama & Robinson, 2000), more accurately reflect the learner’s understanding (McCagg & Dansereau, 1991), promote deeper processing during construction (Alvermann, 1981), allow instructors to assess and correct a learner’s misconception, and promote better connections with existing memory (Kiewra, DuBois, Christian, & McShane, 1988; Kiewra et al., 1991). Conversely, it has been suggested that constructing graphic organizers requires extensive training (McCagg & Dansereau, 1991), is cognitively demanding (R. H. Hall & Sidio-Hall, 1994), and demands significant intervention on the part of the instructor to correct misconceptions or to direct learners floundering with an unfamiliar technique or with new information (Robinson, Corliss, Bush, Bera, & Tomberlin, 2003). Most of the previous research investigated the conditions under which graphic organizers are effective. Significant contributions of specific graphic organizer forms have been made for concept maps (Novak & Gowin, 1984), knowledge maps (O’Donnell et al., 2002), matrices (Robinson, 1998), and various other visual organizers (reviewed by Vekiri, 2002). Major reviews of the literature have been conducted by DiCecco and Gleason (2002), Dunston (1992), Griffin and Tulbert (1995), Moore and Readence (1984), and Robinson (1998). Research studies suggest that graphic organizers may facilitate learning by helping learners organize and integrate information taken from expository text (Alvermann, 1981; Robinson & Kiewra, 1995). Learners are able to build useful visual aids from descriptive text (V. C. Hall et al., 1997) and sometimes recall more information when asked to construct graphic organizers (Diekhoff, Brown, & Dansereau, 1982). Learners may benefit from completing graphic organizers from scratch (Diekhoff et al., 1982) or from simply completing partial graphic organizers (Katayama & Robinson, 2000). Graphic organizers can promote recall of knowledge, but some cognitively demanding activities may inhibit knowledge
811
transfer (Kiewra et al., 1991) or both the recall and the transfer of information (R. H. Hall & Sidio-Hall, 1994). In summary, these studies suggest a trade-off between the effects of generative processes and cognitive load in the design and application of graphic organizers. Some forms of graphic organizer treatments can prime learners to want to engage in generative processing, but some forms may force learners to engage in extraneous cognitive processing that prevents them from engaging in generative processing. The challenge for instructional designers is to identify the conditions under which a graphic organizer treatment will prime adequate generative processing without creating the need for excessive extraneous processing. In the present set of three experiments, students read a 1,133word passage from a biology textbook that was augmented with graphic organizers (author-provided group) or was augmented by the request that students generate or fill in words for graphic organizers during learning (learner-generated group). The present study provides an advance over previous research by comparing the relative merits of author-provided and learner-generated graphic organizers using multiple dependent measures—including identical retention and transfer tests in all three experiments—and under a variety of conditions—ranging from the highest complexity in Experiment 1 to the lowest complexity in Experiment 3. The treatments in Experiment 1 represent the highest complexity because the author-provided group received 27 graphic organizers containing 506 words, whereas the learner-generated group was asked to produce graphic organizers from scratch (on the basis of pretraining in generating graphic organizers). The treatments in Experiment 2 represent intermediate complexity because the author-provided group received 18 graphic organizers, and the learner-generated group received the same 18 graphic organizers with a total of 44 empty slots for learners to fill in during reading. The treatments in Experiment 3 represent the lowest complexity because the author-provided group received 10 graphic organizers, and the learner-generated group received the same 10 graphic organizers with a total of 28 empty slots to fill in during reading.
Experiment 1 (Highest Complexity) The purpose of Experiment 1 was to test whether students better understand a scientific passage when they are asked to generate graphic organizers (following pretraining in how to generate hierarchies, lists, flowcharts, and matrices) in spaces in the margin or when the passage contains author-provided graphic organizers. In Experiment 1, participants read a 1,133-word passage about a topic in biology that was augmented by 27 author-provided graphic organizers (author-provided group), participants constructed their own graphic organizers from scratch (learner-generated group), or participants did not receive or construct graphic organizers (control group). Our primary focus is on comparing the authorprovided group and the learner-generated group on measures of understanding.
Method Participants and design. The participants were 156 college students recruited from the psychology participant pool at the University of California, Santa Barbara. The study was based on a between-subjects design, with three levels of graphic organizer use
812
STULL AND MAYER
(author provided, learner generated, and control) as the single factor. Fifty-one students served in the author-provided group, 51 students served in the learner-generated group, and 54 students served in the control group. The mean age was 19.4 years (SD ⫽ 1.5), the percentage of men was 29.5%, and the mean SAT score was 1184.5 (SD ⫽ 161.4). Materials. The paper materials consisted of a participant questionnaire, two pretraining documents (author-provided and learnergenerated versions), three reading passages (i.e., author-provided, learner-generated, and control versions), six short-answer test sheets (one retention and five transfer questions), and eight sentence-completion (all retention questions) test sheets, each printed on an 8.5 ⫻ 11 in. (21.25 ⫻ 27.5 cm) sheet of paper. The participant questionnaire solicited basic demographic information, including the participant’s age, sex, and SAT scores. The full version of the pretraining document was developed for the author-provided and learner-generated group, and the control version of the pretraining document was developed for the control group. The full version of the pretraining document consisted of a two-page document printed on facing pages. The left page described and illustrated four types of graphic organizer (concept list, concept hierarchy, concept flowchart, and compare-and-contrast matrix). The right page contained a four-paragraph reading passage laid out in a two-column design. The left column contained the biology text, and the right column contained each of the four types of graphic organizer, horizontally aligned with the matching type description on the left page. The reading material was extracted from a popular college-level general biology textbook, then edited slightly to meet the desired page format as well as to remove external references, but without altering the booklike style or the author’s voice in the source material. The passage described three biologically important polysaccharide molecules—starch, glycogen, and cellulose. The control version of the pretraining document contained the identical biology text from the left column of the right page but not the left page describing and illustrating the graphic organizers or the integrated graphic organizers from the right column of the right page. These modifications were made without alteration to the text layout, so the right column was empty. The control version of the reading passage consisted of six pages containing 1,133 words organized into 12 paragraphs, with three figures containing four black-and-white photographs. The three figures with four photographs were required to augment the written descriptions and to maintain the booklike character of the material. The page layout matched the two-column design used in the pretraining document. The material was extracted from the same textbook used for the pretraining to maintain a consistent voice and character between the readings. The material described eight reproductive barriers between species (temporal, habitat, gametic, behavioral, mechanical, hybrid inviability, hybrid sterility, and hybrid breakdown) and was divided into two barrier groups (prezygotic and postzygotic). The author-provided version used the identical text, figures, and illustrations but included 27 graphic organizers, each placed in the margin near the corresponding text. One concept hierarchy graphic organizer augmented the introductory paragraph. Each of the eight reproductive barriers was described by a single paragraph and augmented with three graphic organizers (one hierarchy, one list, and one flowchart). A hierarchy graphic organizer and a matrix augmented the conclusion. The
learner-generated version was identical to the author-provided version except that all graphic organizers were removed, which left space for learners to construct their own graphic organizers. The version used by the control group was identical to that used by the learner-generated group. Example pages of the three versions are shown in Figure 1. The six short-answer test sheets and the eight sentencecompletion sheets each had a question printed at the top of the page, and at the bottom of each sheet were printed the following instructions: “Please keep working until you are asked to stop. Do not go back to any previous questions.” The eight sentencecompletion questions (eight retention questions) are presented at the top of the Appendix, and the six short-answer test questions (one retention and five transfer questions) are presented at the bottom of the Appendix. Procedure. Participants were tested in groups of 1 to 5 and randomly assigned to one of the three graphic organizer treatment groups. Each participant was seated in an individual cubicle. First, participants were asked to read and sign an informed consent form, followed by a participant questionnaire to be completed at their own rate. Then they were given oral instructions to carefully read the pretraining document (with control participants receiving the control version and all other participants receiving the full version). In the author-provided group, participants were instructed to compare the descriptions and illustrations of the four types of graphic organizer with the illustrated example on the facing page. In the learner-generated group, participants were instructed to compare the descriptions and illustrations of the four types of graphic organizers with the illustrated example but also told that they would be asked to construct their own graphic organizers. The training lasted approximately 5 min and was intended to familiarize learners with each of four types of graphic organizers—list, hierarchy, flowchart, and matrix— by providing definitions and examples. In the control group, participants were only asked to read the passage but were not provided with or informed about graphic organizers. Participants were asked to stop reading at the end of 5 min, which proved to be more than adequate for the task. Next, participants were given further oral instructions that described the reading assignment, which they could complete at their own pace. These instructions asked the participants to read the material carefully and to be aware that questions about the reading would follow. In the learner-generated group, participants were told that they could construct their own graphic organizers in the margins of the page as they read the material and were informed that this might help them understand the material. Participants in the author-provided group and the control group were not instructed to generate graphic organizers during reading and did not generate any graphic organizers. The time to complete the reading was recorded for each individual. When all participants were finished reading the material, the stack of six short-answer test sheets was passed out. Participants were given oral instructions to work only on the top sheet, to keep working until they were asked to stop, and not to turn to the next sheet until asked to do so. Participants were carefully monitored for compliance. At the end of 3 min, participants were asked to immediately stop working on the current question, turn that sheet face down onto a finished stack, and begin the next sheet. After the last short-answer question, participants were given oral instructions that described the sentence-completion questions, which followed the same proce-
GRAPHIC ORGANIZERS
dure as the short-answer questions except that participants were given 1 min to answer each question. The short-answer and sentence-completion questions were presented in the order listed in the Appendix. After the last sentence-completion question, all material was collected, and the participants were debriefed and excused.
Results and Discussion Scoring. We computed the retention score for each participant by tallying the score for the first short-answer question (worth a maximum of 4 points) and the score for each of the eight sentencecompletion questions (worth a maximum of 16 points). On the short-answer retention question, participants received 1 point for mentioning each of four concepts: (a) prezygotic barrier with (b) before fertilization and (c) postzygotic barrier with (d) after fertilization. On each sentence-completion question (worth a maximum of 2 points each), the participant received 1 point for writing the correctly spelled term for the appropriate reproductive barrier and 1 point for the correct prefix for the barrier subgroup— prezygotic or postzygotic. The correct answers to the eight sentence-completion questions listed in the Appendix are (a) temporal and pre, (b) habitat and pre, (c) gametic and pre, (d) behavioral and pre, (e) mechanical and pre, (f) hybrid viability and post, (g) hybrid sterility and post, and (h) hybrid breakdown and post. Partial terms (e.g., hybrid or sterility instead of hybrid sterility), parallel concepts (e.g., time instead of temporal or geographic instead of habitat), and incorrect spellings (e.g., pro instead of pre) were not acceptable answers. Partial credit was awarded if participants provided only one of the two correct terms. Each participant could earn a maximum of 16 points on the eight sentence-completion questions and 4 points on the short-answer retention question, for a total possible of 20 points on the retention score. We computed the transfer score for each participant by tallying the individual scores on each of the five short-answer transfer questions—short-answer questions 2 through 6 are listed in the Appendix. We scored each question by counting the unique concepts presented in the reading that were used appropriately by the participant to address each question. Acceptable concepts included the 10 specific reproductive barrier concepts: (a) prezygotic, (b) postzygotic, (c) temporal, (d) habitat, (e) gametic, (f) behavioral, (g) mechanical, (h) hybrid inviability, (i) hybrid sterility, and (j) hybrid breakdown. In addition, two general concepts were also counted: (a) crossing organisms to test whether reproduction was possible or recognizing that two species might have crossed to form a hybrid, and (b) mentioning that reproductive barriers may be relevant to the explanation. Participants were allowed to describe the concepts with partial terms and parallel concepts, and misspelled terms were not counted as wrong. One point was awarded for each of the 12 concepts, for a maximum of 12 points per question. A second person scored all material. The interrater reliability measure was significantly correlated between these two scores (r ⫽ .826, p ⬍ .001). Discrepancies in the scores between these two scorers were individually evaluated in a blind, third review, which was used to determine the final score. Data analysis. Data were analyzed with one-way analyses of variance comparing the performance of the three treatment groups on each of the dependent measures—transfer score, retention
813
score, and study time. Our major focus was on comparing the author-provided and learner-generated groups, so for each dependent measure we conducted planned contrasts on the mean scores of these groups and computed the corresponding effect size on the basis of Cohen’s d (Cohen, 1988).2 Table 2 lists the mean and standard deviation of each of the three treatment groups on each of the three dependent measures. Do readers who generate their own graphic organizers while reading a scientific passage learn better than readers who are given author-provided graphic organizers? The top left portion of Table 2 summarizes the mean transfer scores of the three groups in Experiment 1. There was not a significant effect of treatment on transfer scores, F(2, 153) ⫽ 1.32, MSE ⫽ 10.15, and the authorprovided group did not differ significantly from the learnergenerated group, t(153) ⫽ 1.30, d ⫽ 0.24. There is no evidence that constructing graphic organizers or even studying authorprovided graphic organizers results in deeper learning. The top middle portion of Table 2 summarizes the mean retention scores of the three groups in Experiment 1. There was not a significant effect of treatment on retention scores, F(2, 153) ⫽ 0.210, MSE ⫽ 21.38, and the author-provided group did not differ significantly from the learner-generated group, t(153) ⫽ 0.56, d ⫽ 0.11. There is no evidence that constructing graphic organizers or even studying author-provided graphic organizers results in better memory for the presented material. The top right portion of Table 2 summarizes the mean study times of the three groups in Experiment 1. There was a significant difference among the groups in mean study time, F(2, 153) ⫽ 82.86, MSE ⫽ 9.99, p ⬍ .001, and the author-provided group required significantly less study time than did the learnergenerated group, t(153) ⫽ 8.97, p ⬍ .001, d ⫽ 1.51. Although constructing graphic organizers did not result in better retention or transfer performance, it did require considerably more study time. Although the main focus of this research was on comparing the test performance of the author-provided and learner-generated groups, the types and number of graphic organizers produced by the learner-generated group were also examined. The authorprovided group received 27 graphic organizers containing 506 2 Although our main focus was on comparing the test performance of the author-provided and learner-generated groups, we also conducted supplemental Newman–Keuls tests (with alpha at p ⬍ .05) involving the control group. In Experiment 1, the author-provided group did not differ significantly from the control group on transfer or retention but required significantly more study time; similarly, the learner-generated group did not differ significantly from the control group on transfer or retention but required significantly more study time. We conclude that the two treatments were too complex for the learners. In Experiment 2, the authorprovided group scored significantly higher than the control group on transfer but not retention and required significantly more study time, whereas the learner-generated group did not differ significantly from the control group on transfer and retention but required significantly more study time. We conclude that the author-provided treatment was more effective than the learner-generated treatment. In Experiment 3, the authorprovided group scored marginally higher ( p ⬍ .10) than the control group on transfer but not significantly differently on retention or study time, whereas the learner-generated group did not differ significantly from the control group on transfer or retention but required significantly more study time. We conclude that the author-provided treatment was more effective than the learner-generated treatment.
STULL AND MAYER
814
Table 2 Mean Transfer Score, Retention Score, and Study Time for Three Groups in Three Experiments Transfer test Group
n
M
SD
Retention test d
M
SD
Study time (min) d
M
SD
d
0.11
9.2 14.8 7.1
1.9 4.9 1.6
1.51
0.25
9.0 22.1 7.0
2.9 3.8 1.6
3.38
0.32
8.8 17.6 7.7
2.8 4.1 2.2
2.51
Experiment 1 (highest complexity) Author provided Learner generated Control
51 51 54
7.1 6.3 7.2
3.5 3.3 2.7
0.24
11.8 12.3 11.7
5.0 4.5 4.4
Experiment 2 (intermediate complexity) Author provided Learner generated Control
39 38 39
7.4 5.7 5.3
4.4 3.4 2.8
0.43
10.4 9.5 8.5
3.4 3.9 3.5
Experiment 3 (lowest complexity) Author provided Learner generated Control Note.
33 33 32
9.2 6.0 7.3
4.1 3.5 4.3
0.84
13.6 12.1 13.7
4.6 4.8 4.0
Cohen’s ds are effect sizes favoring author-provided over learner-generated treatment.
words, whereas the learner-generate group produced a mean of 5.1 graphic organizers containing a mean of 84.2 words. The mean number of graphic organizers produced fell from 2.0 on page 1 to 0.5 on page 5; the mean number of words produced fell from 34.8 on page 1 to 10.0 on page 5. Although the number of graphic organizers produced in the learner-generated group was lower than that given to the author-provided group, all but 2 of the 51 participants in the learner-generated group attempted to construct graphic organizers. Exclusion of these 2 participants from the analysis did not alter the statistical results. These results are contrary to the prediction that graphic organizers facilitate learning. Furthermore, there is no evidence that generating graphic organizers resulted in better learning than simply viewing them on the page, although there is evidence that more study time was required when students generated their own graphic organizers. The open-ended nature of the learnergenerated treatment might have been too demanding and confusing for the learners. Although a majority of participants in the learnergenerated group attempted to construct graphic organizers, these graphic organizers varied greatly in form and quality. Participants might have been overwhelmed by the requirement to both select and implement appropriate graphic organizers, both of which might have contributed to extraneous cognitive load. For participants in the author-provided group, the margins of the pages were densely crowded with graphic organizers, which were potentially confusing to interpret as participants attempted to compare the concepts in the text with the appropriate graphic organizer. This might also have contributed to additional extraneous cognitive load. To address these issues, we reduced the complexity of the treatment in Experiments 2 and 3 by offering fewer graphic organizers to both groups and partially completed graphic organizer templates to the learner-generated group.
Experiment 2 (Intermediate Complexity) One problem with Experiment 1 is that students in the learnergenerated group might have experienced overwhelming cognitive
load because they had to devote substantial cognitive resources to figuring out the mechanics of how to generate graphic organizers. Similarly, students in the author-provided group might have experienced cognitive load because they had to attend to a large number of graphic organizers while reading the passage. The purpose of Experiment 2 was to test the same questions as in Experiment 1, but under conditions of reduced cognitive load. We reduced cognitive load for the author-provided and learner-generated groups by reducing the number of graphic organizers from 27 to 18, and we reduced cognitive load for the learner-generated group by providing scaffolding in the form of partially completed templates to be filled in by the students. We were interested in determining whether students enjoy the benefits of deeper learning with graphic organizers when we reduce cognitive load imposed by the graphic organizer treatments.
Method Participants and design. The participants were 116 college students recruited from the psychology participant pool at the University of California, Santa Barbara. The study is based on a between-subjects design, with three levels of graphic organizer use (author provided, learner generated, and control) as the single factor. Thirty-nine students served in the author-provided group, 38 students served in the learner-generated group, and 39 students served in the control group. The mean age was 18.8 years (SD ⫽ 1.2), the percentage of men was 40.5%, and the mean SAT score was 1183.5 (SD ⫽ 128.0). Materials. The materials were identical to those used in Experiment 1, except that the pretraining documents focused on only three kinds of graphic organizers (i.e., hierarchies, lists, and flowcharts), the author-provided passage contained only 18 graphic organizers (one list and one flowchart for each of the eight core paragraphs, along with one hierarchy in the introduction and one hierarchy in the conclusion), and the learner-generated passage contained 18 graphic organizer templates (corresponding to those
GRAPHIC ORGANIZERS
used in the author-provided lesson, but with sections left blank for students to be filled in). Procedure. The procedure was identical to that used in Experiment 1, except that the learner-generated group received additional pretraining in which they filled in templates for each of the three types of graphic organizers. As part of this pretraining, the learner-generated group received feedback from the experimenter in the form of expert-completed templates that they were asked to compare to their own filled-in templates.
Results and Discussion Scoring. Retention and transfer questions were scored with the same procedures used in Experiment 1. Discrepancies in transfer scores were resolved by consensus after scoring by two independent reviewers. Data analysis. The same data analysis procedures were used as in Experiment 1. Do readers who generate their own graphic organizers while reading a scientific passage learn better than readers who are given author-provided graphic organizers? The left central portion of Table 2 summarizes the mean transfer scores of the three groups in Experiment 2. Unlike Experiment 1, there was a significant effect of treatment on transfer scores, F(2, 113) ⫽ 3.60, MSE ⫽ 13.11, p ⬍ .05, and the author-provided group scored significantly higher than the learner-generated group, t(113) ⫽ 2.03, p ⬍ .05, d ⫽ 0.43. There is evidence that studying authorprovided graphic organizers results in deeper learning than constructing graphic organizers. The middle central portion of Table 2 summarizes the mean retention scores of the three groups in Experiment 2. There was a marginally significant effect of treatment on retention scores, F(2, 113) ⫽ 2.72, MSE ⫽ 13.28, p ⫽ .07, and the author-provided group did not differ significantly from the learner-generated group, t(113) ⫽ 1.19, d ⫽ 0.25. There is no evidence that constructing graphic organizers results in better memory for the presented material than studying author-presented graphic organizers. The right central portion of Table 2 summarizes the mean study times of the three groups in Experiment 2. There was a significant difference among the groups in mean study time, F(2, 113) ⫽ 313.12, MSE ⫽ 8.28, p ⬍ .001, and the author-provided group required significantly less study time than did the learnergenerated group, t(113) ⫽ 20.07, p ⬍ .001, d ⫽ 3.38. Although constructing graphic organizers resulted in poorer transfer performance, it also required considerably more study time. Although our main focus was on comparing the test performance of the author-provided and learner-generated groups, we also examined the accuracy of the learner-generated group in filling in the graphic organizers. In Experiment 2, all participants except 5 completed the fill-in activity in the learner-generated group, and they were 86% correct—including 98% correct on hierarchies, 97% correct on lists, and 66% correct on flowcharts. Of the 5 participants who did not complete all of the fill-in sections, 2 completed 16 of the 18 sections, 1 completed 14 of the 18 section, 1 completed 11 of the 18 sections, and 1 completed 6 of the 18 sections. For these 5 participants, the mean scores on transfer (M ⫽ 4.6, SD ⫽ 3.8) and retention (M ⫽ 6.2, SD ⫽ 3.1) were lower than the mean scores on transfer (M ⫽ 6.2, SD ⫽ 3.7) and retention (M ⫽ 9.6, SD ⫽ 3.7) for participants who completed
815
all of the templates. What is most notable about these 5 participants is that their mean study time (M ⫽ 24.3, SD ⫽ 0.28) was much greater than the mean study time (M ⫽ 12.1, SD ⫽ 7.0) for the group of participants who completed all of the templates. That each of these 5 participants spent 24 min or more with the activity suggests that their performance on transfer and retention was not due to a lack of effort or exposure to the material. When we dropped the 5 participants in the learner-generated group who did not complete all of the fill-in sections during learning, the authorprovided group now only marginally outperformed the learnergenerated group on transfer, t(108) ⫽ 1.75, p ⫽ .08. As before, there was not a significant difference on retention, t(108) ⫽ 0.58. We conclude that some learners were still overwhelmed by the learner-generated treatment, and even though they invested substantial effort in the activity, they might not have completed the graphic organizer templates. We have no evidence that, with mounting time pressure, these learners did not simply mentally review the final templates without actually completing them. The reduced complexity of the treatment in Experiment 3 addresses this issue. These results are contrary to the prediction of activity theory that constructing graphic organizers will facilitate learning and are consistent with the prediction of cognitive load theory that welldesigned author-provided graphic organizers can result in deeper learning than asking students to generate their own graphic organizers. It should be noted that the author-provided graphic organizers did not add any new information but simply organized the text information in a spatial format, thereby helping learners to mentally organize the material.
Experiment 3 (Lowest Complexity) In Experiment 2, the complexity of the graphic organizer treatments was reduced from Experiment 1, and in Experiment 2, the author-provided group outperformed the learner-generated group on transfer. Perhaps the complexity of the treatment was still too great for the learner-generated group, so in Experiment 3, we reduced the complexity even further. The purpose of Experiment 3 was to test the same questions as in Experiments 1 and 2, but under conditions of greatly reduced cognitive load. We reduced cognitive load for the author-provided and learner-generated groups by reducing the number of graphic organizers from 27 (in Experiment 1) or 18 (in Experiment 2) to 10. Further, we reduced cognitive load for the learner-generated group by providing scaffolding in the form of partially completed templates to be filled in and by providing pretraining practice with feedback in how to fill in graphic organizers. We were interested in determining whether students enjoy the benefits of deeper learning with graphic organizers when we reduce cognitive load imposed by the graphic organizer treatments.
Method Participants and design. The participants were 98 college students recruited from the psychology participant pool at the University of California, Santa Barbara. The study was based on a between-subjects design, with three levels of graphic organizer use (author provided, learner generated, and control) as the single factor. Thirty-three students served in the author-provided group,
816
STULL AND MAYER
33 students served in the learner-generated group, and 32 students served in the control group. The mean age was 19.3 years (SD ⫽ 1.5), the percentage of men was 33.7%, and the mean SAT score was 1186.4 (SD ⫽ 210.8). Materials. The materials were identical to those used in Experiment 2, except that the pretraining documents focused on only two kinds of graphic organizers (i.e., hierarchies and flowcharts), the author-provided passage contained only 10 graphic organizers (one flowchart for each of the eight core paragraphs, along with one hierarchy in the introduction and one hierarchy in the conclusion), the learner-generated passage contained 10 graphic organizer templates (corresponding to those used in the authorprovided lesson, but with sections left blank for students to fill in). Procedure. The procedure was identical to that used in Experiment 2.
Results and Discussion Scoring. Retention and transfer questions were scored with the same procedures used in Experiments 1 and 2. Discrepancies in transfer scores were resolved by consensus after scoring by two independent reviewers. Data analysis. The same data analysis procedures were used as in Experiments 1 and 2. Do readers who generate their own graphic organizers while reading a scientific passage learn better than readers who are given author-provided graphic organizers? The bottom left portion of Table 2 summarizes the mean transfer scores of the three groups in Experiment 3. As in Experiment 2, there was a significant effect of treatment on transfer scores, F(2, 95) ⫽ 5.23, MSE ⫽ 15.80, p ⬍ .01, and the author-provided group scored significantly higher than the learner-generated group, t(95) ⫽ 3.22, p ⬍ .01, d ⫽ 0.84. As in Experiment 2, there is evidence that studying authorprovided graphic organizers results in deeper learning than constructing graphic organizers. The bottom middle portion of Table 2 summarizes the mean retention scores of the three groups in Experiment 2. There was not a significant effect of treatment on retention scores, F(2, 95) ⫽ 1.32, MSE ⫽ 20.41, and the author-provided group did not differ significantly from the learner-generated group, t(95) ⫽ 1.39, d ⫽ 0.32. There is no evidence that constructing graphic organizers results in better memory for the presented material than studying author-presented graphic organizers. The bottom right portion of Table 2 summarizes the mean study times of the three groups in Experiment 2. There was a significant difference among the groups in mean study time, F(2, 95) ⫽ 99.02, MSE ⫽ 9.84, p ⬍ .001, and the author-provided group required significantly less study time than did the learner-generated group, t(95) ⫽ 11.47, p ⬍ .001, d ⫽ 2.51. Although constructing graphic organizers resulted in poorer transfer performance, it also required considerably more study time. Although our main focus was on comparing the test performance of the author-provided and learner-generated groups, we also examined the accuracy of the learner-generated group in filling in the graphic organizers. In Experiment 3, all participants completed the fill-in activity in the learner-generated group, and they were 80% accurate—including 97% correct on hierarchies and 67% correct on flowcharts (there were no lists in Experiment 3). As we did not need to drop any participants in the learner-
generated group for not completing the fill-in activity during learning, the main comparisons between the learner-generated and author-provided groups remained the same: The author-provided group outperformed the learner-generated group on transfer, t(95) ⫽ 3.22, p ⬍ .01, but not on retention, t(95) ⫽ 1.39, ns. Overall, there is no indication that the relatively poor performance of the learner-generated group can be attributed to the way they filled in the graphic organizers during learning, so this analysis is consistent with the conclusions drawn from the results. As in Experiment 2, these results are contrary to the prediction of activity theory that constructing graphic organizers will facilitate learning and are consistent with the prediction of cognitive load theory that well-designed author-provided graphic organizers can result in deeper learning than asking students to generate their own graphic organizers. When the graphic organizer treatment was designed in a way that minimized cognitive load, author-provided graphic organizers led to deeper learning than did learnergenerated graphic organizers.
General Discussion Empirical Findings Students scored higher on a transfer test after reading a scientific passage that contained graphic organizers (author-provided group) than after reading a scientific passage in which they were asked to construct graphic organizers (learner-generated group). The effect size favoring the author-provided group was small (d ⫽ 0.24) when the graphic organizer treatment was of the highest complexity (in Experiment 1), was medium (d ⫽ 0.43) when the graphic organizer treatment was of intermediate complexity (in Experiment 2), and was large (d ⫽ 0.84) when the graphic organizer treatment was of the lowest complexity (in Experiment 3). In all three studies, the groups did not differ significantly on a retention test, which indicates that all groups reached the same level of learning the basic material. In all three experiments, the learnergenerated group required significantly more reading time than did the author-provided group (d ⬎ 1 in all experiments). Overall, the author-provided group showed deeper understanding of scientific passage (as measured by tests of problem-solving transfer) and required less learning time as compared to the learner-generated group.
Theoretical Implications When the goal was to encourage students to engage in deep processing of scientific text, a seemingly passive treatment— adding graphic organizers—was more effective than a seemingly active treatment—asking students to create graphic organizers as they read. How can we explain this apparent paradox in which active learning (as measured by transfer performance) was better produced by a passive treatment than by an active treatment? In other words, why was learning by viewing better than learning by doing, when the goal was to produce deep learning? Finally, why was this pattern strongest when we minimized the complexity of the treatments, in an effort to reduce the cognitive load imposed by the treatments? We interpret these patterns using cognitive load theory, particularly the triarchic theory of cognitive load, in which deep learning
GRAPHIC ORGANIZERS
occurs when the learner engages in generative processing and essential processing while not having to engage in extraneous processing. Reading the text and remembering it is a form of essential processing and is reflected in retention test performance. Making sense of the graphic organizer is a form of generative processing, because the learner may seek to reconcile how a portion of the text was converted in a corresponding graphic organizer. In addition, reading a graphic organizer is not as load inducing as having to generate a graphic organizer, so extraneous cognitive load is comparatively less. The relative benefits of trying to make sense of a graphic organizer are reflected in transfer test performance. The effect is strongest when the treatment is least complex, because the more complex versions of the treatment require extraneous processing, which comes at the expense of generative processing. Consider what happened for the learner-generated group. The activity of constructing graphic organizers may be extremely load inducing (i.e., requiring extraneous processing), leaving less capacity for essential processing and generative processing. Although students might have had some capacity for essential processing (allowing them to perform adequately on retention tests), they did not have the additional capacity required for generative processing. This pattern of results is not consistent with activity theory, which predicts that students learn more deeply by doing than by viewing. In direct contrast to predictions, the learner-generated group did not outperform the author-provided group on any of the three dependent measures in any of the three experiments. In fact, the learner-generated group performed the worst in exactly the conditions in which activity theory predicts the opposite—when cognitive load was minimized (i.e., Experiment 3 and, to a lesser extent, Experiment 2) and the dependent measure tapped depth of understanding (i.e., transfer test). We found no support for the general proposition that learning by doing will always lead to deeper learning than learning by viewing, even though interest in discovery-based methods is still intense (Mayer, 2004).
Methodological Implications Research on graphic organizers can provide a variety of results depending on the overall level of cognitive load for the learner during learning. We propose three variables that may be related to the overall level of cognitive load during learning: (a) the complexity of treatment (e.g., lower complexity vs. higher complexity), (b) the dependent measure of learning (e.g., retention vs. transfer), and (c) the prior knowledge of the learners (e.g., high knowledge vs. low knowledge). In the present studies, we varied the dependent measure by using transfer (as a measure of deep learning fostered by generative processing) and retention (as a measure of basic learning fostered by essential processing), we varied the complexity of treatments (by having many graphic organizers with little training to create higher extraneous processing vs. few graphic organizers with more training to create lower extraneous processing), and all learners were low in prior knowledge. When the complexity was too high (i.e., in Experiment 1), so much extraneous processing was required that neither of the graphic organizer treatments helped foster deeper learning. When the complexity was lower (i.e., in Experiments 2 and 3), students had some remaining cognitive capacity. The author-provided
817
group could use that capacity to make sense of the graphic organizers, whereas the learner-generated group might have been overloaded by the need to construct organizers. One hypothesis that warrants additional research is that the learner-generated treatment might be more effective for high-knowledge learners, because the overall level of cognitive load is lower. Overall, an important methodological consideration in studies of graphic organizers concerns the overall level of complexity, as determined by the complexity of the treatment, the transfer level of the dependent measure, and the prior knowledge of the learner.
Practical Implications When the learners are inexperienced, we recommend adding a few key graphic organizers to help learners select relevant material from the text and organize it into a coherent structure. We do not recommend asking low-knowledge students to construct their own organizers, especially when the learning task is difficult, such as with the scientific text used in the present study. Both treatments— learning by viewing and learning by doing— can encourage generative processing, but learning by doing may create so much extraneous processing that insufficient capacity is available to actually engage in generative processing. In situations in which the level of overall cognitive load is extremely low—such as for high-knowledge learners studying very simple material or highknowledge learners studying complex material with unlimited time—learning by doing may be more effective. In contrast, lowknowledge learners, such as those in our study, may need some guidance in how to organize the material—such as in the form of trying to reconcile the text with graphic organizers provided by the author. When the information is new and techniques are unfamiliar, constructive activities may exact a level of cognitive effort that can easily overwhelm the cognitive capacities of learners. Pure learning by doing, such as pure discovery learning (Klahr & Nigam, 2004; Mayer, 2004), is unlikely to be helpful. Guided use of constructive activities, when learners are familiar with a technique, is a better option and more likely to promote the selection, organization, and integration of knowledge that is necessary to facilitate meaningful learning. Overall, these experiments should not be taken to controvert the value of learning by doing in all situations. The learner-generated treatment might be more successful for high-knowledge learners or for learners who are more experienced in how to construct graphic organizers.
Limitations and Future Directions These experiments are limited in several areas that should be investigated in future studies. The level of graphic organizer training given to participants in this study was minimal. Learners well trained in how to interpret or construct graphic organizers might have performed differently in these experiments. It might be assumed that well-trained participants would perform better because of their familiarity with the graphic organizer technique, but a claim could also be made that a novelty effect could contribute to our results and that as learners become familiar with the graphic organizers they are more inclined to ignore them. As a related matter, learners familiar with the reading topic may also utilize graphic organizers differently than learners unfamiliar with the
818
STULL AND MAYER
reading material (Kalyuga & Sweller, 2004). Future research should investigate the effect of preexisting familiarity (or expertise) and training on the effectiveness of graphic organizers. Participants were tested immediately after the reading, which does not represent an ecologically valid situation. A more realistic measure of both retention and transfer would be to test participants several days to several weeks after the reading. It has been suggested that, under some conditions, performance improves after a delay of a day or more (Bera & Robinson, 2004; Robinson & Kiewra, 1995; Robinson, Katayama, Dubois, & Devaney, 1998). Future research should investigate the longer term effects of graphic organizers. In addition, we did not have a direct measure of extraneous cognitive processing during learning, but future studies should incorporate such measures. The graphic organizers used in these experiments were diverse in form and probably in function. It has been suggested that two-dimensional graphic organizers, such as matrices and knowledge maps, are better at promoting comparison and integration of concepts than one-dimensional graphic organizers, such as outlines and lists (Katayama, Robinson, Kiewra, Dubois, & Jonassen, 2001; Robinson & Kiewra, 1995). This difference in facilitation is attributed to the ability of the two-dimensional graphic organizers to compare concepts across the linear organization of normal text. Further, it is also conceivable that some graphic organizers may not encourage learners to engage in appropriate generative processing. If some graphic organizers do little more than facilitate learners to transpose information from the text to the organizer during their construction, then the quality of the activity is unlikely to promote meaningful generative processing. For example, it was noted that in both Experiments 2 and 3 participants seemed to use a common practice of completing the graphic organizer templates in the learner-generated group with the exact phrase from the text. Also worthy of further investigation is the accuracy with which graphic organizers are constructed and how this relates to problemsolving performance. The present study did not distinguish between those learners who accurately constructed graphic organizers and those who did not. The design of most of the graphic organizers used in this study represented a single concept and required participants to provide little more than a word or a phrase for completion. Some graphic organizer forms, such as the flowchart, are more challenging than other forms, such as the list and hierarchy, and require more engagement by the learner. Future research should investigate how the form and difficulty of different graphic organizers, in both author-provided and learner-generated strategies, promote generative processing and cognitive load.
General Conclusions The conclusions of this study are that increased physical activity on the part of the learner (e.g., producing graphic organizers) should not be interpreted to indicate deeper learning. Asking learners to construct graphic organizers from scratch or to complete graphic organizer templates does not necessarily guarantee that they will engage in generative processing during learning. In addition, graphic organizers, when properly designed and placed in the margins of a textbook can promote generative processing that leads to superior knowledge transfer. Finally, the limits of the learner’s cognitive capacity should be addressed in the design of graphic organizers for textbook passage.
References Alvermann, D. E. (1981). The compensatory effect of graphic organizers on descriptive text. Journal of Educational Research, 75, 44 – 48. Ausubel, D. P. (1968). Educational psychology: A cognitive approach. New York: Holt, Rinehart & Winston. Balluerka, N. (1995). The influence of instructions, outlines, and illustrations on the comprehension and recall of scientific texts. Contemporary Educational Psychology, 20, 369 –375. Bera, S. J., & Robinson, D. H. (2004). Exploring the boundary conditions of the delay hypothesis with adjunct displays. Journal of Educational Psychology, 96, 381–388. Campbell, N. A., Reece, J. B., Mitchell, L. G., & Taylor, M. R. (2003). Biology: Concepts and connections (4th ed.). San Francisco: Benjamin Cummings/Pearson Education. Chambliss, M. J., & Calfee, R. C. (1998). Textbooks for learning: Nurturing children’s minds. Malden, MA: Blackwell Publishers. Chandler, P., & Sweller, J. (1991). Cognitive load theory and the format of instruction. Cognition and Instruction, 8, 293–332. Cohen, J. (1988). Statistical power analysis for the behavioral sciences (2nd ed.). Mahwah, NJ: Erlbaum. Cook, L. K., & Mayer, R. E. (1988). Teaching readers about the structure of scientific text. Journal of Educational Psychology, 80, 448 – 456. Czuchery, M., & Dansereau, D. F. (1999). Node-link mapping and psychological problems: Perceptions of a residential drug abuse treatment program for probationers. Journal of Substance Abuse Treatment, 17, 321–329. Dansereau, D. F., Joe, G. W., & Simpson, D. D. (1993). Node-link mapping: A visual representations strategy for enhancing drug abuse counseling. Journal of Counseling Psychology, 40, 385–395. de Jong, T. (2005). The guided discovery principle in multimedia learning. In R. E. Mayer (Ed.), The Cambridge handbook of multimedia learning (pp. 215–228). New York: Cambridge University Press. DiCecco, V. M., & Gleason, M. M. (2002). Using graphic organizers to attain relational knowledge from expository text. Journal of Learning Disabilities, 35, 306 –320. Diekhoff, G. M., Brown, P. J., & Dansereau, D. F. (1982). A prose learning strategy training program based on network and depth-of-processing models. Journal of Experimental Education, 50, 180 –184. Dunston, P. J. (1992). A critique of graphic organizer research. Reading Research & Instruction, 31, 57– 65. Griffin, C. C., & Tulbert, B. L. (1995). The effect of graphic organizers on students’ comprehension and recall of expository text: A review of the research and implications for practice. Reading & Writing Quarterly, 11, 73– 89. Hall, R. H., Hall, M. A., & Saling, C. B. (1999). The effects of graphical postorganization strategies on learning from knowledge maps. Journal of Experimental Education, 67, 101–112. Hall, R. H., & Sidio-Hall, M. A. (1994). The effect color enhancement on knowledge map processing. Journal of Experimental Education, 62, 209 –217. Hall, V. C., Bailey, J., & Tillman, C. (1997). Can student-generated illustrations be worth ten thousand words? Journal of Educational Psychology, 89, 677– 681. Horton, S. V., Lovitt, T. C., & Bergerud, D. (1990). The effectiveness of graphic organizers for three classifications of secondary students in content area classes. Journal of Learning Disabilities, 23, 12–22. Ives, B., & Hoy, C. (2003). Graphic organizers applied to higher-level secondary mathematics. Learning Disabilities Research & Practice, 18, 36 –51. Kalyuga, S., & Sweller, J. (2004). Measuring knowledge to optimize cognitive load factors during instruction. Journal of Educational Psychology, 96, 558 –568. Katayama, A. D., & Crooks, S. M. (2003). Online notes: Differential
GRAPHIC ORGANIZERS effects of studying complete or partial graphically organized notes. Journal of Experimental Education, 71, 293–312. Katayama, A. D., & Robinson, D. R. (2000). Getting students “partially” involved in note-taking using graphic organizers. Journal of Experimental Education, 68, 119 –133. Katayama, A. D., Robinson, D. H., Kiewra, K. A., Dubois, N., & Jonassen, D. (2001). Biases with adjunct display construction and testing. Journal of Research in Education, 11, 54 – 61. Kiewra, K. A., DuBois, N. F., Christian, D., & McShane, A. (1988). Providing study notes: Comparison of three types of notes for review. Journal of Educational Psychology, 80, 595–597. Kiewra, K. A., DuBois, N. F., Christian, D., McShane, A., Meyerhoffer, M., & Roskelley, D. (1991). Note-taking functions and techniques. Journal of Educational Psychology, 83, 240 –245. Kiewra, K. A., Kauffman, D. F., Robinson, D. H., Dubois, N. F., & Stanley, R. K. (1999). Supplementing floundering text with adjunct displays. Instructional Science, 27, 373– 401. Kim, A., Vaughn, S., Wanzek, J., & Wei, S. (2004). Graphic organizers and their effects on the reading comprehension of students with LD: A synthesis of research. Journal of Learning Disabilities, 37, 105–118. Kinchin, I. M., & Hay, D. B. (2000). How a qualitative approach to concept map analysis can be used to aid learning by illustrating patterns of conceptual development. Educational Research, 42, 43–57. Kirschner, P. A., Sweller, J., & Clark, R. E. (2006). Why minimal guidance during instruction does not work: An analysis of the failure of constructivist, discovery, problem-based, experiential, and inquiry-based teaching. Educational Psychologist, 41, 75– 86. Klahr, D., & Nigam, M. (2004). The equivalence of learning paths in early science instruction: Effects of direct instruction and discovery learning. Psychological Science, 15, 661– 667. Lillard, A. S. (2005). Montessori: The science behind the genius. New York: Oxford University Press. Liu, X. (2004). Using concept mapping for assessing and promoting relational conceptual change in science. Science Education, 88, 373– 396. Mayer, R. E. (1979). Can advance organizers influence meaningful learning? Review of Educational Research, 49, 371–383. Mayer, R. E. (2001). Multimedia learning. New York: Cambridge University Press. Mayer, R. E. (2003). Learning and instruction. Upper Saddle River, NJ: Prentice-Hall. Mayer, R. E. (2004). Should there be a three-strikes rule against pure discovery learning? The case for guided methods of instruction. American Psychologist, 59, 14 –19. Mayer, R. E. (2005). Cognitive theory of multimedia learning. In R. E. Mayer (Ed.), The Cambridge handbook of multimedia learning (pp. 31– 48). New York: Cambridge University Press.
819
Mayer, R. E., & Moreno, R. (2003). Nine ways to reduce cognitive load in multimedia learning. Educational Psychologist, 38, 43–52. McCagg, E. C., & Dansereau, D. F. (1991). A convergent paradigm for examining knowledge mapping as a learning strategy. Journal of Educational Research, 84, 317–324. Mclay, M., & Brown, M. (2003). Using concept mapping to evaluate the training of primary school leaders. International Journal of Leadership in Education, 6, 73– 87. Moore, D. W., & Readence, J. E. (1984). A quantitative and qualitative review of graphic organizer research. Journal of Educational Research, 78, 11–17. Novak, J. D., & Gowin, D. B. (1984). Learning how to learn. New York: Cambridge University Press. O’Donnell, A. M., Dansereau, D. F., & Hall, R. H. (2002). Knowledge maps as scaffolds for cognitive processing. Educational Psychology Review, 14, 71– 86. Rewey, K. L., Dansereau, D. F., Skaggs, L. P., Hall, R. H., & Pitre, U. (1989). Effects of scripted cooperation and knowledge maps on the processing of technical material. Journal of Educational Psychology, 81, 604 – 609. Robinson, D. H. (1998). Graphic organizers as aids to text learning. Reading Research and Instruction, 37, 85–105. Robinson, D. H., Corliss, S. B., Bush, A. M., Bera, S. J., & Tomberlin, T. (2003). Optimal presentation of graphic organizers and text: A case for large bites? Educational Technology Research and Development, 51, 25– 41. Robinson, D. H., Katayama, A. D., Dubois, N. F., & Devaney, T. (1998). Interactive effects of graphic organizers and delayed review on concept application. Journal of Experimental Education, 67, 17–31. Robinson, D. H., & Kiewra, K. A. (1995). Visual argument: Graphic organizers are superior to outlines in improving learning from text. Journal of Educational Psychology, 87, 455– 467. Ruiz-Primo, M. A., & Shavelson, R. J. (1996). Problems and issues in the use of concept maps in science assessment. Journal of Research in Science Teaching, 33, 569 – 600. Sweller, J. (1999). Instructional design in technical areas. Camberwell, Australia: ACER Press. Sweller, J. (2005). Implications of cognitive load theory for multimedia learning. In R. E. Mayer (Ed.), The Cambridge handbook of multimedia learning (pp. 19 –30). New York, Cambridge University Press. Vekiri, I. (2002). What is the value of graphical displays in learning? Educational Psychology Review, 14, 261–312. Wexler, M. N. (2001). The who, what and why of knowledge mapping. Journal of Knowledge Management, 5, 249 –263. Wittrock, M. C. (1974). Learning as a generative activity. Educational Psychologist, 11, 87–95.
(Appendix follows)
STULL AND MAYER
820
Appendix Retention and Transfer Questions Used to Measure Learning Sentence-Completion Questions (Retention) 1. Two species of Oenothera live side by side in the deserts of western North America. They flower at the same time of year and are pollinated by the same insects but the flower of one species opens before sunrise and the other in the late afternoon. This is an example of ________________, which is a _____zygotic reproductive barrier. 2. Two closely related frog species live in the same area of rainforest, but one feeds and mates in the forest canopy and the other on the forest floor. This is an example of ________________, which is a _____zygotic reproductive barrier. 3. Eastern and western meadowlarks are almost identical in shape, coloration, and habitat. Their ranges overlap in the central United States but they remain separate species in part due to differences in their songs, which enables them to recognize potential mates as members of their species. This is an example of ________________, which is a _____zygotic reproductive barrier. 4. Bush babies, a group of small arboreal primate, are divided into several species and cannot successfully interbreed because each species has distinctly shaped genitalia that only fit with the genitalia of its own species. This is an example of ________________, which is a _____zygotic reproductive barrier. 5. Pollen of one kind of tobacco cannot fertilize another kind. This is an example of ________________, which is a _____zygotic reproductive barrier. 6. Sheep and goats appear similar and can be mated together but their offspring are generally stillborn due to chromosome mismatch. This is an example of ________________, which is a _____zygotic reproductive barrier. 7. Lions and tigers occasionally interbreed to produce vigorous but sterile offspring called ligers. This is an example of ________________, which is a _____zygotic reproductive barrier. 8. It has been demonstrated that between populations of twospotted spider mites, the second generation offspring of crosses
between mites infected with the bacteria Wolbachia and uninfected mites have an abnormally high mortality rate. This is an example of ________________, which is a _____zygotic reproductive barrier.
Short-Answer (Retention) Question Reproductive barriers are divided into two main groups. Name these two groups and describe the feature that distinguishes each.
Short-Answer (Transfer) Questions 1. You’ve recently discovered a frog in the pond by your house but it is slightly different from the frogs you normally see. Did you find a new species? Describe how someone would test if you’ve found a new species. 2. There are two species of lobster and each species has desirable characteristics that are not possessed by members of the other species. They have never been crossbred. What can be done to breed a hybrid lobster that possesses the desirable characteristics of both species? 3. Suppose you take two different species of gypsy moths from different habitats and bring them together in a breeding zoo. In spite of your efforts, no hybrids appear. What could have gone wrong? 4. Do members of the same butterfly species have to have the same colors, patterns, and shapes? Please explain. 5. On an island you find two groups of finches that reproduce successfully even though they eat different foods, forage in different places, and have different shapes to their bills. Do these two groups represent one species or two? Please explain. Received July 27, 2006 Revision received May 10, 2007 Accepted May 17, 2007 䡲