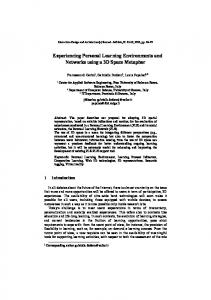
Learning Control Theory by Experiencing Dynamics Pieter Jan STAPPERS*, Aldo HOEBEN*, John. M. FLACH** .
*Department of Industrial Design, Faculty of Industrial Design Engineering, Delft University of Technology, Landberghstraat 15, NL-2628 CE Delft, the Netherlands,
[email protected]. . **Department of Psychology, Wright State University, 3640 Colonel Glenn Hwy, Dayton, OH 45435-0001.
[email protected].
Abstract: Simulation games have been, and still are, on the forefront of human-computer interface design. Where games have always used speed and dynamics in as far as the technology allowed, mainstream software design has long ignored the dimension of time: a word processor does not care whether you pause for a long time between entering sentence, words, or letter. The rapid and sustained growth of computer processing power has not been matched by a corresponding growth in the expressiveness or sensitivity of user interfaces. Only in the last few years do we see attention for expressive use of dynamic used, in part because the early Graphical User Interfaces did not give programmers access to the real-time behavior of their applications: at any time the operating system might cut in and shut the user out. Now that designers are regaining the ability to specify the dynamic behavior of interface elements, they need to have a hands-on understanding of the dynamics of human control theory. Textbooks can describe how the difficulty of controlling a task increases with the order of control: 0th order (position control) is easy, 1st order (velocity control) gets more difficult, whereas skilled experts such as airplane and helicopter pilots have to deal with 3rd and 4th order control. In order to understand the difficulties involved, and to design solutions for them, designers need to experience what the different orders imply. In this poster we describe a 'driving game’ that teaches order of control by merging experiential display (game-like simulation) with a reflective display (theory-like controls). In developing the application, many design aspects of linking and expressing both theoretical and experiential factors needed to be solved. Design students using the simulation had to become competent at the control task, but also understand their errors, and recovery behavior. We discuss custom-made sliders, gauges, and other display elements that were especially tuned to the learning process of the students.. Key words: Control theory, Computer Interface, System dynamics, Design education, Interface Design
1. Introduction Although the technical properties of computers, such as processor speed and disk size, have grown exponentially according to Moore’s law, improvements in the human interface have progressed much slower. One forgotten factor that has relatively little attention is the temporal dynamics of computer-user interaction. For instance, a word processor does not care whether the user finishes a sentence in one go, or whether the user pauses for hours between typing one half of a word and the other half. In computer-human interaction, the main guidelines address the unwanted effects of delays. For example, one of the principles of the ‘direct manipulation’ paradigm states that user actions must result in immediate visual or auditory feedback, to confirm to the user that the machine has registered the command action. In human-human interaction, the time dimension is hugely
may be greatly enriched by the understanding that human-machine interaction has much in common with humanhuman interaction, and designers of user interfaces have a lot to learn from findings in the social sciences [3]. Similarly, machines could be designed to be more sensitive to gestural input, because people use gestures to support verbal communication, and there are things that can be expressed in gestures which cannot easily be brought in words. For example, Hummels argues how spatial gestures can form the basis for Virtual Reality CAD systems [1]. One of the few commercial systems which are explicitly sensitive to the timing of user actions is the Painter (TM) sketching software, in which, e.g. the line width or transparency of the simulated pen strokes can be set to depend on the speed of the user’s actions. But this application is still an exception. Most computer interfaces remain oblivious to the time dimension. Even for timing-specific tasks, such as character animation, the users' input dynamics are abstracted into graphs with tunable control points, distancing the animator from the character's dynamics. The importance of the time factor has long been recognized in computer games, and in professional simulations for dynamic control tasks, such as flight simulators. Indeed, computer games and simulators have been used extensively in the training of control tasks. Designers of ‘regular’ user interfaces have a lot to learn from games (and many already have). One of the things designers of interactive applications should learn is how well people can control dynamic systems, what types of mistakes they make, and how the design of the interface can enhance the user's performance (and enjoyment) at dynamic control tasks. In this paper we discuss design decisions in making an educational simulation to teach design students about control dynamics. The simulation is available on the website (see note at end of paper).
2. Feedback control tasks In everyday life people perform many ‘feedback control tasks’. Examples are driving a car, riding a bicycle, or just pointing in a direction. In each of these examples, we perform an action, e.g., turning the wheel, and make continuous corrections on the basis of what we see, e.g., the car moves too far to the right. These tasks differ in their ‘order’ of control. Low order control tasks are typically easy to learn, higher order tasks are more difficult. Table I gives an overview of the first three orders. In each case, the user changes the value of variable x over time, and observes the results in variable y. A scale constant c determines a gain factor. For instance, for the 0th order example, x0(t) is the sideways position of the input device, y(t) is the sideways position of the pointer on the screen, and the gain factor c is a combination of the screen size and the system preferences for mouse sensitivity. Typically, small gain factors allow for easy and accurate positioning, but require large movements if the distances become large. On the other hand, large gain factors make it easy to cross distances, but more difficult to end precisely at the right spot. Beginners often start with a low gain factor to learn the tasks, then increase the gain factor as they become better at controlling.
Table I. order of control task order
formula
user controls position
example
y(t) by changing... 0th order
y(t)=c*x0(t)
...position x0(t)
moving an on-screen pointer with a mouse
1 order
{dy(t)}/dt = c*x1(t)
...velocity x1(t)
moving a model train by turning the speed dial
2nd order
{d2 y(t)}/dt2 = c*x2(t)
...acceleration x2(t)
st
moving a rocket by controlling upward force
2.1 Orders of control Zeroth order control tasks occur everywhere, and on different scales, and people can learn them quickly if the gain factor is not too high. As we move to higher order tasks, control gets more difficult. A first order control task might be stopping a (model) train at the precise spot at a platform by turning the speed dial. When we learn such a tasks, we often stop too early or too late. Similarly, higher order control tasks, such as making a car stop at a precise position by applying the braking force, are more difficult to learn. Often, behavior at these tasks show a lot of undershoot and overshoot (especially if there is delay in the system, which we won’t discuss in this paper). A popular example at parties is balancing a broomstick on top of one’s finger. After a short time of balancing, usually the broomstick will wobble sideways, and in trying to regain balance we make too large movements with our finger; after a few of these corrections, the broomstick drops to the ground. People can learn these tasks, but difficulty increases with order. Pilots of aircraft and helicopters have to deal with 3rd and even 4th order control tasks. They can accomplish tasks involving these orders only after intensive training. 2.2 Learning about control tasks In teaching designers about control tasks, we wanted them to learn not just from textbook descriptions as above, but by actually experiencing the task, and reflecting on their performance. Both experience and reflection are important. Thus we wanted to design a simulation which can be played with the fun and skill of a computer game, but which can also be watched and studied as a behavioral experiment. For an introductory coursebook on control theory applied to human behavior and man-machine systems, see [2]. By playing the simulation, someone should experience how he overshoots the target and loses control, and how he gradually learns to improve his performance; then, he should be helped in reflecting on his performance, and on the way interface design can help. In order to make the mathematics come alive, the simulation should help designers to connect the mathematical concepts to everyday situations of control tasks; In this way they can relate their experiential knowledge from everyday tasks to new situations. Similarly, the simulation should help transfer from the mathematical domain to the experiential domain. For instance, controlling a velocity through control displacement is a 1st order control task. An everyday situation for this is accelerating a car at cruising speed on the highway- changes in the car’s speed will be approximately proportional to changes in accelerator position. The requirements described in the previous paragraph were taken into account in developing the simulation itself. In the rest of the paper we describe to what design decisions this lead.
3. Simulation The general structure of a simulation for a (one-dimensional) control task consists of a visual output variable (the result signal) and an input variable (the control signal). In a game-like simulation, the way that input and output are coupled should be intuitive and appeal to everyday experience. Total physical realism is not required, but ecological convincingness is. In an earlier 3D Virtual Reality simulation we found that people quickly learned how to throw balls at targets, even when the motions of the ball did not conform to realistic laws of physics, but, e.g. follow Aristotelian or Medieval theories which are physically inaccurate, but matched people’s naive theories of physics [4]. Similarly, people easily learn to control unrealistic, but intuitive motions of avatars in computer games, and often do not even notice where the laws of physics are violated. In the current prototypes, we wanted the simulation to be simple enough so people can quickly see the relation between the game and the mathematics, engaging so they enjoy learning and exploring its tasks, and sufficiently complex so the motion behavior exhibits typical phenomena such as undershoot, overshoot, loss and recovery of stability.
3.1 Early prototypes Table I lists a few examples of tasks which many people have themselves performed, or which they can easily imagine. The tasks have to be simplified with respect to the physics of the situations they represent, because effects of friction are not part of the mathematical model. We didn’t want to include friction effects in the simulation, because it would complicate the learning about the primary effect, order of control. Some of the best known higher-order tasks come from aeronautics, especially helicopter flying, but these tasks are far outside the experience domain of the user. However, there are quite a few flight simulators and racing car simulators around for the consumer market, which are built on relatively simple simulations, quite similar to the one we propose here. We started from a very mathematical simulation, in which the user's task was to move a small vertical bar from left to right into a box, by controlling the position, the velocity, or the acceleration. Figure 1 shows a screenshot of this version. One feature was a graph that showed the time history of all signals (control signal in black, and position, velocity, acceleration), so players could 'see what happened'. In letting people play with this version, we found that the history graph helped people to 'relive what they did', but that the abstract horizontal motion of the dot encouraged people to think about it as 'just mathematics, unconnected to life'. Also, the different signals were not immediately clear to people, because velocity and acceleration were only displayed on the graphs, and not part of the 'game display'.
Figure 1. The first prototype used mathematical symbols in abstract display, and showed a history graph depicting x(t) and y(t) as thick lines. The direction of time is from top to bottom.
All subsequent simulations were mathematically equivalent to this task, but were 'dressed up' to appeal to experience. Figure 2 shows two early examples: a flight simulator, and a sailing simulator. In each of these, the order of control was determined by pressing keys on the computer keyboard, and the control variable was adjusted by movements of the mouse. The 'task' of the user was to follow a randomly moving 'leader' (a fuel supply airplane for in-flight refuelling or another sail respectively). The lateral velocity of the vehicles was also shown in their orientation, i.e., when a plane was moving to the right, it would also tilt slightly to the right. These rotations of the form were not calculated based on real physical models, but tuned to 'look good' in the eyes of the makers. Position was shown only by the position of the airplane or sail. Velocity and acceleration were simultaneously displayed in circular gauges. These prototypes were tested extensively (though informally). We found that people enjoyed playing these versions, which were more like games. Moreover, the tilting of the vehicles seemed to help people to connect velocity (lateral displacement, shown in the gauge) to what happened in the simulation. Moreover, the realtime display of velocity and acceleration in the gauges at the bottom of the display strengthened this connection between mathematics and experience. In this prototype, the history graph was left out, and it was missed. With the earlier version, the graph led to discussion of what had happened; without the graph, people did not look back to how things went. Moreover, when controlling acceleration, people would often lose control and move far outside the size of the display. It might take 30seconds or so before the plane or sail would return to view, but people would be confused whether the vehicle was to the right or the left. This problem was slightly alleviated by a left/right direction indicator, which would flash up when the vehicle had left the screen.
Figure 2. In the second prototype, the player’s mouse controls the sideways motion of the closer vehicle (cartoon airplane or surfboard); the player’s task is to follow the random motions of the leader vehicle (refuelling airplane or second surfboard). The order of control is selected by pressing ‘0’, ‘1’, or ‘2’ on the keyboard.
The circular gauges showed both drawbacks and advantages. A drawback was that they are not easily mapped onto a history graph. Another that there is only a small area on the screen where circular and linear indications are easy for the reader to match. This means that if we added a history graph, people would have to do mental translations to relate one to the other, and one aim of the simulation was to minimize these superfluous burdens on the user. A surprising advantage was that the velocity display worked very well in two important situations. First, when the user was well in control and carefully positioning the vehicle, precise values can be recognized. Second, when the user has lost control and tries to regain it, the vehicle typically is outside the screen and moving at high speed. In that latter case, the velocity dial would turn around quickly, and the rate of turning gives a rough speed indication, which helps the user to regain control, and make the vehicle move back in the right direction.
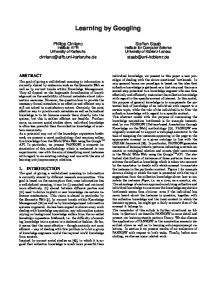
3.2 Third prototype The third prototype displays a motorcyclist on a road. On the sides of the road are grassy verges; if the motorcycle rides on grass the motion gets a bit uneven and bumpy. The player’s task is to keep the motorcyclist on the road, on straight parts and in moderate curves. An array of linear gauges below the picture displays (from top to bottom) the position, velocity, acceleration, and higher order derivatives of the motorcycle’s movement.
Figure 3. Third prototype; the user controls the sideways motion of the motorcycle rider by dragging any of the the linear gauges. Gauges indicate and control, from top to bottom, position, velocity, acceleration, and two higher derivatives of motion. The screenshot on the right shows the history graph replacing the driver display. Its current state indicates that the bike is 1.89 units on the left of the display, still heading left at 0.43 units speed, but accelerating back to the right at 0.19 units acceleration. The verbal label indicates that the user is currently controlling the 2nd order, acceleration.
The user can exert control by dragging any of the gauges. The gauge he picks determines the order of control. The lower and higher order gauges follow the biker's dynamics. They are computed by integration or derivation of the currently selected gauge, respectively. When a signal moves outside the range of a gauge, its vertical bar sticks to the side of the gauge, but it starts to grow in width according to how far off-screen the signal is. Simultaneously, this bar is reduced in contrast, otherwise the bar draws too much attention. In this way the linear gauge saves the advantages noted above of the circular display, i.e., rough overview of the global trend of motion, yet retains the advantages of a linear gauge, i.e. a straight-up connection to the history graph when it is shown in the place of the biker.
Figure 4. Two linear gauges in close-up. The upper gauge shows that the upper signal (position) is 3.89 units to the left and well outside the range of the gauge, the lower gauges indicates that the situation is getting worse, i.e., the velocity is 0.43 units to the left.
In the stack of gauges, the relations between the different temporal derivatives are expressed, leading to a ‘Gestalt’ by which acceleration, velocity, and position can be controlled. Because the user of the simulation sees the gauges of velocity and acceleration also during the task, these can be quickly recognized in the history graph. Also, the connection between the experiential display (upper half, showing the motorcycle) and the reflective display (the stack of gauges) is expressed visually. In the final version, the sideways velocity of the motorcycle is expressed by a tilt of up to 45 degrees to the side of the motion. The acceleration is expressed by the tilt of the riders torso with respect to the motorcycle. Both angles were scaled linearly, not computed on the basis of realistic dynamics of motorcycles; the scale factors were tuned to ‘look convincing’. During initial students' play and during design critiques with control theory experts (from the fields of cognitive systems engineering and aviation), none of the players noted the biker's 'faux dynamics' as inaccurate The compound display made it easier for people to understand and perform the control task, and to explore the relations between the mathematical properties as expressed in the stack of gauges and in the experiential display. The prototype allows turning off either the mathematical display or the experiential display, or even both. Usually within a quarter of an hour, people could perform the 1st and 2nd order control tasks using either the upper or lower part of the display. With both displays 'turned off' (i.e., only the currently controlled order is visible in the gauges, and the biker display shows only the derived position) the higher order tasks are harder to master.
Figure 5.Velocity and acceleration are expressed in the tilt of the motorcycle ( ) and the driver ( ).
Another change between the second and third prototypes is a simplification of the game display. In the second prototypes, the display was pseudo-3D so that the lead vehicle was clearly visible all the time. This made the display engaging, but also more complex, and made it harder for people to relate positions in the scene to positions in a history graph. Therefore, the scene view in the third prototype was ‘2D’ straight from the back, and the vehicle should follow the sideways motions of the road below it instead of a verhicle ‘in front’. A starry-night background was added for two reasons: first to make the scene more visually appealing; second, because the third prototype also featured a predictive indicator, visualised through a light spot from the headlight of the motorcycle. This feature is explained on the website (see note at end), but is beyond the scope of this paper.
4. Conclusions The initial goal of our prototypes was to give design students a hands on experience with higher order control theory. By applying a familiar or easy to imagine situation to the prototype students found it easier to relate to the theoretical background, and were stimulated to 'play around' with the prototype and learn by experience, rather than from a textbook. The series of prototypes illustrate aesthetic design choices that make it easier for people to lay the connection between the experiential appeal of the game display and the abstract theoretical notions. The array of linear gauges supports the user in mapping control to effect (during control), and reflect on seeing his previous behavior (when reviewing the history graph). Initial testing suggests that careful mapping enhances the students’ intuitive understanding of 'what's going on'. Preliminary observations show that all subjects can master controlling at least the first three orders of control (position, velocity and acceleration control) with some effort. During practice, subjects are helped by either or both a mathematical display and an experiential display. Though we have not conducted thorough user testing comparing the effectiveness of both displays, our observations suggest that both provide useful help in learning to master the higher order controls.
The simulation presented in this paper is only a small contribution to helping designers improve the dynamic quality of computer interfaces, in order to facilitate richer user experiences. It helps designers to deepen the engineering side of understanding of control dynamics. However, this understanding must be complemented with an artistic understanding and skill in using effects such as speed and delay to design richer and subtler interactions between human and machine.
Notes The motorcycle simulation can be played in Netscape or Internet Explorer on the ID-StudioLab design research website under http://studiolab.io.tudelft.nl/controltheory/. Playing the simulation requires the Macromedia Flash plugin.
Acknowledgement We would like to thank Max Mulder of the School of Aeronautics, TU Delft, for his feedback and our students for doing some initial tests with the protoypes.
References
1. Hummels, C. (2000) Gestural design tools: Prototypes, experiments and scenarios. Ph. D. Dissertation, Delft University of Technology. 2. Jagacinski, R.J., & Flach, J.M. (2003) Control theory for humans: Quatitative approaches to modeling performance. Mahwah, NJ: Erlbaum. 3. Reeves, B., & Nass, C. (1996) The media equation: How people treat computers, television, and new media like real people and places. Cambridge: Cambridge University Press. 4. Stappers, P.J. (1998) Experiencing non-Newtonian physics in VR. In: Bevan, M. (Ed) Proceedings VRET’97: Virtual Reality in Education & Training '97. Loughborough, UK: June 24-26th. pages 173179