1 Department of Computer Science, Stanford University, Stanford, California, U.S.A. ... We show that the performance of this method is better than expert.
LEARNING INVARIANT FEATURES OF TUMOR SIGNATURE Quoc V. Le1 , Ju Han2 , Paul Spellman3 , Alexander Borowsky4 , and Bahram Parvin2 1 2 3
Department of Computer Science, Stanford University, Stanford, California, U.S.A.
Life Sciences Division, Lawrence Berkeley National Laboratory, Berkeley, California, U.S.A.
Center for Spatial Systems Biomedicine, Oregon Health Sciences University, Portland, Oregon, U.S.A. 4
Center for Comparative Medicine, University of California, Davis, California, U.S.A.
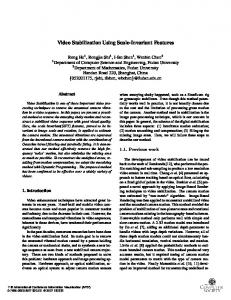
ABSTRACT We present a novel method for automated learning of features from unlabeled image patches for classification of tumor architecture. In contrast to manually designed feature detectors (e.g., Gabor basis function), the proposed method utilizes independent subspace analysis to reconstruct a natural representation. Learning is described as a two-layer network with non-linear responses, where the second layer represents subspace structures. The technique is applied to tissue sections for characterizing necrosis, apoptotic, and viable regions of Glioblastoma Multifrome (GBM) from TCGA dataset. We show that the performance of this method is better than expert designed representation, therefore, promising a wider application of self-learning strategies for tissue characterization. Index Terms— subspace learning, tumor architecture, apoptotic and necrotic signatures 1. INTRODUCTION Our goal is to design and evaluate automated invariant feature detection for classification of tumor signatures observed from hematoxylin and eosin stained (H&E) tissue biopsies. This approach is orthogonal to manually designed feature descriptors, such as SIFT [1] and HOG [2] descriptors, which tend to be complex and time consuming. Furthermore, it is not clear if manual designs of feature detectors (i) capture complex tumor signatures that are necessary for tumor grading, and (ii) remain stable through multiple sets of testing and training data sets. Feature learning is based on a two-layer neural network with square and square root nonlinear responses, respectively, where the second layer forwards subspace structures. In addition to inherent technical variations (e.g., fixation and staining) that originate from protocols practiced by different laboratories, tumor architecture is highly heterogeneous and patient dependent. In Glioblastoma Multiforme (GBM), identification of apoptotic, necrotic, and viable regions are necessary for prediction of outcomes and tumor grading. At the same time, the necrotic signature varies widely and is sometimes mixed with apoptotic regions as shown in Figure 1. Therefore, alternative methods for feature detection are necessary for rapid learning and evaluation of tumor architecture. More importantly, if tumor architecture and composition can be quantified on a very large scale dataset, then it will pave the way for constructing databases that are prognostic, the same way that genome-wide array technologies have identified molecular subtypes and predictive markers.
(a)
(b)
Fig. 1. Histological examples of (a) a viable tumor region and (b) mixed necrotic and apoptotic regions. Each image is presented at 20X resolution.
Organization of the paper is as follows. Section 2 reviews prior research. Section 3 outlines the proposed method and comparison with the manually specified feature detectors. Section 5 concludes the paper. 2. REVIEW OF PREVIOUS RESEARCH Histology sections are often visualized with H&E stains that label DNA and protein contents, respectively, in various shades of color. These sections are typically rich in content since various cell types, cellular organization, cell state and health, and cellular secretion can be characterized by a trained pathologist in spite of inter- and intraobserver variations [3]. A recent review for the analysis and application of H&E sections can be found in [4, 5]; however, from our perspective, three key concepts have been introduced to establish the trend and direction of the research community. The first group of researchers have focused on tumor grading through either accurate or rough nuclear segmentation [6] followed by computing cellular organization [7, 4] and classification. In some cases, tumor grading has been associated with recurrence, progression, and invasion carcinoma (e.g., breast DCIS), but such an association is highly dependent on tumor heterogeneity and mixed grading (e.g., presence of more than one grade), which offers significant challenges to the pathologists as mixed grading appears to be present in 50 percent of patients [8]. A recent study indicates that detailed segmentation and multivariate representation of nuclear fea-
tures from H&E stained sections can predict DCIS recurrence [9] in patients with more than one nuclear grade. In this study, nuclei in the H&E stained samples were manually segmented and a multidimensional representation was computed for differential analysis between the cohorts. The significance of this particular study is that it has been repeated with the same quantitative outcome. In other related studies, image analysis of nuclear features has been found to provide quantitative information that can contribute to diagnosis and prognosis values for carcinoma of the breast [10],prostate [11], and colorectal mucosa [12]. The second group of researchers have focused on patch-based (e.g., region-based) analysis of tissue sections through means of supervised classification. These methods operate by representing each patch with color and texture features [13, 14] for training either kernel or regression tree classifiers. In our previous study, we evaluated and compared emerging techniques of sparse coding with kernel based methods (e.g., support vector machine, kernel discriminant analysis) on a GBM dataset to conclude that the kernel based method did equally as well, if not better, than sparse coding [15]. Selection was based on color and texture features computed from the Laplacian of Gaussian (LoG) response in a local neighborhood. Alternatively, some researchers have investigated how architectural features of tumor grades correlate with fractal dimensions [16]. the third group of researchers have suggested utilizing the detection autoimmune system (e.g., lymphocytes) as a prognostic tool for breast cancer [17]. Lymphocytes are part of the adaptive immune response and their presence has been correlated with nodal metastasis and HER2-positive breast cancer, ovarian [18], and GBM. 3. APPROACH 3.1. Reconstruction through Independent Analysis We present Reconstruction Independent Subspace Analysis (RISA) [19] for automated learning of features from data. RISA is an unsupervised learning algorithm that learns features from unlabeled image patches. A RISA network [20, 19] can be described as a twolayered network (Figure 2), with square and square root nonlinearities in the first and second layers, respectively. The weights, W, in the first layer are learned, and the weights, V, of the second layer are fixed to represent the subspace structure of the neurons in the first layer. Specifically, each of the hidden units in the second layer pools over a small neighborhood of adjacent first layer units. By analogy, to simple and complex cells, we will call the first and second layer units simple and pooling units, respectively.
Fig. 2. The neural network architecture of an ISA network. The red bubbles are the pooling units whereas the green bubbles are the simple units. In this picture, the size of the subspace is 2: each red pooling unit looks at 2 simple units. More precisely, given an input pattern xt , the activation of each
second layer unit is
pi (x
(t)
v uX n X um (t) Vik ( Wkj xj )2 . ; W, V ) = t k=1
j=1
RISA learns parameters W through finding sparse feature representations in the second layer, by solving: minimize W
T X t=1
„
Pm
pi (x(t) ; W, V )+ « T (t) (t) 2 λ kW W x − x k , T i=1
(1)
where {x(t) }Tt=1 are whitened input examples1 . Here, W ∈ Rk×n is the weights connecting the input data to the simple units, V ∈ Rm×k is the weights connecting the simple units to the pooling units (V is typically fixed); n, k, m are the input dimension, number of simple units and pooling units respectively. The first term of the optimization ensures that the features of the highest layer are sparse, whereas the second term ensures that the bases preserve important information of the input data, i.e., they can reconstruct the input data. In Figure 3, we show a pair of filters learned from natural images. As can be seen from this figure, the ISA algorithm is able to learn Gabor filters (“edge detectors”) with many frequencies and orientations. Further, it is able to assemble similar features into a group such that the pooling neurons (p0 s) achieve invariances. For instance, imagine if we have a feature that computes the (L-2) average response of the two very similar looking linear filters in figure 3. If the input data is translated by one or two pixels, the value of the linear filters can change, but the value of the feature that averages their values will change slowly. This concept is called (translational) invariance.
Fig. 3. Typical filters learned by the RISA algorithm when trained on natural images (grayscale images downloaded from the internet). Here, we visualize one group of bases produced by W (each group is a subspace and pooled together). Although this invariant property can be coded by hand, it is only one of many invariances desirable for good pattern recognition. For instance, other invariances such as shape, color, etc. are much more complex to achieve. RISA is an algorithm designed specifically to capture invariance properties from data without expert knowledge. The algorithm works by accumulating invariant properties and outputs a set of relevant invariant features from the dataset. Thanks to this property, it has been illustrated that RISA is able to learn good features for object recognition and activity recognition from images and videos [19]. 1 i.e., the input patterns have been linearly transformed to have zero mean and identity covariance.
0.92
Percentage of correct classification
The above property makes RISA a good candidate for computing features for medical images, a domain where a manual expertly designed feature detector is not only time consuming, but also error prone to diverse tumor signatures. In Figure 4, , we show 12 groups of learned bases. It can be seen that these features are learned and grouped to achieve highly complex invariances from data. Most of these invariances, while relevant to the domain of interest, are difficult to engineer.
0.9
0.88
0.86
0.84
Manual feature RISA feature
0.82
0.8 −3
−2
−1
0
1
2
3
4
5
6
Cost of constraints violation (in log10 scale)
Fig. 5. Performance comparison of features learned from RISA with manually selection features. The classification performance was evaluated based on L2-regularized L2-loss support vector classification implemented through LibLINEAR Library. The plot is a sensitivity analysis for the regularization term, along the X axis, which controls the trade off between regularization and correct classification within the SVM framework.
across the images and then compute the average feature value for the four quadrants. This process leads to 100 (features) × 4 (quadrants) = 400 features to the final classifier. 4. RESULTS
Fig. 4. Typical filters learned from histology sections through application of the RISA algorithm. Here, we show 12 groups of computed bases corresponding to W (each group is a subspace and pooled together). Every two adjacent bases in a row form an invariant group. The second group in row one appears to learn translational invariance, whereas the second group in row five appears to learn rotational invariance. Other groups seem to learn more complex invariances such as color changes (first group of row six and second group of row four).
3.2. Scaling RISA to large images RISA is usually slow for large images. For instance, it takes many hours to learn bases for 80x80 image patches (x ∈ R6400 ). In order to scale RISA to realistically large images, we applied convolution and averaging [19] in the image domain. More specifically, the RISA features are first trained on small image patches (10x10 pixels). They are then applied to all locations on bigger images. Computed features are then averaged by the four quadrants of the image. For example, suppose that we have four features, i.e., four red bubbles in Figure 3. We will convolve each of these four features
The dataset consists of 43 images of varying sizes that have been collected from the NIH repository of The Cancer Genome Atlas (TCGA), including 14 tumor images, 19 necrotic images, and 10 images with mixed necrotic and apoptotic signatures. These images were annotated by the pathologist. Each image has 712x1072 pixels at a 20X resolution. We randomly sampled 50 patches of 80x80 pixels from each image for training and another 50 patches of the same size for testing. The computational modules of RISA were implemented in MATLAB. The performance was evaluated based on L2-regularized L2-loss support vector classification implemented through LibLINEAR [21]. We also compared the proposed subspace learning method with the expert designed feature detector of [15] on the same data with the same classification algorithm. In this study, each image patch is represented with color and blob related features. Color features refers to the basic statistics in the RGB color space, which consists of six features (mean and variance in each of the color channel). Blob features are based on a multi-scale Laplacian of Gaussian (LoG) blob detector, which was applied on gray scale images constructed from B the ratio of the blue to red and green channels ( R+G ).This ratio image highlights the chromatin contents, which eliminates the needs for higher dimensional representation in the RGB space. The LoG blob detector was applied at four scales (σ = 1, 2, 3, 4), and blob features (mean and variance of filter responses) were computed at each scale. Each feature was normalized with a zero mean and variance of one. Comparison results indicate that the features learned from RISA consistently achieve better classification performance than manually selected features, as shown in Figure 5.
5. CONCLUSION In this paper, we presented a novel method for unsupervised feature learning for classification of histological image signatures. The proposed method utilizes independent subspace analysis to reconstruct a natural representation via a two-layer network. The technique is applied to tumor histology for characterizing necrosis, apoptotic, and tumor regions of Glioblastoma Multifrome. Experimental results show that the performance of this method is better than expert designed representation. Acknowledgement This work was supported by NIH grant R01 CA140663 (bp) and U24 CA1437991 (ps) carried out at Lawrence Berkeley National Laboratory under Contract No. DE-AC02-05CH11231. 6. REFERENCES [1] D. Lowe, “Distinctive image features from local scaleinvariant features,” in ICCV, 1999, pp. 1150–1157. [2] N. Dalal and B. Triggs, “Histograms of oriented gradient for human detection,” in CVPR, 2005, pp. 886–893. [3] L. Dalton, S. Pinder, C. Elston, I. Ellis, D. Page, W. Dupont, and R. Blamey, “Histolgical gradings of breast cancer: linkage of patient outcome with level of pathologist agreements,” In Modern Pathology, vol. 13, no. 7, pp. 730–735, 2000. [4] Hang Chang, Gerald Fontenay, Ju Han, Ge Cong, Fredrick Baehner, Joe Gray, Paul Spellman, and Bahram Parvin, “Morphometric analysis of tcga gliobastoma multiforme,” BMC Bioinformatics, vol. 12, no. 1, 2011. [5] Cigdem Demir and Blent Yener, “Automated cancer diagnosis based on histopathological images: A systematic survey,” 2009. [6] L. Latson, N. Sebek, and K. Powell, “Automated cell nuclear segmentation in color images of hematoxylin and eosin-stained breast biopsy,” In Analytical and Quantitative Cytology and Histology, vol. 26, no. 6, pp. 321–331, 2003. [7] S. Doyle, M. Feldman, J. Tomaszewski, N. Shih, and A. Madabhushu, “Cascade multi-class pairwise classifier (cascampa) for normal, cancerous, and cancer confunder classes in prostate histology,” in ISBI, 2011. [8] J. Chapman Miller, N. and E. Fish, “In situ duct carcinoma of the breast: clinical and histopathologic factors and association with recurrent carcinoma,” In Breast Journal, vol. 7, pp. 292– 302, 2001. [9] D. Axelrod, N. Miller, H. Lickley, J. Qian, W. Christens-Barry, Y. Yuan, Y. Fu, and J. Chapman, “Effect of quantitative nuclear features on recurrence of ductal carcinoma in situ (dcis) of breast,” In Cancer Informatics, vol. 4, pp. 99–109, 2008. [10] E. Mommers, N. Poulin, J. Sangulin, C. Meiher, J. Baak, and P. van Diest, “Nuclear cytometric changes in breast carcinogenesis,” In Journal of Pathology, vol. 193, no. 1, pp. 33–39, 2001.
[11] R. Veltri, M. Khan, M. Miller, J. Epstein, L. Mangold, P. Walsh, and A. Partin, “Ability to predict metastasis based on pathology findings and alterations in nuclear structure of normal appearing and cancer peripheral zone epithelium in the prostate,” In Clinical Cancer Research, vol. 10, pp. 3465– 3473, 2004. [12] A. Verhest, R. Kiss, D. d’Olne, D. Larsimont, I. Salman, Y. de Launoit, C. Fourneau, J. Pastells, and J. Pector, “Characterization of human colorectal mucosa, polyps, and cancers by means of computerized mophonuclear image analysis,” In Cancer, vol. 65, pp. 2047–2054, 1990. [13] R. Bhagavatula, M. Fickus, W. Kelly, C. Guo, J. Ozolek, C. Castro, and J. Kovacevic, “Automatic identification and delineation of germ layer components in h&e stained images of teratomas derived from human and nonhuman primate embryonic stem cells,” in ISBI, 2010, pp. 1041–1044. [14] J. Kong, L. Cooper, A. Sharma, T. Kurk, D. Brat, and J. Saltz, “Texture based image recognition in microscopy images of diffuse gliomas with multi-class gentle boosting mechanism,” in ICASSAP, 2010, pp. 457–460. [15] J. Han, H. Chang, L.A. Loss, K. Zhang, F.L. Baehner, J.W. Gray, P.T. Spellman, and B. Parvin, “Comparison of sparse coding and kernel methods for histopathological classification of gliobastoma multiforme,” in Proc. ISBI, 2011, pp. 711–714. [16] M. Tambasco and A. Magliocco, “Relationship between tumor grade and computed architectural complexity in breast cancer specimens,” In Human Pathology, vol. 39, no. 5, pp. 740–746, 2008. [17] H. Fatakdawala, J. Xu, A. Basavanhally, G. Bhanot, S. Ganesan, F. Feldman, J. Tomaszewski, and A. Madabhushi, “Expectation-maximization-driven geodesic active contours with overlap resolution (emagacor): Application to lymphocyte segmentation on breast cancer histopathology,” In IEEE Transactions on Biomedical Engineering, vol. 57, no. 7, pp. 1676–1690, 2010. [18] L. Zhang, J. Conejo-Garcia, P. Katsaros, P. Gimotty, M. Massobrio, G. Regnani, A. Makrigiannakis, H. Gray, K. Schlienger, M. Liebman, S. Rubin, and G. Coukos, “Intratumoral t cells, recurrence, and survival in epithelial ovarian cancer,” In N. Engl. J. Med., vol. 348, no. 3, pp. 203–213, 2003. [19] Quoc V. Le, Will Zou, Serena Yeung, and Andrew Ng, “Learning hierarchical spatio-temporal features for action recognition with independent subspace analysis,” in CVPR, 2011. [20] A. Hyvarinen, J. Hurri, and P.O. Hoyer, Natural Image Statistics, Springer, 2009. [21] R.N. Fan, K.W. Chang, C.J. Hsieh, X.R. Wang, and C.J. Lin, “Liblinear: A library for large linear classification,” Journal of Machine Learning Research, vol. 9, pp. 1871–1874, 2008.