Mar 29, 2018 - simple geometric shapes such as points, lines or polygons. However ...... An approximate solution for the Steiner problem in graphs. Math. Japonica ..... This algorithm is not used in practice because of its nested structure: each iteration ...... Foundations and Trends in Machine Learning, 3(1):1â122. 27.
Learning structured models on weighted graphs, with applications to spatial data analysis Loïc Landrieu
To cite this version: Loïc Landrieu. Learning structured models on weighted graphs, with applications to spatial data analysis. Machine Learning [stat.ML]. PSL Research University, 2016. English. .
HAL Id: tel-01750023 https://tel.archives-ouvertes.fr/tel-01750023 Submitted on 29 Mar 2018
HAL is a multi-disciplinary open access archive for the deposit and dissemination of scientific research documents, whether they are published or not. The documents may come from teaching and research institutions in France or abroad, or from public or private research centers.
L’archive ouverte pluridisciplinaire HAL, est destinée au dépôt et à la diffusion de documents scientifiques de niveau recherche, publiés ou non, émanant des établissements d’enseignement et de recherche français ou étrangers, des laboratoires publics ou privés.
THÈSE DE DOCTORAT de l’Université de recherche Paris Sciences Lettres PSL Research University Préparée à l’École normale supérieure
Learning structured models on weighted graphs, with applications to spatial data analysis Apprentissage de modèles structurés sur graphes pondérés et application à l’analyse de données spatiales
École doctorale n°386 Sciences Mathématiques de Paris Centre Spécialité: Informatique COMPOSITION DU JURY:
Soutenue par Loïc Landrieu le 26 septembre 2016 Dirigée par Guillaume Obozinski et Francis Bach
M BLASCHKO Matthew KU Leuven, Rapporteur M FADILI Jalal ENSICAEN, Rapporteur M BACH Francis INRIA, Directeur de thèse M OBOZINSKI Guillaume ENPC, Directeur de thèse M BONIN Olivier IFSTTAR, Membre du Jury M PESQUET Jean-Christophe Université Paris Est, Membre du Jury M VALLET Bruno IGN, Membre du Jury
ii
iii
Abstract
Modeling complex processes often involves a large number of variables with an intricate correlation structure. For example, many spatially-localized processes display spatial regularity, as variables corresponding to neighboring regions are more correlated than distant ones. More specifically, as natural or man-made boundaries have a profound influence on geostatistical processes, suitable models must be able to take the induced structure into account. The framework of weighted graphs allows us to capture relationships between interacting variables in a compact manner, permitting the resolution of problems involving millions of interacting variables. Furthermore, many spatial analysis tasks can be cast as optimization problems structured by fitting graphs. This thesis, motivated by the kind of optimization problems arising from geostatistical data analysis, makes two types of contribution: it develops new algorithms which solve existing problems faster and introduces a new model for processes defined on weighted graphs. The first part of this manuscript focuses on optimization problems with graph-structured regularizers, such as the total variation or the total boundary size. First, we present the convex formulation and its resolution with proximal splitting algorithms. We introduce a new preconditioning scheme for the existing generalized forward-backward proximal splitting algorithm, specifically designed for graphs with high variability in neighborhood configurations and edge weights. We then introduce a new algorithm, cut pursuit, which exploits the links between graph cuts and total variation in a working set scheme. We also present a variation of this algorithm which solves the non-convex formulation penalized by the boundary size. We show that our proposed approaches reach or outperform state-of-the-art methods for geostatistical aggregation as well as image recovery problems. The second part focuses on the development of a new model, expanding continuous-time Markov chain models to general undirected weighted graphs. This model allows us to take into account the interactions between neighboring nodes in structured classification more precisely. We demonstrate the advantages of this model for supervised land-use classification from cadastral data.
Résumé
La modélisation de processus complexes peut impliquer un grand nombre de variables ayant entre elles une structure de corrélation potentiellement compliquée. Par exemple, les processus décrivant des phénomènes spatiaux possèdent souvent une forte régularité spatiale, se traduisant par une corrélation entre variables d’autant plus forte que les régions correspondantes sont proches. Les obstacles naturels ou artificiels jouent également un rôle structurant très fort sur les processus géospatiaux, renforçant ou bloquant la corrélation entre variables associées aux régions qu’ils séparent. Le formalisme des graphes pondérés permet de capturer de manière compacte ces relations entre variables, autorisant le traitement de problèmes impliquant des millions de variables interdépendantes. De nombreux problèmes d’analyse de données spatiales se traduisent ainsi en termes d’optimisation structurée par des graphes pondérés. Les contributions de cette thèse, motivées par les problèmes d’optimisations associés à l’analyse de données géospatiales, sont de deux natures: le développement de nouveaux algorithmes permettant la résolution efficace des problèmes associés à des modèles existants, et la création d’un nouveau modèle plus précis pour les processus définis sur un graphe pondéré. La première partie du manuscrit se concentre sur la résolution efficace de problèmes de régularisation spatiale, mettant en jeu des pénalités telle que la variation totale ou la longueur totale des contours entre régions constantes. Nous traitons en premier l’approche convexe et sa résolution à l’aide d’algorithmes dit d’éclatement proximal. Nous présentons une stratégie de préconditionnement de l’algorithme generalized forward-backward qui est spécifiquement adaptée à la résolution de problèmes structurés par des graphes pondérés présentant une grande variabilité de configurations et de poids. Nous présentons ensuite un nouvel algorithme appelé cut pursuit, qui exploite les relations entre les algorithmes de flots et la variation totale au travers d’une stratégie dite de working set. Nous présentons également une variante de l’algorithme adaptée à la minisation de fonctions pénalisées par la longguer totale des contours des régions constantes. Ces algorithmes présentent des performances supérieures à l’état de l’art pour des tâches de traitement de l’image ainsi que pour des problèmes d’agrégation de données géostatistiques. La seconde partie de cete thèse se concentre sur le développement d’un nouveau modèle qui étend les chaînes de Markov à temps continu au cas des graphes pondérés non orientés. Ce modèle autorise la prise en compte plus fine des interactions entre nœuds voisins dans le cadre de la prédiction structurée, comme nous l’illustrons pour la classification supervisée de tissus urbains à partir de données cadastrales.
vi
Dedication
Á Alex et Mado, qui ont transmis à Blandine et à moi deux très précieux cadeaux: le goût des sciences et de l’effort.
viii
Acknowledgements
I would like to thank first my advisors, Guillaume Obozinski and Francis Bach, for having me as a PhD student. The best ideas of this manuscript came at the white board with Guillaume, or on the RER A - to the despair of our fellow passengers. I want to thank Hugo Raguet for our shared passion and the late night discussions at the black board, under the incredulous eye of Peter and Paulette. I feel very lucky to have spent some times in such dynamic and impressive teams as SIERRA-WILLOW and IMAGINE. The coffee machine talks and after-work beers were always a great motivation boost, and also simply a nice time. I am thankful to Jean-Yves Audibert who was my first contact with the research world and whose encouraging words lead me to pursue this PhD. I would like to give a special thanks to my family and friends for their continuing support during those years, and to Alix for her careful editing.
x
Contents
. . . . . . .
. . . . . . .
. . . . . . .
. . . . . . .
. . . . . . .
. . . . . . .
. . . . . . .
. . . . . . .
. . . . . . .
. . . . . . .
. . . . . . .
. . . . . . .
. . . . . . .
. . . . . . .
. . . . . . .
1 2 3 4 6 7 10 12
2 Proximal methods for structured optimization 2.1 Introduction . . . . . . . . . . . . . . . . . . . . 2.2 Structured optimization problems . . . . . . . . 2.3 Proximal splitting for structured optimization . 2.4 Generalized forward-backward . . . . . . . . . . 2.5 Experimental setup and results . . . . . . . . . 2.6 Conclusion . . . . . . . . . . . . . . . . . . . . .
. . . . . .
. . . . . .
. . . . . .
. . . . . .
. . . . . .
. . . . . .
. . . . . .
. . . . . .
. . . . . .
. . . . . .
. . . . . .
. . . . . .
. . . . . .
. . . . . .
19 19 20 24 28 35 39
1 Introduction 1.1 Spatial data and geostatistics . . . . . . . . 1.2 Spatial data analysis . . . . . . . . . . . . . 1.3 Characteristics of geostatistical data . . . . 1.4 The weighted graph framework . . . . . . . 1.5 Variational aggregation on weighted graphs 1.6 Graph structured prediction . . . . . . . . . 1.7 Organisation of the thesis . . . . . . . . . .
. . . . . . .
3 Aggregating spatial statistics with a generalized forward-backward 47 splitting algorithm 3.1 Aggregation as an optimization problem . . . . . . . . . . . . . . . . . . 47 3.2 Interpretation . . . . . . . . . . . . . . . . . . . . . . . . . . . . . . . . . 49 4 Cut Pursuit: fast algorithms to learn piecewise constant functions on general weighted graphs 4.1 Introduction . . . . . . . . . . . . . . . . . . . . . . . . . . . . . . . . . . 4.2 A working set algorithm for total variation regularization . . . . . . . . 4.3 Minimal partition problems . . . . . . . . . . . . . . . . . . . . . . . . . 4.4 Experiments . . . . . . . . . . . . . . . . . . . . . . . . . . . . . . . . . . 4.5 Conclusion . . . . . . . . . . . . . . . . . . . . . . . . . . . . . . . . . . .
59 59 65 74 82 94
5 Learning in graphical models 101 5.1 Introduction . . . . . . . . . . . . . . . . . . . . . . . . . . . . . . . . . . 101 5.2 Undirected graphical models . . . . . . . . . . . . . . . . . . . . . . . . . 102
xi
CONTENTS
5.3 5.4 5.5
Potts model . . . . . . . . . . . . . . . . . . . . . . . . . . . . . . . . . . 106 Continuous time Markov models . . . . . . . . . . . . . . . . . . . . . . 111 Conclusion . . . . . . . . . . . . . . . . . . . . . . . . . . . . . . . . . . . 115
6 Continuously indexed Potts model 6.1 Introduction . . . . . . . . . . . . . 6.2 Continuous graph Potts models . . 6.3 Learning with continuous graphs . 6.4 Experiments . . . . . . . . . . . . . 6.5 Conclusion . . . . . . . . . . . . . .
. . . . .
. . . . .
. . . . .
. . . . .
. . . . .
. . . . .
. . . . .
. . . . .
. . . . .
. . . . .
. . . . .
. . . . .
. . . . .
. . . . .
. . . . .
. . . . .
. . . . .
. . . . .
. . . . .
. . . . .
. . . . .
119 119 122 127 133 142
A Converting spatial data to graph 149 A.1 Converting spatial data to graph . . . . . . . . . . . . . . . . . . . . . . 149 B Appendix of Chapter 2
159
Bibliography
161
C Appendix of Chapter 4
163
D Appendix of Chapter 6
171
xii
Chapter 1
Introduction Everything is related to everything else, but near things are more related than distant things. First Law of Geography Waldo Tobler, 1970
Nearly two hundred years ago, De Châteauneuf (1834) represented the death toll of a cholera epidemic using colour gradients over a partition of Paris into districts. This historic report is considered to be the first attempt at formalizing a geographical process to facilitate its analysis (Coppock and Rhind, 1991). Over a century and a half later, Dana Tomlin developed the Map Algebra framework, a formalization of geographical information mapping ground in set theory (Tomlin, 1990, 2013). This framework is still the at the core of modern approaches to spatial data analysis and implemented in most mapping softwares (Theobald, 2007). From hyperspectral satellite imagery to mobile laser scanning and web-based technologies, our capacity to collect information has exceeded the capacity of geographers to process it. Consequently the need for automated analysis tools for large-scale geographic databases has became more and more obvious. The advent of computer systems permitted the creation of the first Geographic Information System (GIS) by Tomlinson (1968), which tremendously increased cartographers’ power of analysis (Chrisman, 2006). However special caveats must be taken into account when considering spatial statistics, and operations on geographical data must be performed within a framework that captures the data’s spatial configuration with precision. Furthermore as the size of available data keeps increasing, a modern data analysis approach must be developed (Chen et al., 2006; Graham and Shelton, 2013). After first defining spatial data analysis, we will describe the specific characteristics of spatial data themselves. We will then present a graph-based framework that is able to capture some of these characteristics. Finally we present present the graphbased optimization problems developed in this thesis, as well as their applications as geographical operations on spatial data.
1
1. INTRODUCTION
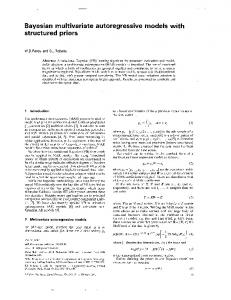
Figure 1.1: Rastered average income of Grand Lyon at different scales. From left to right: Intercommunality of Grand Lyon, city of Lyon, first Arrondissement
1.1
Spatial data and geostatistics
Spatial data designate information relative to objects defined within a two or three dimensional space. These objects are typically either elements of a grid, or present simple geometric shapes such as points, lines or polygons. However spatial data also include a wide variety of objects, such as 3D objects, networks or irregular partitions such as Triangulate Irregular Network (Peucker et al., 1978). Each object is associated with an array of numeric values, which can vary greatly from attitude in the case of Digital Elevation Models (Zhang and Montgomery, 1994), to disease rates in the case of epidemiology (Clarke et al., 1996) or even socio-economic values (Wang, 2014). Importantly, geometric features such as length, surface or eccentricity of objects are often also provided when applicable. To efficiently retrieve information, spatial databases use spatial indexing of objects, typically with a grid or with more sophisticated structures such as R-trees (Guttman, 1984). In this thesis we focus on geostatistical data, a subset of spatial data in which the observed values are taken as realizations of random variables. Its particularity in terms of statistics is its intricateness, as correlations between variables corresponding to adjacent objects play a prevalent role. The oldest and most frequently used spatial data structure is the raster, in which objects are the cells of a regular lattice and whose values describe their content. For example the French National Institue for Statistics and Economic Research has made public a spatialized database composed of 18 socio-economic variables on a 200 × 200m raster, represented in Figure A.1. More generally any kind of aerial/satellite imagery can be interpreted as a raster data in which the cells are the pixels. The other important data format is vector data, which are often used when the modelling requires a higher degree of precision, for example at the level of individual buildings or roads. The geometry of each object, be it polygonal or linear, is given by a sequence of georeferenced segments, as shown in Figure A.3.
2
1.2 Spatial data analysis
Figure 1.2: Buiding shape (top) and road network (bottom) at different scales. From left to right: Intercommunality of Grand Lyon, city of Lyon, first Arrondissement.
1.2
Spatial data analysis
Spatial data analysis covers the array of methods used to extract knowledge from spatial data, from prediction to semantic labelling. It is used in many different fields such as biology or socioeconomics, and has theoretical foundations in many different fields of mathematics and computer science. The rest of this section provides a noncomprehensive list of spatial data analysis tasks. Interpolation. Motivated by mining exploration as a way to map underground ore from very sparse observations, interpolation consists in estimating unknown values from observed data. While methods such as linear or bilinear interpolation (Shepard, 1968) have long existed, interpolation as applied to spatial data was at the origin of the development of the field of geostatistics (Matheron, 1962), which interprets spatial data as realizations of correlated random variables. The methods developed, such as kriging, have many links with modern statistical tools such as Gaussian processes (Williams, 1998) and are still widely used today, for example to estimate wood volumes in forested areas (Maselli and Chiesi, 2006). Classification. Classification is the task of annotating spatial objects into semanticallydefined classes, for example, classifying urban areas according to their nature, be it dense habitat, individual housing, periphery, agricultural land and so on. It has applications in many domains such as deforestation analysis (Asner et al., 2005; Seto et al., 2012) or urban modelling (Rellier et al., 2004; Voisin et al., 2013; Zhou and Neumann, 2012). This task is closely related to computer vision and shares many of the same models, such as CRFs (Hoberg et al., 2015) or deep neural networks (Pacifici et al., 2009). The
3
1. INTRODUCTION
classification is usually performed over radiometric measurements such as RGB channels, but also hyperspectral imaging (Camps-Valls et al., 2014; Rellier et al., 2004), SAR images (Oliver and Quegan, 2004; Voisin et al., 2013), elevation models (Kluckner et al., 2009) or LIDAR echos (Weinmann et al., 2014). Gomez-Chova et al. (2015) states that the best classification rates are obtained when using a combination of different sources. Generalization. Cartographic generalization is the task of formatting information so that it can be represented in an intelligible way on a map at a given scale (Brassel and Weibel, 1988; Gruenreich, 1992; Shea and McMaster, 1989). It involves discarding unimportant or redudant objects, selecting and enhancing relevant ones, as well as displacing them when necessary. It can also involve aggregating similar objects into larger ones. While many aspects of cartographic generalization are centered around human perception, aggregation can be translated in mathematical terms as we will show in Section 1.5. Modelling. Modelling is the task of understanding and simulating urban and geograpical processes. One of the most iconic models is the Concentric Ring Model introduced by Burgess (1967), which attempted to model the growth of the city of Chicago and explain the wealth distribution within its different areas. Numerous models also develop the links between urbanisation and industry (Wegener, 1994) as well as transportation networks (Wegener, 2004). Simulations of these processes and interactions are often performed at the individual level though multi-agent systems (Batty and Jiang, 1999; Chaker, 2009; Parker et al., 2003). Prediction. Prediction is the branch of modeling focused on the evolution of dynamic urban and geographical processes such as urban growth (He et al., 2006) or climate change (Houghton and Callander, 1992). Cellular automata (Goodchild et al., 1996) are widely used for raster data. This approach consists of discretizing the space into cells which can be in different states, and whose evolution is determined by a set of rules involving the states of the neighborhood cells. Detection. As the quantity of information and the number of objects consituting spatial databases keeps increasing, detecting specific objects or events proves crucial, such as forest fires (Lafarge et al., 2006) or vegetation (Zhou et al., 2011). Close to its computer vision counterpart, spatial object detection focuses on finding a given class of object in a geographical database (Ardeshir et al., 2014; Crandall et al., 2009). Detecting events in temporal spatial data can also be used to monitor disease outbreaks (Watkins et al., 2009; Wiafe and Davenhall, 2005).
1.3
Characteristics of geostatistical data
Geostatistical data have some specific characteristics that need to be taken into account for their analysis. Here we present a non-comprehensive list of such traits. Spatially-correlated. As formalized by Tobler (1970) as the First Law of Geography, objects that are closer are more correlated. Indeed proximity and adjacency play an important structuring role and in general geographical processes can be assumed to only
4
1.3 Characteristics of geostatistical data
candidate A
low density
candidate B
high density
Figure 1.3: Illustration of the variability of elements in spatial data. On the left, the 2007 presidential election results are broken down by constituency in French Brittany. On the right, we show population density, with dark red standing for densely-inhabited constituencies.
change gradually in space. Geometrically-constrained. Geographical spaces are structured not only by natural obstacles such as rivers and mountains, but also man-made boundaries such as road networks or administrative borders. Consequently, although proximity does indeed play an important role, spatial data also display sharp changes across geometrical divides. Models of spatial processes must therefore be able to accomodate simultaneously spatial regularity and sharp transitions. Multi-scale. Spatial data pertains to the content of a geographical space at a given scale, however it is rarely the case that such spaces are free from influence operating at a much larger or smaller scale. For example the growth pattern of a city can’t be fully explained without a nation-wide analysis of labour market and migration. Conversely, analysis of spatial processes such as the influence of transportation over land use by monitoring car flows lies fundamentally on behavior and decisions taken at the individual level. Consequently, the level at which spatial data analysis operates is a delicate matter that will influence its outcome. Multi-modality. As stated earlier, proximity plays an important structuring role over spatial data. However the relevant notion of distance can change depending on the application, and multiple distances can be at play in a single application. Indeed while transportation analyses often use the topological distance along the road network, the speed and capacity of each road can also be taken into account to define accessibility (Weiping and Chi, 1989). When studying land use interaction, other metrics can be designed to take into account their proximity such as length of shared borders, shortest distance between buildings in a block (Veenendaal et al., 2000). Heterogeneity. Unlike image analysis in which all pixels are similar in importance and configuration, elements of spatial databases display more variability. For example the results of an election aggregated by voting constituencies should be intepreted without forgetting to take into account the number of voters, as (see Figure 1.3).
5
1. INTRODUCTION
1.4
The weighted graph framework
Weighted graphs are a general framework for modeling interactions between entities (Balakrishnan and Ranganathan, 2012; Berge, 1958; Harary, 1969). Therefore they appear as a natural tool to capture the structure of spatial data and formalize their analysis (Gaetan and Guyon, 2008). A weighted graph G = (V, E) is defined by a node set V , usually identified by an integer so that : V = [1, · · · , n], and an edge set E ⊂ V × V linking nodes two by two. We denote the number of the edge by m = |E| . Each edge (i, j) is weighted by a non-negative real number wij ∈ R+ . Each node i is weighted by a non-negative real number µi ∈ R+ . We consider spatial data associating a real statistical value to regions partionning a bounded space of dimension D = 2 or 3. In the weighted graph framework, the regions consituting the spatial data are represented by the node set V while the relationship of proximity between pairs of elements are represented by edges. The degree of proximity can be represented by the edge weight w, usually the higher the weight, the closer the regions. The variability of importance of the elements can be encoded by the node weight µ. See Appendix A for details about converting vector and raster data to weighted graphs. In this framework, geostatistical data can be represented as a vector x ∈ Rn . Graphs with weighted edges are very common in a number of fields including graph theory, operational research and machine learning (Shi and Malik, 2000; Zhu et al., 2005). As emphasized in the previous section, regions constituting spatial data can be very different from one another, be it in size, shape or content. Consequently, the graph considered must be able to take this property into account which is why each node is associated with a weigh µ. Although graphs with node weights are studied in depth in computer science (Takahashi and Matsuyama, 1980), they are seldom used in machine learning to the author’s knowledge. The graph structure of urban space has been studied extensively, in particular for network analysis (Thomson and Richardson, 1995). Indeed the analysis of the graph morphology itself, whether it was obtained from the network itself or to capture relationship between spatial objects, can be very informative regarding the geographical space being considered (Doğrusöz and Aksoy, 2007; Erath et al., 2009). In this thesis we consider however problems involving variables whose relationships are determined by the graph, rather than the structure of the graph itself, as formalized by Gaetan and Guyon (2008, Chapter 2). This approach allows us to capture the structure and variability specific to spatial data. Indeed spatial correlations as well as geometrical constraints can be encoded by the edges of the graph and their respective weights. The variability of importance among elements can be described by the weight of the nodes. More importantly, as shown in the next sections, the weighted graph framework allows us to cast certain data
6
1.5 Variational aggregation on weighted graphs
Figure 1.4: Graph conversion corresponding to the French Regions as of 2014 (from INSEE). Each node corresponds to a region and the edges correspond to adjacency.
analysis tasks on spatial data as optimization problems on graphs.
1.5
Variational aggregation on weighted graphs
Map generalization is the problem of representing complex spatial data in a readable map to provide decision makers with an overall view of the land and its main characteristics (Lee, 1996). Aggregation is one of the operations in cartographic generalization, and consists of merging adjacent regions of a geographical space to improve readability. This operation requires finding a trade-off between the simplicity of the resulting map and faithfulness to the original data. Spatial data can be highly sensitive to the parameters of aggregation, such as the scale or the shape of the regions. This sensitivity decreases the robustness and interpretability of the resulting aggregation, as minute changes in parameters could lead to vastly different results, as illustrated in Figure 1.5. This problem, first observed in Gehlke and Biehl (1934), was later referred to as the Modifiable Area Unit problem by Openshaw (1984). It is still mostly unresolved and at the center of spatial statistics research (Holt et al., 1996; Nelson and Brewer, 2015). Several models allow us to understand how the aggregation effects work on spatial statistics. For example Cockings et al. (2011) designed an automated procedure to produce appropriate zoning for census, in particular ensuring homogeneity in population size and built environment.
Aggregation as a clustering task Merging adjacent regions with similar statistics to obtain a simpler representation can be formulated from a machine learning perspective as a clustering problem with structural constraints. In fact, we argue that within the weighted graph framework, we can formulate this geographical problem into a classic optimization problem.
7
1. INTRODUCTION
Figure 1.5: Illustration of the Modifiable Area Unit Problem. From the same pointwise data, one can obtain vastly different aggregations by either a change of scale or a shift of the grid.
In machine learning, clustering is often performed to group together data points that have similar features, the k-means algorithm being the most famous example (MacQueen et al., 1967) of clustering algorithms. However it does not take into account the simplicity of the resulting representation. Spectral clustering is another classical method used to cluster data points on a graph. The structure of the graph is derived from the similarity matrix of the features associated with each node (Shi and Malik, 2000). In spatial data aggregation however, the adjacency of the nodes derives from geographicaldistance measures and not from their respective features. Following the ideas of (Mumford and Shah, 1989) in image processing, we define a map as simple if it can be partitioned into regions with constant statistics, and such that the total length of their contour is small. The rationale behind this choice is that a representation with short contours will be easy to read as it must have few constant regions with clean borders. The simple, piecewise constant approximation of an input image is defined as the result of an optimization problem, in which a data fidelity term is regularized by the contour length of the regions. The fidelity term insures fidelity to the original data while the regularizer inforces the simplicty of the solution. When the number of partitions is fixed in advance, this problem is known as the minimal partition problem or the (spatially continuous) Potts model Pock et al. (2009); Santner et al. (2011). When the fidelity term is the squared difference with the observation, this model is called the piecewise constant Mumford-Shah problem. For an observed image represented by a square integrable function J ∈ L2 (R2 ), and
8
1.5 Variational aggregation on weighted graphs
a candidate image with bounded variation I ∈ BV (R2 ) composed of k constant regions R = {Ri }ki=1 , the piecewise constant Mumford-Shah problem writes: min R
k Z X i=1
(Ii − J(x))2 dx + λ Per(R),
(1.1)
Ri
R R with Ii = Ri J(x)dx/ Ri dx the constant values of I in region Ri and Per(R) the total surface interface of the boundaries of the constant region set R, as defined in (Chambolle et al., 2010, equation 90). Note that Per(R) in dimension 2 is the length, and the surface in dimension 3. λ is a non-negative value controlling the regularization strength.
Expression within the weighted graph framework This approach, initially designed for the processing of images viewed as continuous functions, can be applied to the discrete setting in which elements correspond to a partition of a space Ω of dimension D = 2 or 3. More generally, graph can capture geographical space of dimension more than 2 Let P be a partition of Ω into n regions {P1 , · · · , Pn }. We consider the weighted graph G = (V, E, µ, w) such that V = {1, · · · n} corresponds to the regions of P, E the the pairs of adjacent � regions, µv the suface or volume of each region, and finally ¯ ¯ wv,v′ = HD−1 Pv ∩ Pv′ the perimeter of the interface shared by each pair of adjacent regions (formally the D − 1-Hausdorf measure of the intersection of the topological closure of adjacent regions). For J ∈ Rn , the set of observed features for all regions and I ∈ Rn×d the candidate estimation, the fidelity term can be rewritten with V and µ: X µv (Iv − Jv )2 , v∈V
with Iv the value of I in region Pv . Note that in this formulation the number of constant regions k does not appear explicitly, although it is bounded by n, the total number of regions in Ω. The perimeter of the constant regions can also be expressed with the edge set E and the weight w: X length(R) = wv,v′ δ(Jv 6= Jv′ ), (v,v ′ )∈E
with δ(x 6= y) being equal to zero if x = y and 1 elsewhere. The minimal partition problem (1.1) can be rewritten with the graph structure: X X min µv kIv − Jv k22 + β wv,v′ δ(Jv 6= J′ v ), (1.2) I
v∈V
(v,v ′ )∈E
Equation (1.2) corresponds to the minimization of a non-continuous, non-differentiable and non-convex energy, which makes it a very difficult problem. Rudin et al. (1992) introduced the total variation, a convex penalization to spatially regularize images while conserving sharp edges. This regularizer is also a simplicityinducing penalty, and can be translated in the weighted graph framework as follows:
9
1. INTRODUCTION
min I
X
µv kIv − Jv k22 + β
v∈V
X
wv,v′ |Iv − Jv |,
(1.3)
(v,v ′ )∈E
with k·k the norm in Rd . This approach boasts numerous applications in various fields such as vision and signal processing. Chapter 2 presents modern approaches to the resolution of problem (1.3) and presents a novel algorithm allowing for faster resolution. An application of this algorithm to spatial data aggregation is given in Chapter 3. Chapter 4 proposes a novel family of algorithms designed to solve problems of both problems (1.2) and (1.3) when the results are expected to be simple.
1.6
Graph structured prediction
Probabilistic Classification A central task of automatic analysis of geographical information is the classification of regions into different predefined types. This task is performed by compiling a list of attributes for each parcel which can come from not only aerial or satellite imagery (Santos and Moreira, 2006), but also socio-economic or cadastral data (Johanna et al., 2013). The regions are then classified into the different categories, for example using predefined rules (Malinverni et al., 2010). A discriminative classifier can also be trained from an ensemble of hand-annotated parcels Santos and Moreira (2006). The generative approach to classification is to build a probabilistic model of the process generating the data. We consider a set of n regions for which we observe a label in [1 · · · K]. The model, parametrized by a vector θ, determines the emission probability of a labelling y = (y1 , · · · , yn ). We denote ℓ(θ, y) the log-likelihood of parameter θ having generated the labels y: ℓ(θ; y) = log (P (y; θ)) This model allows us to to learn the parameters θˆ that best fit the observed labelling: θˆ = arg min −ℓ (θ; y). θ
Conversely, when the parameter θ is fixed, the model allows us to estimate the probability that a node i has labels yi : P (yi ; θ). We refer to this task as probabilistic inference.
Land-use classification on a graph Land-use shows some spatial regularity: we are unlikely to find an industrial plot between residential parcels. Consequently, when establishing a model for land-use, the ability to take the spatial structure into account is an important feature of the weighted graph framework. From vector or cadastral data we can construct a graph G = (V, E, µ, w) in which the nodes are the regions and the edges links neighboring regions. The node weight µ encodes the importance of the regions while the edge weight w encodes the proximity between linked regions. See Appendix A for more details on how to build this graph.
10
1.6 Graph structured prediction
Figure 1.6: On the left is a partition of the French city of Sevran into city blocks. On the right we show the associated weighted graph encoding proximity. The distance between points - and hence their influence - varies across edges.
Potts models are a powerful framework to perform inference and learning for discrete processes structured by graphs, as detailed in chapter 5. This model is well-suited for land-use as it can model the influence of neighboring regions. Johanna et al. (2013) use local context and proximity by exploiting the grid-structure of the data with a Potts model. For a process modelled by a Potts model structured by graph G = (V, E, µ, w), the log-likelihood writes:
ℓ(y; θ) ∝
X
ǫi (yi ) +
i∈V
n X
ǫij (yi , yj ),
(i,j)∈E
with ǫi (yi ) the potential associated node being in state yi , and ǫi,j (yi , yj ) the potential of a transition between labels yi and yj taking place between two neighboring nodes. Potential are a generalization of probabilities which do not need to be normalized. States associated with higher potential values are more likely. Chapter 4 presents a review of inference and learning within this model. We argue, however, that in order to accurately capture the spatial structure of the data, the model must be able to take into account the edges’ weights. Indeed all proximities between regions are not all equivalent, as illustrated in Figure 1.6. In the case of land-use, neighboring regions can have varying degrees of influence, depending on the length of the shared boundaries or the proximity of the respective buildings for example. In Chapter 5 we present a novel graphical model, the Continuously Indexed Potts Model, which allows us to continuously model proximity between nodes and thus take the influence of neighboring regions into account more accurately. Furthermore our model allows us to learn parameters to fit a partially observed labelling.
11
1. INTRODUCTION
1.7
Organisation of the thesis
Chapter 2 presents an overview of proximal splitting methods for solving convex structured optimization problems, in particular the generalized forward-backward algorithm. A novel preconditioning scheme for this algorithm is introduced, which is well adapted for problems structured by graphs with high variance in edge weights and neighborhood size. On such problems, our approach reaches state-of-the-art levels of performance. Chapter 3 describes an application of the preconditioned generalized forward-backward algorithm on a map simplification task. We show that the proposed formulation allows for simplified maps with adaptive scales, thus allowing for increased levels of detail near high population centers. Chapter 4 introduces a new algorithm called cut pursuit to solve problems regularized with either the convex total variation or its non-convex counterpart, the total perimeter. This algorithm exploits the links existing between the total variation and graph-cut algorithms in a working set scheme in which the graph is iteratively split into constant regions until the optimum is reached. On problems with few level-sets this algorithm is significantly faster than other approaches. Chapter 5 reviews inference and learning in graphical models. In particular we discuss the Potts models and continuous time Markov chains for processes structured respectively by an unweighted unoriented general graph and an oriented weighted chain-like graph. Chapter 6 introduces the continuously indexed Potts model, which is designed to take edge weights into account in a consistent manner in the parameterization of a learnable model. A dedicated EM algorithm is then proposed to learn the model.
12
Bibliography Ardeshir, S., Zamir, A. R., Torroella, A., and Shah, M. (2014). GIS-assisted object detection and geospatial localization. In Computer Vision–ECCV 2014, pages 602– 617. Springer. 4 Asner, G. P., Knapp, D. E., Broadbent, E. N., Oliveira, P. J., Keller, M., and Silva, J. N. (2005). Selective logging in the Brazilian Amazon. Science, 310(5747):480–482. 3 Balakrishnan, R. and Ranganathan, K. (2012). A textbook of graph theory. Springer Science & Business Media. 6 Batty, M. and Jiang, B. (1999). Multi-agent simulation: new approaches to exploring space-time dynamics in GIS. 4 Berge, C. (1958). La theorie des graphes. Dunod. 6 Brassel, K. E. and Weibel, R. (1988). A review and conceptual framework of automated map generalization. International Journal of Geographical Information System, 2(3):229–244. 4 Burgess, E. W. (1967). The growth of the city: an introduction to a research project. Ardent Media. 4 Camps-Valls, G., Tuia, D., Bruzzone, L., and Atli Benediktsson, J. (2014). Advances in hyperspectral image classification: Earth monitoring with statistical learning methods. Signal Processing Magazine, IEEE, 31(1):45–54. 4 Chaker, W. (2009). Modélisation multi-échelle d’environnements urbains peuplés: application aux simulations multi-agents des déplacements multimodaux. PhD thesis, Université Laval. 4 Chambolle, A., Caselles, V., Cremers, D., Novaga, M., and Pock, T. (2010). An introduction to total variation for image analysis. Theoretical foundations and numerical methods for sparse recovery, 9:263–340. 9 Chen, Y.-Y., Suel, T., and Markowetz, A. (2006). Efficient query processing in geographic web search engines. In Proceedings of the 2006 ACM SIGMOD International Conference on Management of Data, pages 277–288. ACM. 1
13
BIBLIOGRAPHY
Chrisman, N. (2006). Charting the unknown: How computer mapping at Harvard became GIS. Esri Press. 1 Clarke, K. C., McLafferty, S. L., and Tempalski, B. J. (1996). On epidemiology and geographic information systems: a review and discussion of future directions. Emerging Infectious Diseases, 2(2):85. 2 Cockings, S., Harfoot, A., Martin, D., Hornby, D., et al. (2011). Maintaining existing zoning systems using automated zone-design techniques: methods for creating the 2011 census output geographies for England and Wales. Environment and PlanningPart A, 43(10):2399. 7 Coppock, J. T. and Rhind, D. W. (1991). The history of GIS. Geographical Information Systems: Principles and Applications, 1(1):21–43. 1 Crandall, D. J., Backstrom, L., Huttenlocher, D., and Kleinberg, J. (2009). Mapping the world’s photos. In Proceedings of the 18th International Conference on World Wide Web, pages 761–770. ACM. 4 De Châteauneuf, L.-F. B. (1834). Rapport sur la marche et les effets du Choléra-Morbus dans Paris et les communes rurales du département de la Seine, Année 1832. Impr. royale. 1 Doğrusöz, E. and Aksoy, S. (2007). Modeling urban structures using graph-based spatial patterns. In Geoscience and Remote Sensing Symposium, 2007. IGARSS 2007. IEEE International, pages 4826–4829. IEEE. 6 Erath, A., Löchl, M., and Axhausen, K. W. (2009). Graph-theoretical analysis of the swiss road and railway networks over time. Networks and Spatial Economics, 9(3):379–400. 6 Gaetan, C. and Guyon, X. (2008). Modélisation et statistique spatiales. Springer. 6 Gehlke, C. E. and Biehl, K. (1934). Certain effects of grouping upon the size of the correlation coefficient in census tract material. Journal of the American Statistical Association, 29(185A):169–170. 7 Gomez-Chova, L., Tuia, D., Moser, G., and Camps-Valls, G. (2015). Multimodal classification of remote sensing images: a review and future directions. Proceedings of the IEEE, 103(9):1560–1584. 4 Goodchild, M. F., Steyaert, L. T., and Parks, B. O. (1996). GIS and environmental modeling: progress and research issues. John Wiley & Sons. 4 Graham, M. and Shelton, T. (2013). Geography and the future of big data, big data and the future of geography. Dialogues in Human Geography, 3(3):255–261. 1
14
BIBLIOGRAPHY
Gruenreich, D. (1992). ATKIS - a topographic information system as a basis for GIS and digital cartography in germany. From Digital Map Series to Geo-Information Systems, Geologisches Jarhrbuch Series A. Hannover, Germany: Federal Institute of Geosciences and Resources. 4 Guttman, A. (1984). R-trees: a dynamic index structure for spatial searching. In Proceedings of the 1984 ACM SIGMOD international conference on Management of data, pages 47–57. ACM. 2 Harary, F. (1969). Graph theory. Westview Press. 6 He, C., Okada, N., Zhang, Q., Shi, P., and Zhang, J. (2006). Modeling urban expansion scenarios by coupling cellular automata model and system dynamic model in Beijing, china. Applied Geography, 26(3):323–345. 4 Hoberg, T., Rottensteiner, F., Queiroz Feitosa, R., and Heipke, C. (2015). Conditional random fields for multitemporal and multiscale classification of optical satellite imagery. Geoscience and Remote Sensing, IEEE Transactions on, 53(2):659–673. 3 Holt, D., Steel, D., Tranmer, M., and Wrigley, N. (1996). Aggregation and ecological effects in geographically based data. Geographical Analysis, 28(3):244–261. 7 Houghton, J. T. and Callander, B. A. (1992). Climate change 1992. Cambridge University Press. 4 Johanna, B., Etienne, C., Aknin, P., and Bonin, O. (2013). Hierarchical and multiscale mean shift segmentation of population grid. In 22th European Symposium on Artificial Neural Networks (ESANN 2013), page 6p. 10, 11 Kluckner, S., Mauthner, T., Roth, P. M., and Bischof, H. (2009). Semantic classification in aerial imagery by integrating appearance and height information. In Computer Vision–ACCV 2009, pages 477–488. Springer. 4 Lafarge, F., Descombes, X., Zeruda, J., and Mathieu, S. (2006). Détection de feux de forêt par analyse statistique d’événements rares à partir d’images infrarouges thermiques. Traitement du Signal, 23(4). 4 Lee, D. (1996). Making databases support map generalization. INTERNATIONAL CONFERENCE-, volume 1, pages 467–480. 7
In GIS LIS-
MacQueen, J. et al. (1967). Some methods for classification and analysis of multivariate observations. In Proceedings of the fifth Berkeley Symposium on Mathematical Statistics and Probability, volume 1, pages 281–297. Oakland, CA, USA. 8 Malinverni, E., Tassetti, A., and Bernardini, A. (2010). Automatic land use/land cover classification system with rules based both on objects attributes and landscape indicators. GEOgraphic Object-Based Image Analysis GEOBIA 2010. 10
15
BIBLIOGRAPHY
Maselli, F. and Chiesi, M. (2006). Evaluation of statistical methods to estimate forest volume in a mediterranean region. IEEE Transactions on Geoscience and Remote Sensing, 44(8):2239. 3 Matheron, G. (1962). Traité de géostatistique appliquée. 1 (1962), volume 1. Editions Technip. 3 Mumford, D. and Shah, J. (1989). Optimal approximations by piecewise smooth functions and associated variational problems. Communications on Pure and Applied Mathematics, 42(5):577–685. 8 Nelson, J. K. and Brewer, C. A. (2015). Evaluating data stability in aggregation structures across spatial scales: revisiting the modifiable areal unit problem. Cartography and Geographic Information Science, pages 1–16. 7 Oliver, C. and Quegan, S. (2004). Understanding synthetic aperture radar images. SciTech Publishing. 4 Openshaw, S. (1984). The modifiable areal unit problem. 7 Pacifici, F., Chini, M., and Emery, W. J. (2009). A neural network approach using multi-scale textural metrics from very high-resolution panchromatic imagery for urban land-use classification. Remote Sensing of Environment, 113(6):1276–1292. 3 Parker, D. C., Manson, S. M., Janssen, M. A., Hoffmann, M. J., and Deadman, P. (2003). Multi-agent systems for the simulation of land-use and land-cover change: a review. Annals of the Association of American Geographers, 93(2):314–337. 4 Peucker, T. K., Fowler, R. J., Little, J. J., and Mark, D. M. (1978). The triangulated irregular network. In Amer. Soc. Photogrammetry Proc. Digital Terrain Models Symposium, volume 516, page 532. 2 Pock, T., Chambolle, A., Cremers, D., and Bischof, H. (2009). A convex relaxation approach for computing minimal partitions. In Computer Vision and Pattern Recognition, 2009. CVPR 2009. IEEE Conference on, pages 810–817. IEEE. 8 Rellier, G., Descombes, X., Falzon, F., and Zerubia, J. (2004). Texture feature analysis using a gauss-markov model in hyperspectral image classification. IEEE Transactions on Geoscience and Remote Sensing, 42(7):1543–1551. 3, 4 Rudin, L. I., Osher, S., and Fatemi, E. (1992). Nonlinear total variation based noise removal algorithms. Physica D: Nonlinear Phenomena, 60(1–4):259 – 268. 9 Santner, J., Pock, T., and Bischof, H. (2011). Interactive multi-label segmentation. Springer. 8 Santos, M. Y. and Moreira, A. (2006). Automatic classification of location contexts with decision trees. In Proceedings of the Conference on Mobile and Ubiquitous Systems, pages 79–88. Universidade do Minho. Escola de Engenharia. 10
16
BIBLIOGRAPHY
Seto, K. C., Güneralp, B., and Hutyra, L. R. (2012). Global forecasts of urban expansion to 2030 and direct impacts on biodiversity and carbon pools. Proceedings of the National Academy of Sciences, 109(40):16083–16088. 3 Shea, K. S. and McMaster, R. B. (1989). Cartographic generalization in a digital environment: When and how to generalize. In Proceedings of AutoCarto, volume 9, pages 56–67. 4 Shepard, D. (1968). A two-dimensional interpolation function for irregularly-spaced data. In Proceedings of the 1968 23rd ACM national conference, pages 517–524. ACM. 3 Shi, J. and Malik, J. (2000). Normalized cuts and image segmentation. Pattern Analysis and Machine Intelligence, IEEE Transactions on, 22(8):888–905. 6, 8 Takahashi, H. and Matsuyama, A. (1980). An approximate solution for the Steiner problem in graphs. Math. Japonica, 24(6):573–577. 6 Theobald, D. M. (2007). GIS concepts and ArcGIS methods. Conservation Planning Technologies. 1 Thomson, R. C. and Richardson, D. E. (1995). A graph theory approach to road network generalisation. In Proceeding of the 17th international cartographic conference, pages 1871–1880. 6 Tobler, W. R. (1970). A computer movie simulating urban growth in the Detroit region. Economic Geography, 46:234–240. 4 Tomlin, C. D. (1990). Geographic information systems and cartographic modeling. Prentice Hall. 1 Tomlin, C. D. (2013). GIS and cartographic modeling. Esri Press. 1 Tomlinson, R. F. (1968). A geographic information system for regional planning. In GA Stewart,(ed.: Symposium on Land Evaluation, Commonwealth Scientific and Industrial Research Organization, MacMillan of Australia., Melbourne. 1 Veenendaal, B., Houweling, T., and Joondalup, J. D. (2000). Gut feelings, crime data and gis. In Conference on Crime Mapping: Adding Value to Crime Prevention and Control, pages 21–22. 5 Voisin, A., Krylov, V. A., Moser, G., Serpico, S. B., and Zerubia, J. (2013). Classification of very high resolution sar images of urban areas using copulas and texture in a hierarchical markov random field model. IEEE Geoscience and Remote Sensing Letters, 10(1):96–100. 3, 4 Wang, F. (2014). Quantitative methods and socio-economic applications in GIS. CRC Press. 2
17
BIBLIOGRAPHY
Watkins, R. E., Eagleson, S., Veenendaal, B., Wright, G., and Plant, A. J. (2009). Disease surveillance using a hidden Markov model. BMC Medical Informatics and Decision Making, 9(1):1. 4 Wegener, M. (1994). Operational urban models state of the art. Journal of the American Planning Association, 60(1):17–29. 4 Wegener, M. (2004). Overview of land-use transport models. Handbook of Transport Geography and Spatial Systems, 5:127–146. 4 Weinmann, M., Jutzi, B., and Mallet, C. (2014). Semantic 3d scene interpretation: a framework combining optimal neighborhood size selection with relevant features. ISPRS Annals of the Photogrammetry, Remote Sensing and Spatial Information Sciences, 2(3):181. 4 Weiping, H. and Chi, W. (1989). Urban road network accessibility evaluation method based on gis spatial analysis techniques. The International Archives of the Photogrammetry, Remote Sensing and Spatial Information Sciences, 38 Part II. 5 Wiafe, S. and Davenhall, B. (2005). Extending disease surveillance with GIS. Arc User, 8(2):1–4. 4 Williams, C. K. (1998). Prediction with Gaussian processes: From linear regression to linear prediction and beyond. In Learning in Graphical Models, pages 599–621. Springer. 3 Zhang, W. and Montgomery, D. R. (1994). Digital elevation model grid size, landscape representation, and hydrologic simulations. Water Resources Research, 30(4):1019– 1028. 2 Zhou, J., Proisy, C., Couteron, P., Descombes, X., Zerubia, J., le Maire, G., and Nouvellon, Y. (2011). Tree crown detection in high resolution optical images during the early growth stages of eucalyptus plantations in brazil. In The First Asian Conference on Pattern Recognition, pages 623–627. IEEE. 4 Zhou, Q.-Y. and Neumann, U. (2012). Modeling residential urban areas from dense aerial lidar point clouds. In Computational Visual Media, pages 91–98. Springer. 3 Zhu, X., Lafferty, J., and Rosenfeld, R. (2005). Semi-supervised learning with graphs. Carnegie Mellon University, language technologies institute, school of computer science. 6
18
Chapter 2
Proximal methods for structured optimization Chapter Abstract This chapter presents an overview of structured optimization and how the proximal operator can be used to leverage the structure of the problem. We develop in particular the problem of minimzing the anisotropic total variation on an arbitrary weighted graph. We first define the context of structured optimization and give several examples. We then provide an overview of some of the most well-known methods for solving such problems using the proximal operator. Finally, we present in greater detail the Generalized Forward-Backward algorithm, introduce a preconditioned version and give numerical experiments. The material of section 2.4 and 2.5 is based on Raguet and Landrieu (2015), published in the 2015 issue of SIAM Journal of Imaging Science (SIIMS), volume 8 issue 4.
2.1
Introduction
Many of the optimization problems encountered in machine learning are ill-posed in the sense that they are underconstrained and have too many solutions, becoming susceptible to overfitting (Hadamard, 1902). A solution is to add regularization functions, providing the problem with mathematical properties which ensure the solution is unique (Tihonov and Arsenin, 1978). Regularization can also be interpreted as encouraging the solution of the problem to satisfy a set of desirable properties. Those properties could represent prior knowledge, such as the solution belonging to a given set, or useful properties such as smoothness. Among the diversity of such regularizers existing in the litterature, many lack differentiability. This is notably the case of set-characteristic functions and sparsity-inducing penalizations (Bach et al., 2012a), which encourage the solution to be mostly comprised
19
2. PROXIMAL METHODS FOR STRUCTURED OPTIMIZATION
of zeros. The non-differentiability of such problems prevents the use of traditional first order schemes such as gradient descent. The most straigh-forward approach to solving such problems is the subgradient descent (Boyd et al., 2003) which, while simple, is quite slow with a distance to optimality that decreases as O( √1t ). However it is often the case that the non-differentiable functions encountered present a special structure. In particular, regularized problems usually have a differentiable fidelity term ensuring that the solution stays close to the obervations, and a non-differentiable regularizer. Furthermore such regularizers often present a simple structure, such as separability. This structure can be leveraged to design algorithms that have similar convergence rates as problems that are differentiable: O( 1t ), or O( t12 ) for accelerated schemes.
2.2
Structured optimization problems
This chapter presents some examples of optimization problems whose structure can be computationally exploited. We focus in particular on regularized problems, i.e. minimization problems whose optimized function can be broken down into two parts: x⋆ = arg min f (x) + λΦ(x),
(2.1)
x∈Rn
with f : Rn 7→ R a fidelity function, typically smooth, and Φ the regularizer. f measures the accuracy of a candidate solution x with respect to the observation, while Φ is the regularizer. The regularization strength λ > 0 balances the influence of the two functions. While an optimal parametrization in λ is hard to find in general, low values denote trust in the observed data while high values indicate an emphasis on the desired properties.
2.2.1
Projection on simple sets
Let us consider f a smooth function to minimize over a convex subset Ω ∈ R. The optimization problem can be written as follows: x⋆ = arg min f (x). x∈Ω
Such a problem can be rewritten under regularized form by choosing ( 0 if x ∈ Ω Φ(x) = ιx∈Ω = ∞ else. As will be detailed further in this chapter, such problems can be solved efficiently as long as Ω is easy to project onto. Examples of such sets include: • box constraints: Ω = {x | ai ≥ xi ≥ bi , ∀i ∈ 1 · · · n}, for a, b ∈ Rn . P • simplex constraints: Ω = {x | xi ≥ 0, ∀i ∈ 1 · · · n, ni=1 xi = 1}. P • ℓ1 cone: Ω = {x | ni=1 xi ≤ ω} for ω ∈ R.
• subspace constraint: Ω is a sub-vector space of Rn .
20
2.2 Structured optimization problems
2.2.2
Regular sparsity
The solution of an optimization is said to be sparse if its values at most indices are zero. Sparsity can be desirable, as such solutions are easier to interpret, are more compact in memory (Tropp et al., 2007), or can correspond to knowledge of the optimizer on the solution set. The sparsity of the solutions can be assured by adding a sparsity inducing penalty to an optimization problem, i.e a function Φ : Rn 7→ R that decreases with the cardinality of the set of non-zeros elements of its argument, called the support:{k | xk 6= 0}. The most natural approach is to penalize by the cardinality of the support: Φ(x) = kxk0 = |{k | xk 6= 0}| . The non-continuous and non-convex nature of this penalty can lead to combinatorial problems that are difficult to solve (Tropp, 2004). A successful alternative approach is to replace the cardinal with a convex approximation (Bach et al., 2012a) such as the ℓ1 norm: n X Φ(x) = kxk1 = |xi | . i=1
This is the celebrated Lasso penalty (Tibshirani, 1996), which has numerous advantages. Its convexity ensures the uniqueness of the solution, and has been shown to be consistent (Zhao and Yu, 2006) in the sense that under some conditions it retrieves the same support as the non-relaxed problem. Furthermore the non-differentiablity of |·| at 0 encourages most coordinates of x⋆ to be zero, thus inducing sparsity. This behaviour can be illustrated by the one-dimension minimization problem obtained for f (x) = 21 (x−y)2 , Ψ(x) = |x| and (x, y) ∈ R2 . The solution of this regularized optimization problem is as follows: y + λ if y < −λ ⋆ x = 0 if |y| ≤ λ y − λ if y > λ,
and is represented in Figure 2.1. We can see that x⋆ is encouraged to take the value zero for y, which is smaller than the regularization strength λ. We can also observe that for |y| ≥ λ, the solution x⋆ is shifted towards zero. This biais is not observed in the ℓ0 case, and can be a drawback of this approach.
2.2.3
Structured Sparsity
Sparse methods are not limited to finding solutions for which the majority of parameters are zero. Indeed Huang et al. (2011) extend the sparsity of the vector of parameters to the notion of coding complexity, a measure of the simplicity adapted for a given problem. Bach et al. (2012b) give an overview of how structured forms of sparsity can be induced by extending the ℓ1 norm to appropriate structured norms.
21
2. PROXIMAL METHODS FOR STRUCTURED OPTIMIZATION
x⋆ y
−λ λ
Figure 2.1: Set of solutions of the one-dimensional LASSO with square error fidelity 1 2 represents the solution x⋆ for the different values of y. 2 (x − y) . Red
. For example, group sparsity is induced by the group Lasso regularization (Bakin, 1999; Yuan and Lin, 2006). Consider [1, · · · , n] partioned into k meaningful groups {g1 , · · · , gk }. The group Lasso regularization takes the following form: Φ(x) =
k X
kxφi k2 ,
i=1
�P �1 2 2 . As in the regular LASSO, the discontinuity of k·k at 0 x with kxg k2 = j∈g j 2 encourages whole blocks x⋆φi to be exactly zero. This could be a desirable property of the solution, and can be exploited to decrease the number of samples needed to find the solution (Obozinski et al., 2011; Wipf and Rao, 2007). Another variation of the LASSO is the fused LASSO, used to encourage the sparsity of the parameters as well as the difference between successive elements in an ordered set (Tibshirani et al., 2005). Suppose that the ordering of [1, · · · , n] is meaningful, then the fused lasso regularization writes: Ψ(x) = α
n X
|xi − xi−1 | + β
i=2
n X
|xi |
i=1
The first part of this regularization encourages most consecutive values of x⋆ to be equals, forming a piecewise constant structure, while the second part encourages values to be exactly zero. Hence the solution x⋆ is not only sparse but its non-zero values show a piecewise constant structure with respect to the chosen ordered set.
2.2.4
Graph-structured Sparsity
An important class of regularizers derive their structure from graphs, as illustrated in (Peyré et al., 2008) for image processing. For example, the spatial structure of an image with n pixels can be captured by an unoriented graph G = (V, E, w) with each element of V = [1, · · · , n] being associated with one pixel, E linking neighboring pixels (4, 8 or 16 neighborhood are usually used). In this context x ∈ Rn is the greyscale value associated with each pixel. The edge weights wi,j can be set based on the norm of
22
2.2 Structured optimization problems
the gradient between two pixels to account for the likelihood of object boundaries to display sharp color changes (Boykov and Jolly, 2001). In the special case of a regular grid graph in theplane,Goldfarb and Yin (2009) propose to set the edge weights such that the total weight of the edges intercepted by a cut of the graph approximates its curve length using the Cauchy-Crofton formula. A natural way for regularizers to take into account a graph structure is to be factorizable with respect to the graph gradient: Φ(x) =
X
φij (xi − xj ),
(2.2)
(ij)∈E
with φij : R 7→ R. Well-chosen edge weights will capture the specificity of each edge so that the functions φij take the form : φij = wij φ with φ : R 7→ R+. In this case spatial regularity can be achieved when φ is a sparsity inducing function. Indeed as φ encourages xi = xj for most neighboring nodes, x will be constant for large connected components of G. The challenge is to design a penalty which will induce spatial regularity while authorizing sharp discontinuities. Piecewise constant approximations have in particular been considered in the image processing literature. In that context Mumford and Shah (1989) introduce an energy whose minimization produces piecewise-smooth approximations of images (see Chapter 4 for a more detailed presentation of this literature). By setting the smoothness term to infinity, one can obtain piecewise constant approximations. With this parameterization, the energy amounts to a squared difference data term penalized by the contour lentgh of the constant regions. For an arbitrary data term, and when the number of regions is fixed in advance, this problem is known as the minimal partition problem. Rather than viewing images as functions on a continuous set, we consider the classical discretization of the problem on a regular grid. In this setting we can transpose this penalty by choosing ( 0 if x = 0 φ(x) = 1x6=0 = 1 else, and G = (V, E, w) the pixel neighborhood graph weighted with the Cauchy-Crofton formula. For these choices Φ(x) can be interpreted as the approximate length of the boundaries between the connected components of G in which x is constant. Remark that the form of the regularizer (2.2) is not specific to grid graphs, and can be extended to arbitrary weighted graphs. The main drawback of this penalty is its non-convexity, which implies a potential multitude of local optima and the impossibility of estimating their quality compared to the global optima . (Rudin et al., 1992) introduce a convex penalization inducing spatial regularity while authorizing sharp discontinuities, the total variation. In our graph setting, this penalty is obtained by setting φ = |·|. This particular implementation is
23
2. PROXIMAL METHODS FOR STRUCTURED OPTIMIZATION
known as the anisotropic weighted total variation: X Φ(x) = wij |xi − xj |
(2.3)
ij∈E
2.3
Proximal splitting for structured optimization
In this section we present a brief overview of proximal splitting algorithms. An index of the methods presented and the context in which they are applicable is presented in Table 2.1. This chapter is inspired by the work of (Bauschke and Combettes, 2011; Combettes, 2004; Combettes and Pesquet, 2009), as well as the survey by Parikh and Boyd (2013)s.
2.3.1
The subgradient
Let Φ : Ω 7→ R be a proper convex function defined over Ω ⊂ Rn . The subgradient is a generalization of the notion of gradient for convex functions that are not necessarily differentiable everywhere. By contrast with the gradient which is a point-to-point operator, the subgradient ∂Φ takes its value in the convex subsets of Rn . The subgradient of Φ at x0 in Rn is defined by the hyperplanes tangent to the set of points above the graph:1 ∂Φ(x0 ) = {c ∈ Ω | Φ(x) − Φ(x0 ) ≥ hc, x − x0 i ∀x ∈ Rn }
(2.4)
In dimension 1, the subgradient of Φ at x0 is the set containing the slopes of all the lines going through (x0 , f (x0 )) and that are under the graph of φ everywhere, as illustrated in Figure 2.2.
y
Φ(x) x0
x Figure 2.2: Illustration of the subgradient of a convex function. In blue ,the graph , the lines bounding the slopes in the subgradient. In pink , the set of φ. In red of points through which pass the lines defined by the slopes in the subgradient of Φ at x0 .
If φ is differentiable, we have ∂Φ(x) = {∇Φ(x)}. Generalizing the notion of gradient, the subgradient can be used to characterize stationarity of non-differentiable functions. 1
this set is called the epigraph of the function
24
2.3 Proximal splitting for structured optimization
x1 x4
x2
x3
x⋆
Figure 2.3: Illustration of the proximal operator. The full black line represents the represents its level sets. boundary of the defition domain of φ, while the dashed line points from point x to the proximal operator value proxΦ (x). Observe The red arrow that the red arrows are perpendicular to the level set of Φ at their destination.
Proposition 1. (x = arg minz∈Rn Φ(z)) ⇔ 0 ∈ ∂Φ(x).
2.3.2
The proximal operator
The proximal operator is a keys concept from convex analysis to design optimization algorithms for non-differentiable functions (Moreau, 1965). Definition 2. For x ∈ Rn and λ > 0 the proximal operator of λΦ at x is defined as: 1 proxλΦ (x) = arg min{ kt − xk2 + λΦ(t)} n 2 t∈R . If Φ = ιC is the characteristic function of a convex set C whose values are 0 in C and ∞ elsewhere, then proxλΦ (x) = arg mint∈C { 12 kt − xk2 }, i.e. the orthogonal projector onto C. The proximal operator can thus be seen as a generalization of the orthogonal projection. If Φ is differentiable, then t = proxλΦ (x) is such that t + λ∇Φ(t) = x. In other words t is obtained from x by a gradient descent step for which the gradient would be computed at its destination t. This property is the reason why the adjective implicit or backward is used to describe algorithms relying on proximal operators. An example of a proximal operator is the soft thresholding which is the proximal operator of Φ = | · |: x + λ if x < −λ proxλ|·| (x) = 0 if |x| ≤ λ x − λ if x > λ
We can see that t = proxλ|·| (x) gives the same result as a gradient step of length λ on the function |·| while dealing with the non-differentiablity. More generally, the proximal operator of a function Φ maps a point x to a point t which reflects a compromise between decreasing Φ and moving away from x, all while remaining in the domain of Φ, as illustrated in Figure 2.3.
25
2. PROXIMAL METHODS FOR STRUCTURED OPTIMIZATION
Proximal point algorithm As suggested by the links between the proximal operator and gradient methods, the former can be used to characterize optimality as well. Proposition 3. For x⋆ ∈ Rn we have the following equivalence: �
⋆
x = arg min Φ(z) z∈Rn
�
⇔ (x⋆ = proxΦ (x⋆ ))
Proof. Proof in Appendix B. This fixed-point characterization of optimality suggests the following algorithmic scheme: xt+1 ← proxλΦ (xt ).
(2.5)
It is well known that such fixed-point algorithms converge to their fixed-point for operators T : Rn → Rn that are contracting, ie: kT (x − y)k ≤ λ kx − yk ,
(2.6)
for 0 ≤ λ < 1. The proximal operator is almost a contracting operator, in the sense that it (2.6) for λ = 1. However convergence is not ensured for such operators. A stronger condition requirement for an operator T is firm nonexpansivity: kT (x) − T (y)k2 ≤ hx − y, T (x) − T (y)i . for all x, y in the domain of T . Firm nonexpansivity ensures that the sequence of the iterates converges weakly to a fixed point of T , as stated by the Krasnoselskii-Mann theorem (Krasnosel’skii, 1955; Mann, 1953; Reich and Zaslavski, 2000). Consequently, a damping scheme can be used to ensure convergence, as suggested by Combettes (2004) and Bertsekas (2015, Chapter 5). This algorithm is not used in practice because of its nested structure: each iteration requires solving a minimization problem almost as difficult as minimizing Φ itself. If Φ is not strictly convex however, the proximal problem is easier as it corresponds to the minimization of a strongly convex fonction, but this does not justify actually using the proximal point algorithm in practice. For some functions however, the proximal operator is easy to compute. We call such functions proximable. Well-known examples include characteristic functions of simple sets such as the ones listed in (2.2.1), k·k2 , the LASSO and some of its structured variants such as the group-LASSO. Remark that while minimizing these functions is trivial, their proximable property proves useful however within the context of regularization.
26
2.3 Proximal splitting for structured optimization
2.3.3
Proximal splitting
Structured optimization refers to the optimization algorithms that leverage the structure of the function to minimize. In this section, we are interested in proximal splitting and consider F : Ω 7→ R a convex function that can be written as: F (x) = f (x) + Φ(x), with both f and Φ convex.
Forward-Backward Splitting This scheme handles cases where Φ is proximable and f is differentiable with L-Lipschitz gradient for L > 0: k∇f (x) − ∇f (y)k ≤ L kx − yk ∀x, y ∈ Rn . Forward-backward splitting (Chen and Rockafellar, 1997; Combettes and Wajs, 2005; Passty, 1979) is a fixed-point algorithm with the following update: � (2.7) xt+1 ← proxλΦ xt − λ∇f (xt ) . This update can be understood as alternating a gradient step on f : xt+1 ← xt − λ∇f (xt ) (the forward step) with a proximal step: xt+1 ← proxλΦ (xt ) (the backward step). It takes advantage of the split of F into a differentiable part, for which we can compute the gradient, and a non-differentiable part whose proximal operator can be easily computed. Well-known examples include: - Φ = 0 : reduces to gradient descent - f = 0 : reduces to the proximal point algorithm - Φ = ιC with C a convex set : reduces to projected gradient descent (Bertsekas, 1999, chapter 2) - Φ = |·| : reduces to iterative soft thresholding (Daubechies et al., 2004) This algorithm is a fixed-point algorithm as well, whose optimality at convergence is a classical results that we recall in Proposition 4. This method will converge for λ < 2/L, and inertial acceleration schemes can be used to accelerate the gradient descent part of the algorithm (Beck and Teboulle, 2009; Nesterov, 1983, 2013).
Proposition 4. x⋆ is a fixed point of (2.7) if and only if it is a minimizer of f + Φ. Proof. Proof in Appendix B.
Douglas-Rachford Splitting The Douglas-Rachford splitting algorithm (Combettes, 2004; Douglas and Rachford, 1956) applies when f and Φ are both proximable, with no hypothesis on their differentiablity, and corresponds to the following scheme: t+1 = proxλf (y t − wt ) x (2.8) y t+1 = proxλΦ (y t+1 + wt ) t+1 t t+1 t+1 w =w +x −y This scheme is equivalent to the celebrated ADMM: alternating direction of Multipliers method (Boyd et al., 2011), as shown in Appendix B.
27
2. PROXIMAL METHODS FOR STRUCTURED OPTIMIZATION
f2 f1 differentiable proximable f (Kx) with f proximable Pn i=1 fi (x) with fi proximable
differentiable
proximable
gradient descent forward-backward forward-backward Douglas-Rachford Chambolle-Pock generalized forward-backward
Table 2.1: Summary of the algorithms presented in section 1.2 with their case of applicability
Primal-Dual Splitting Chambolle and Pock (2011)’s primal dual splitting deals with the case of f proximable and Φ of the form Φ(x) = φ(Kx) with K being a continuous linear operator and φ proximable as well. Their scheme is written as follows: t+1 = prox y t + σK x ˜t σφ y xt+1 = proxτ f y t − τ K ∗ y t+1 � t+1 x ˜ = xt+1 + θ xt+1 − xt ,
with θ, σ > 0 and θ ∈ [0, 1]. This scheme is particularly useful as it avoids the inversion of the linear operator K. This splitting is obtained from the Douglas-Rachford splitting by the addition of the term to the first line of the update, which simplifies the terms involving the inverse of K. The addition of this step is often refered to as a preconditioning step (Esser et al., 2010). The primal dual splitting can also be seen as a relaxed version of the Arrow-Hurwicz algorithm, whose modified version by Popov (1980) is obtained for θ = 0.
2.4 2.4.1
Generalized forward-backward A Generalized forward-backward splitting
Motivation Raguet et al. (2013) presents a proximal splitting scheme for optimization problems of the form
x⋆ = arg min f (x) + x∈Rn
k X
φi (x),
(2.9)
i=1
where f is differentiable with L-Lipschitz gradient and all φi are proximable. Douglas-Rachford splitting has been extended for such arbitrary number of proximable functions (Combettes and Pesquet, 2008; Eckstein and Svaiter, 2009). The idea behind this splitting is to introduce auxiliary variables for each function, allowing us to compute the proximal operator of each function individually and in parallel (Spingarn, 1983, section 5). The objective variable is then obtained by averaging the auxiliary variables. However this scheme does not extend to the forward-backward scheme but
28
2.4 Generalized forward-backward
rather to the splitting Douglas-Rachford, and it is hence limited to regularization of problems in which the fidelity term is proximable itself.P Chaux et al. (2009) present an algorithm in which the proximal operator of the sum i φi is computed numerically, nested in a forward-backward splitting scheme. However the nested structure of this algorithm increases both computation time and the number of parameters. Generalized forward-backward splitting (GFB) is a scheme in which the fidelity funcion f is only handled through its gradients, and the functions φi through their proximal operators. In this sense it is a hybrid algorithm, in which a forward step is performed on f and a backward step is performed separately on each φi , individually and in parallel.
Algorithmic scheme The algorithmic scheme is the following: γ ∈]0, 2L[ and w ∈ P [0, 1]k such that
k i=1 wi
= 1:
Algorithm 1: Generalized forward-backward splitting n k z ∈ (R P) ; x ← i w i zi ; repeat for i = 1 · · · n do i zi ← zi + prox γφ wi (2x − zi − γ∇f (x)) − x; P x ← i w i zi ; until convergence; return x.
Interpretation The main advantage of this scheme is that it allows for more complicated fidelity functions that need not be proximable, while allowing for a complex P non-differentiable penalization in the form of i φi . Each φi is handled by an auxiliary variable zi , so that the proximal operators can be computed in parallel. The variable x is then obtained as a weighted average of the auxiliary variables with weights wi . Typical values for those weights are wi = n1 . The auxiliary variable z belongs to the product space {Rn }k , endowed with the scalar product: hz, z ′ i =
k X
wi hzi , zi′ i.
i=1
The scheme presented in P Algorithm 1 ensures that z ⋆ , the fixed point of the iterate k operator is such that x⋆ = i=1 wi zi is a solution of (2.9). We refer the reader to Raguet et al. (2013, section 4) for a detailed proof of the convergence. The choices of the step size γ ensures that the operator in the fixed-point equation, denoted here T , is a firmly nonexpansive operator in the Hilbert space defined by the product space {Rn }k endowed with the aforementioned scalar product.
29
2. PROXIMAL METHODS FOR STRUCTURED OPTIMIZATION
Applications The hybrid nature of GFB proves particularly useful in image processing, in which smooth but complicated fidelity terms can arise, as observed when using complex linear representations or when dealing with complex linear observation processes. The gradient is generally easier to produce, as a closed form can be obtained for most reasonnable choices of f . P The sum of proximable functions i φi can encode any penalization that can be factored over the graph gradient, such as the anisotropic total variation. In the case of an image defined on a grid of size I × J of pixel for which the 4-neighborhood is taken, the total variation semi-norm can be rewritten as a sum of 4 functions: T V (x) =
I X J X
|xi,j − xi−1,j | +
i=2 j=1
=
I ⌊X J 2⌋ X
I X J X
|x2i−1,j − x2i,j | +
i=1 j=1
+
J I ⌊ 2⌋ X X
|xi,j − xi,j−1 |
i=1 j=2
I ⌊X J 2⌋ X
|x2i,j − x2i+1,j |
i=1 j=1
|xi,2j−1 − xi,2j | +
i=1 j=1
J I ⌊ 2⌋ X X
|xi,2j − xi,2j+1 | .
i=1 j=1
It is clear that each of those 4 functions is proximable as a sum of proximable functions of disjoint set of variables. However a drawback of this method is that the duplication of the variables induces high memory requirements. This consideration has led to the development of the algorithm presented in the next section.
2.4.2
Preconditioning of a generalized forward-backward splitting
In this section we present the algorithm introduced in Raguet and Landrieu (2015), which proposes an extension of the generalized forward-backward splitting with better memory requirement and allowing preconditioning strategies for consequential speedups.
Metric adaptation for gradient descent Consider the simple gradient descent aiming at minimizing f , a convex, bounded below and differentiable function with gradient L-Lipschitz: xt+1 ← xt − γ∇f (xt ). This scheme converges to the solution for γ < L2 (Nesterov, 2004). However if the variations of the gradient of f are much sharper along one direction than along others, the information carried by its Lipschitz constant L might not be representative of its overall behavior. More formally, this scheme is based on the construction of an upper bound of the function whose Hessian is scalar. If the Hessian of the function ∇2 f is badly-conditioned, this upper bound is very loose and might impose a step size that is too small in most directions, leading to slow converence rates. A more precise approach would be to allow the step size to be different in each direction, or more generally to replace the step size γ by a matrix Γ addressing the badconditionning of the function to minimize. This can be interpreted as a metric change,
30
2.4 Generalized forward-backward
as in the euclidian space Rn equipped with the scalar product hx, yiΓ 7→ hΓ−1 x, yi, we have that Γ∇f is the gradient of f . Since h∇f (x), ·i = hΓ∇f (x), ·iΓ , this can be seen as a consequence of Riesz’s representation theorem (Riesz, 1907). Such matrix Γ is also referred to as the preconditonning matrix. Metric change algorithms have been long studied have long been studied, the most famous being Newton or quasi-Newton methods (Broyden, 1967) for twice differentiable functions. But generalization of such methods to problems that count proximable nondifferentiable terms are delicate. In this chapter, we study metric adaptation to minimize sum of non-differentiable functions, and in particular for the generalized forwardbackward algorithm. Our goal is to define a metric which would take on a role similar to that of the Hessians for twice differentiable functions, while keeping tractable the computation of the proximal operators of the non differentiable parts. We limit ourselves to preconditonning matrices Γ that are diagonal, following the rationale of Giselsson and Boyd (2014a). Since neither f nor φi are supposed twice differentiable, Γ will be determined with diagonal pseudo Hessians, as explained in Section 2.4.2.
Preconditioning of proximal splittings Qian (1992) was the first to introduce variable metrics in the context of proximal operators, and more specifically for the proximal point algorithm. Chen and Rockafellar (1997) give a variable metric version of the forward-backward splitting in finite dimension. Both papers focused on the theoretical convergence without providing insight on how to chose metrics. Those results were used ten years later by Parente et al. (2008) to speed up the resolution of differential equations systems. Pock and Chambolle (2011) extend their celebrated primal-dual splitting (Chambolle and Pock, 2011) to allow a metric change that remains fixed after the first iteration, an operation known as preconditioning. They then explain how to easily compute a diagonal preconditioner that leads to significant gains in convergence speed for badly-conditioned problems. Giselsson and Boyd (2014a,b) explore the rationale behind the choice of preconditoners for proximal splittings. They suggest favoring diagonal splittings in order to keep the proximable properties of the functions, and show how a well-chosen metric can greatly decrease the condition number of a problem and subsequently increase both theoretical and empirical convergence speeds. Metric change is not limited to preconditioning however, and Becker and Fadili (2012) uses such variable metrics to apply quasi-Newton updates to the twice-differential part of a forward-backward splitting. Combettes and V˜ u (2014) provide a convergence proof of a forward-backward splitting in which the metric is free to change at each iteration. Finally Lorenz and Pock (2014) introduce the inertial forward-backward algorithm in which the step size changes at each iteration. In the footsteps of those algorithms, the preconditioned generalized forward-backward splitting represents an improved scheme from Raguet et al. (2013). It uses variable metrics not only to accelerate the convergence without using second order information but also to decrease the memory requirement as well. Finally, a reconditioning strategy is
31
2. PROXIMAL METHODS FOR STRUCTURED OPTIMIZATION
presented.
Tight Primal Splitting Recall from section 2.4 that the generalized forwardbackward algorithm introduces the auxiliary variables zi in order to compute the proximal operator of each functions φi separately. In Raguet et al. (2013) each zi is a full copy of the original variable x. In the case of the total variation on a regular graph such as a 4 neighborhood grid this memory requirement is not an issue. It can however be problematic in the case of a highly irregular graph. Indeed for a graph of degree k, the naive splitting would need a set of k full sized auxiliary variables, most of which will be unused: the computation of xv for a nodes v of degree k ′ smaller than k only involve k ′ auxiliary variables. We introduce the notion of tight splitting, in which all auxiliary variables are used in their entirety. More formally, a splitting is tight when the auxiliary variables are defined in a Cartesian produce of subspace Hi ⊂ Rn for which there exists no strict subspace H ( Hi such that φi = φi ◦ PH with PH the projector onto H. We define Ii ⊂ [1, · · · , n] as the subset of the variables x1 , · · · , xn involved in φi . We define Hi as the subspace generated by the variables relevant to φi : Hi = span({ei }i∈φi ) = {x ∈ Rn | xj = 0 for j 6∈ Ii }, with ei ∈ {0, 1}n the binary vector whose sole non-zero value is at the ith row. The restricted product space Xki=1 Hi is naturally a tight splitting. Whereas in 2.4 the the auxiliary variable z was in the product space Xki=1 Rn , it suffices here to take z in Xki=1 Hi , whose values are all used. We denote zi the vector of auxilliary variables associated with phii and whose entries zij are zeros for all j ∈ / Ii . P In the case of the anisotropic total variation, we split Φ(x) = ij∈E wij |xi − xj | into m = |E| functions. The need for a tight primal splitting is clear as a naive splitting would induce a memory requirement O(n × k) with k the degree of the graph, which is impractical for most real life problems. Fortunately, each function gij = �wij |xi − xj | only depends on two variables, xi and xj , and we set Hij = span 1{i} , 1{j} . With this tight splitting the memory requirement for the auxiliary variables are limited to O(2m) with m the number of edges in the graph.
Weights matrices We introduce the weight matrices Wi ∈ Rn×n for each function φi , which play a role similar to the scalar weights wi of section 2.4, but in matrix form. For simplicity we will limit ourselves to diagonal weight matrices as well Wi = diag(wi1 , · · · , win ). In the same manner that the wi of section 2.4 sum to unity, the Wi P must satisfy ki=1 Wi = Id. We also impose that [wij ] be zero for j outside of Ii , and strictly greater than zero for j in Ii . For an auxiliary variable zi ∈ Hi and j ∈ [1, · · · , n] we denote: ( wij zij for j ∈ Ii [Wi zi ]j = 0 else,
32
2.4 Generalized forward-backward
P Consequently, we can interpret i Wi zi as the average of all auxiliary variables weighted −1 iΓ the proxiby the matrices Wi . We denote xHi the projection of x onto Hi and proxW φ . mal operator of φ in the Hilbert space Hi with inner product hx, yiWi Γ−1 = hWi Γ−1 x, yi: −1
proxφWii Γ (x) = arg min{hx − t, x − tiWi Γ−1 + φ(t)}. t∈Rn
Algorithmic scheme We consider the problem of minimizing f +
Pk
with f convex continuously differentiable. We suppose that there is a self-adjoint, positive 1 1 definite matrix L for which L− 2 ◦ ∇f ◦ L− 2 is non-expansive. The functions φi are assumed to be convex, continuous and the sets of relevant variables Ii verify ∪ki=1 Ii = [1, · · · , n]. Γ a diagonal, positive definite preconditionning matrix which verifies
1We 1denote
2
L ΓL 2 < 2. We denote Wi the diagonal, positive definite weight matrices, which P satisfy ki=1 Wi = Id and [wij ] zero for j outside of Ii , and strictly greater than zero for j in Ii . Under those hypothesis, the following scheme define a sequence {xt } which converges strongly towards the mimizer of (2.9). i=1 φi
Algorithm 2: Preconditioned generalized forward-backward splitting k H z ∈ XP i=1 i x ← i W i zi repeat p ← 2x − Γ∇f (x) for i = 1 · · · n do � −1 zi ← zi + proxφWii Γ p H i − zi − x H i P xt+1 ← i Wi zi until convergence; return x.
Diagonal preconditioning the generalized forward-backward splitting Choice of the preconditioner: The literature on metric adaptation for gradient descent is based on Newton’s method and implies either exact or approximated computation of the inverse of the Hessian. Similarily, metric adaptation for proximal splittings relies on a smoothness hypothesis. In particular Becker and Fadili (2012) use second order information to precondition a forward-backward scheme, while Giselsson and Boyd (2014b) assume that f is both smooth an strongly convex. In our setting however, f is only assumed to be convex and once continuously differentiable and no smoothness hypothesis is made on the functions φi , so that the Hessians of the functions composing the objective do not exist in general. We can however compute pseudo Hessian for f and φi . To reduce the cost of the computation of the inverse, we
33
2. PROXIMAL METHODS FOR STRUCTURED OPTIMIZATION
limit ourselves to diagonal pseudo-Hessians. We propose to derive diagonal pseudo Hessian from quadratic approximations of f and φi at a current value xt , i.e. functions of the form x 7→ h 21 Ax + b, xi + c with b, c ∈ Rn and A the diagonal pseudo-Hessian, a positive definite diagonal matrix such that the approximation matches the value and differential of the function at xt . We denote A = diag(a1 , · · · , an ) the pseudo-Hessian of f and Ai = diag(a1i , · · · , ani ) the pseudo-Hessian of φi . Those approximations are used a heuristic to accelerate the convergence of the algorithm. The convergence of the algorithm itself only require that A be diagonal with stricly positive diagonal terms, which may be enforced by the addition of regularizers. In particular, although the quadratic functions detailed in section 2.5 are also majorizers of the function they approximate, it is not a requirement of the algorithm. In section 2.5 we provide examples of such approximations, demonstrating that common regularizers can be easily approximated by quadratic functions despite their lack of differentiability. The quadratic approximation of the data term however must be chosen on a case-by-case basis. From Algorithm 1, we would like to incorporate those pseudo-Hessians such that their inverses determine the size of the step. In other words, we would like to have Γ−1 ≈ A and Wi Γ−1 ≈ Ai . However this is not completely straightforward as we must verify the algorithm’s hypotheses on both Γ and Wi . −1 Choosing Γ: want
to chose Γ = diag(γ1 , · · · , γn ) so that Γ ∼ A 1but it must1
We 1
21 also verify that L ΓL 2 < 2 for L self-adjoint, positive matrix for wich L− 2 ◦∇f ◦L− 2 is non expansive. Γ−1 ∼ A would encourage us to chose γi ∼ a1i . However, since the choice of the preconditioner Γ determines the metric shaping all auxiliary variables, we opt to recondition with respect to the whole functional: γi ∼
ai +
1 P
j∈Ii
aji
.
Numerical experiments demonstrated the superiority of this approach compared to different choices of Γ, and the reconditoning in section 2.5 are chosen as such.
1
1
2 To ensure the condition L ΓL 2 < 2, we make the simplifying hypothesis that we know a matrix L satisfying this inequality and that it is diagonal as well, which can be always be achieved since f is continuously differentiable. In this case, for L = diag(l1 , · · · , ln ), both conditions combined yield: ! 2δ 1 P γi = min , . li ai + j∈Ii aij
with 0 < δ < 1, typically equal to 0.99 � Choosing W : We want to chose Wi = diag wi1 , · · · , win such that Wi ≈ ΓAi , Pk j i=1 Wi = Id and wi = 0 for all j 6∈ Ii , the set of variables relevant to φi . This leads us to set:
34
2.5 Experimental setup and results
w ˜ij =
(
γi aji 0
if j ∈ Ii else,
and wji = P
w ˜ij k∈Ii
w ˜ik
.
See Raguet and Landrieu (2015, section 3) for a more detailed analysis.
Reconditioning and variable metric As explained in the previous sections, we propose to compute quadratic approximations of our functions in order to emulate the second order preconditioning generally applied to smooth functions. However it is natural that this preconditioning is only as good as the quadratic approximations, which is why we suggest updating the quadratic approximations periodically and changing the metric accordingly. We call this heuristic reconditioning. Unfortunately the auxiliary variables zi are defined with respect to one given metric, and are no longer adapted after reconditioning, setting back convergence. The auxiliary variables therefore need to be updated to the new metric. For that purpose, we make the hypothesis that when the reconditioning step takes place, the auxiliary variables are close to convergence. This allows us to update the current auxiliary points so that they are adapted to the new metric. If we denote (Γ, W ) the old preconditoners and ˆ W ˆ ) the new ones, the updated zˆi are: (Γ, � �H ˆ −1 Γy ˆ i, ˆ (x) i − W zˆi = x − Γ∇f i
with
yi = Γ−1 Wi (x − Γ∇f (x) − zi )
Because this update relies on the hypothesis that the convergence is almost reached with respect to the current metric, this reconditioning strategy should not be applied at each iteration. On the contrary, we advocate only reconditioning when the relative change of the iterate at iteration t, i.e. kxt − xt−1 k / kxt−1 k is below a certain threshold θ. As the algorithm progresses, each time this threshold is reached, it We chose to divide the threshold by a constant factor. Furthermore, for the convergence proof presented in Raguet and Landrieu (2015) to hold, the reconditioning steps must only be applied a finite number of times. A potential lead to overcoming this restriction may be found in Liang et al. (2014), who proved that if the metric changes only induce summable errors with respect to the first metric, then the convergence holds for many proximal splitting algorithms including the generalized forward-backward splitting.
2.5
Experimental setup and results
We now present a numerical application of our algorithm on a high-dimensional problem structured on an irregular graph. Solving it implies performing a sequence of badly conditioned, non-differentiable optimization problems, providing a good illustration of
35
2. PROXIMAL METHODS FOR STRUCTURED OPTIMIZATION
Experiment Number of vertices Number of edges ℓ1 penalty
A 252,183 378,258 no
B 252,183 378,258 yes
C 4,670,492 7,002,424 no
Table 2.2: Dataset summary for each experimental setting
several notions developed in the previous sections. We show how the convergence speed of the preconditioned GFB algorithm compares with concurrent preconditioned proximal algorithms over three different experimental setups. The applied motivation and setup of the experiments presented here are detailed in the next chapter.
2.5.1
Problem formulation
. . We consider a graph G = (V, E) with n = |V | and m = |E|. Each node is assigned a scalar observation value yi ∈ R. We consider the minimization of a function F defined as the sum of a weighted least square fidelity term, a weighted total variation term and of an ℓ1 penalty: F (x) =
X X 1X νv |xv − yv |2 + s1 λv |xv |, µuv |xu − xv | + s2 2 v∈V
(u,v)∈E
(2.10)
v∈V0
n 1 2 with νv ∈ Rn+ , µuv ∈ Rm + , λv ∈ R+ and V0 ⊂ V . The penalization strength s and s are non negative as well. We consider 3 experiments with dimensions given in Table 2.2. The motivations for choosing this specific function are discussed in the next chapter.
2.5.2
Applying a preconditioned generalized forward-backward
There are several ways to cast this problem as an instance of (2.9); we describe one of them.
Tight splitting We set f as the smooth part: f (x) =
1X νv (xv − yv )2 . 2 v∈V
The rest of the energy constitutes the regularization, whose terms we split individually into |E| + |V0 | separate functions: ( ( φuv = µuv |xu − xv | φw = λw |xw | and ∀w ∈ V0 ∀(u, v) ∈ E Huv = span(1u , 1v ) Hw = span(1w ) It is easy to see that those functions are proximable. Thanks to the tight splitting property, the generalized forward splitting algorithm can be applied without demultiplying the memory requirement. Indeed the restricted product space (Xu,v∈E Huv ) × (Xw∈V0 Hw ) is only of dimension 2 |E| + |V0 |.
36
2.5 Experimental setup and results
Preconditioning As stated in 2.4.2, our reconditioning scheme relies on computing a diagonal pseudo-Hessian obtained from quadratic approximation of the involved functions. In our case, f being already quadratic, with a diagonal Hessian, it does not need to be approximated. More complicated data terms involving a non diagonal design would need more work to find a suitable approximation. We approximate the functions φw at point x ˆ by the tightest quadratic upper bound at the current point x ˆ: λw 2 |ˆ x w | λw qw (x) = xw + , 2 |ˆ xw | 2 as illustrated � in Figure 2.4. The Hessian of this approximation is the diagonal matrix � λw ˆw = 0 the corresponding term is unbounded, which causes diag |ˆxw | . However if x numerical issues.� Hence we chose for diagonal pseudo-Hessian the following matrix : � λw diag max(|ˆxw |,ǫ1 ) for ǫ1 a small value. In our implementation we chose ǫ1 = 10−6 x ¯ with x ¯ being the average of all x ˆ. Similarily, the best quadratic approximation of guv at point x ˆ is the function quv defined by: quv (x) =
µuv µuv |ˆ xu − x ˆv | (xu − xv )2 + . 2 |ˆ xu − x ˆv | 2
The Hessian of this quadratic function is however not diagonal, and we drop the off-diagonal terms. To avoid issues faced with qw we take the pseudo� the same numeric � µuv Hessian of guv to be diag max (|ˆxu −ˆxv |,ǫ2 ) with ǫ2 > 0 a small real number. In our
implementation we observed best results for ǫ2 = 10−1 x ¯.
qv
v
xv x ˆv Figure 2.4: Quadratic upper bound of φv .
.
Competing algorithms In the following, we compare the performance of our preconditioned generalized forward-backward splitting algorithm for the minimization of
37
2. PROXIMAL METHODS FOR STRUCTURED OPTIMIZATION
F , against other preconditioned proximal splitting algorithms available in the literature. Preconditioned primal-dual algorithm (PPD): We implemented the well-known primal-dual algorithm of Chambolle and Pock (2011). The function is split as F = f + φ ◦ K, where f is the same data-fidelity term, and φ and K are defined as follows: ( ( Rn → R|E| × R|V0 | ∀(u, v) ∈ E, δuv = µuv (xu − xv ) K: with ∀w ∈ V0 , ξw = λw xw , x 7→ (δ, ξ), and φ:
(
R|E| × R|V0 | (δ, ξ)
→R P P 7→ (u,v)∈E |δuv | + v∈V0 |ξ| .
It is easy to see that the functions f and g are proximable and that K is indeed a linear operator as requested by the primal dual algorithm. We apply the diagonal preconditioning suggested by the authors following Lemma 2, equation (10), and take the parameter α = 1 as well as θ = 1, as suggested by the authors. Note that this preconditioning procedure only depends on the operator K and does not take f into account. Inertial preconditioned primal-dual algorithm of (IPPD): The iteration (30) of Lorenz and Pock (2014) can be seen as an inertial extension of the above spliting, where in addition the functional f can be taken into account through an explicit gradient step. The preconditioning matrices can in turn incorporate information about f following Lemma 10, equation (35) in their paper. After trying different parameters, we selected γ = 1, δ = 0, r = 1, s = 1 and α taken as one half of the upper bound given by Lemma 6, equation (25). Preconditioned generalized forward-backward splitting (PGFBθ ):. We use the splitting and preconditioning described in Section 2.4. Note that, at the very beginning of the optimization process, we initialize the preconditioners with a coarse preconditioning, following Section 2.4.2 but in which x is substituted with the observation y. We denote P GF Bθ the implementation of the algorithm for a reconditioning threshold θ, and P GF B0 the implementation where only the initial preconditioning is applied.
Results For each dataset in Table 2.2, we fix reasonable values for the parameters s1 and when applicable s2 , and illustrate the solution in the next chapter. For each algorithm, we monitor the computation time and the decrease of the objective functional F over one thousand iterations. Finally, we compute an approximate minimum F˜∞ by running five thousand iterations of P GF B. In Figure 2, we plot the distance |F˜t −F˜∞ | between the relative primal suboptimality gap F˜ on a logarithmic scale against | ∞| the corresponding computational time. All performance results show the same trend, in spite of the variety of the problems, of the conditionings, and of the data size considered. In all three experiments, we see that P P D and IP P D iterations are faster than P GF B iterations as it take them less time to compute one thousand iterations. Yet, the coarse initial preconditioning is
38
2.6 Conclusion
already enough for P GF B0 to outperform PPD and IPPD. The three different reconditioning threshold values illustrate that reconditioning must happen neither too early nor too late for optimal performance. Indeed the version of PGFB without reconditioning (but only preconditioning) performs consistently worse than its preconditioned counterparts. On the contrary, undesirable spikes can be observed on the top right of Figure 2.5 when the reconditionings are too close. However in all cases, it is clear that the computational cost of the reconditionings is negligible, and that it allows for a significant increase in speed compared to P GF B0 . For our algorithm and the competing ones, we tried different preconditioning schemes which yielded inferior results and are not represented in this chapter. In particular we tried a Douglas Rachford version of our algorithm by setting f = 0, and different less successful preconditioning schemes. Similarily for the primal dual algorithms, we tried to include the data term in the preconditioning matrix, which induced slower convergence. Finally we tried an inertial version of the PGFB algorithm following the idea of Lorenz and Pock (2014), but the gain in convergence speed was offset by the longer iterations and a doubling of the memory requirements.
2.6
Conclusion
In this chapter we presented some proximal splitting algorithms, as well as their applications in the context of structured optimization. We expanded in particular the generalized forward-backward algorithm and showed how the concept of gradient step size can be expanded to a matrix through reconditoning, which can be interpreted as an adequate change of metric. We presented a scheme which allows for such adaptations without the hypothesis of twice differentiability and allows for a substantial decrease in convergence time. The drawback of the generalized forward backward scheme is the duplication of auxiliary variables, even though tight splittings strongly mitigates the issue. Finally, we demonstrated the acceleration permitted by the preconditioned generalized forward-backward algorithm on a spatial aggregation task detailed in the next chapter. Future work to be done includes the generalization of this method to cases in which the node values are constrained within a multidimensional convex set. An interesting direction to explore would be to consider the potential links with stochastic optimization techniques such as the random block coordinate primal dual algorithm (Combettes and Pesquet, 2015; Repetti et al., 2015). Indeed the choice of a stochastic activation function for block coordinate algorithms shares a common objective with preconditioning schemes: focusing the optimization efforts on the most difficult parts of the function to minimize, be it by adapting step sizes or activation probabilities.
39
2. PROXIMAL METHODS FOR STRUCTURED OPTIMIZATION
10−1
10−1
GF B10−3 GF B10−4
10−2
GF B10−3 GF B10−4 GF B10−5
10−2
GF B10−5
10−3
10−3
10−4 10−4
10−5 10−5
0
10
20
101
30
40
GF B10−2 GF B10−3 GF B10−4
100
0
10
20
30
PPD IP P D
GF B0
10−1
∞ Vertical axis : FtF−F ∞ Horizontal axis : time in second
10−2 0
100
200
300
400
500
600
∞ Figure 2.5: Relative primal suboptimality grap FtF−F for the different data sets: top ∞ left : population, top right : revenue, bottom left : vote. The different algorithms are preconditioned primal dual splitting : P P D , Inertial preconditioned primal dual splitting IP P D Preconditoned Generalized Forward-Backward Splitting GF B0: and generalized forward backward with reconditioning for different values of the threshold (see image legends) and for one thousand iterations.
40
40
Bibliography Bach, F., Jenatton, R., Mairal, J., and Obozinski, G. (2012a). Optimization with sparsity-inducing penalties. Foundations and Trends in Machine Learning, 4(1):1– 106. 19, 21 Bach, F., Jenatton, R., Mairal, J., Obozinski, G., et al. (2012b). Structured sparsity through convex optimization. Statistical Science, 27(4):450–468. 21 Bakin, S. e. a. (1999). Adaptive regression and model selection in data mining problems. PhD thesis, The Australian National University. 22 Bauschke, H. H. and Combettes, P. L. (2011). Convex analysis and monotone operator theory in Hilbert spaces. Springer Science & Business Media. 24 Beck, A. and Teboulle, M. (2009). A fast iterative shrinkage-thresholding algorithm for linear inverse problems. SIAM Journal on Imaging Sciences, 2(1):183–202. 27 Becker, S. and Fadili, J. (2012). A quasi-newton proximal splitting method. In Advances in Neural Information Processing Systems, pages 2618–2626. 31, 33 Bertsekas, D. P. (1999). Nonlinear programming. Athena scientific. 27 Bertsekas, D. P. (2015). Convex optimization algorithms. Athena Scientific Belmont. 26 Boyd, S., Parikh, N., Chu, E., Peleato, B., and Eckstein, J. (2011). Distributed optimization and statistical learning via the alternating direction method of multipliers. Foundations and Trends in Machine Learning, 3(1):1–122. 27 Boyd, S., Xiao, L., and Mutapcic, A. (2003). Subgradient methods. lecture notes of EE392o, Stanford University, Autumn Quarter, 2004:2004–2005. 20 Boykov, Y. Y. and Jolly, M.-P. (2001). Interactive graph cuts for optimal boundary & region segmentation of objects in nd images. In Computer Vision, 2001. ICCV 2001. Proceedings. Eighth IEEE International Conference on, volume 1, pages 105–112. IEEE. 23 Broyden, C. G. (1967). Quasi-newton methods and their application to function minimisation. Mathematics of Computation, pages 368–381. 31
41
BIBLIOGRAPHY
Chambolle, A. and Pock, T. (2011). A first-order primal-dual algorithm for convex problems with applications to imaging. Journal of Mathematical Imaging and Vision, 40(1):120–145. 28, 31, 38 Chaux, C., Pesquet, J.-C., and Pustelnik, N. (2009). Nested iterative algorithms for convex constrained image recovery problems. SIAM Journal on Imaging Sciences, 2(2):730–762. 29 Chen, G. H. and Rockafellar, R. (1997). Convergence rates in forward–backward splitting. SIAM Journal on Optimization, 7(2):421–444. 27, 31 Combettes, P. L. (2004). Solving monotone inclusions via compositions of nonexpansive averaged operators. Optimization, 53(5-6):475–504. 24, 26, 27 Combettes, P. L. and Pesquet, J.-C. (2008). A proximal decomposition method for solving convex variational inverse problems. Inverse problems, 24(6):065014. 28 Combettes, P. L. and Pesquet, J.-C. (2009). Proximal splitting methods in signal processing. arXiv preprint arXiv:0912.3522. 24 Combettes, P. L. and Pesquet, J.-C. (2015). Stochastic quasi-fejér block-coordinate fixed point iterations with random sweeping. SIAM Journal on Optimization, 25(2):1221– 1248. 39 Combettes, P. L. and V˜ u, B. C. (2014). Variable metric forward–backward splitting with applications to monotone inclusions in duality. Optimization, 63(9):1289–1318. 31 Combettes, P. L. and Wajs, V. R. (2005). Signal recovery by proximal forward-backward splitting. Multiscale Modeling & Simulation, 4(4):1168–1200. 27 Daubechies, I., Defrise, M., and De Mol, C. (2004). An iterative thresholding algorithm for linear inverse problems with a sparsity constraint. Communications on Pure and Applied Mathematics, 57(11):1413–1457. 27 Davidon, W. C. (1991). Variable metric method for minimization. SIAM Journal on Optimization, 1(1):1–17. Douglas, J. and Rachford, H. H. (1956). On the numerical solution of heat conduction problems in two and three space variables. Transactions of the American mathematical Society, 82(2):421–439. 27 Eckstein, J. and Svaiter, B. F. (2009). General projective splitting methods for sums of maximal monotone operators. SIAM Journal on Control and Optimization, 48(2):787–811. 28 Esser, E., Zhang, X., and Chan, T. F. (2010). A general framework for a class of first order primal-dual algorithms for convex optimization in imaging science. SIAM Journal on Imaging Sciences, 3(4):1015–1046. 28
42
BIBLIOGRAPHY
Giselsson, P. and Boyd, S. (2014a). Diagonal scaling in Douglas-Rachford splitting and ADMM. In Decision and Control (CDC), 2014 IEEE 53rd Annual Conference on, pages 5033–5039. IEEE. 31 Giselsson, P. and Boyd, S. (2014b). Metric selection in fast dual forward backward splitting. Automatica. 31, 33 Goldfarb, D. and Yin, W. (2009). Parametric maximum flow algorithms for fast total variation minimization. SIAM Journal on Scientific Computing, 31(5):3712–3743. 23 Hadamard, J. (1902). Sur les problèmes aux dérivées partielles et leur signification physique. Princeton university bulletin, 13(49-52):28. 19 Huang, J., Zhang, T., and Metaxas, D. (2011). Learning with structured sparsity. The Journal of Machine Learning Research, 12:3371–3412. 21 Krasnosel’skii, M. A. (1955). Two remarks on the method of successive approximations. Uspekhi Matematicheskikh Nauk, 10(1):123–127. 26 Liang, J., Fadili, J., and Peyré, G. (2014). Convergence rates with inexact non-expansive operators. Mathematical Programming, pages 1–32. 35 Lorenz, D. A. and Pock, T. (2014). An inertial forward-backward algorithm for monotone inclusions. Journal of Mathematical Imaging and Vision, 51(2):311–325. 31, 38, 39 Mann, W. R. (1953). Mean value methods in iteration. Proceedings of the American Mathematical Society, 4(3):506–510. 26 Moreau, J.-J. (1965). Proximité et dualité dans un espace hilbertien. Bulletin de la Société mathématique de France, 93:273–299. 25 Mumford, D. and Shah, J. (1989). Optimal approximations by piecewise smooth functions and associated variational problems. Communications on pure and applied mathematics, 42(5):577–685. 23 Nesterov, Y. (1983). A method of solving a convex programming problem with convergence rate o(1/k2). Soviet Mathematics Doklady, 27(2):372–376. 27 Nesterov, Y. (2004). Introductory lectures on convex optimization, volume 87. Springer Science & Business Media. 30 Nesterov, Y. (2013). Gradient methods for minimizing composite functions. Mathematical Programming, 140(1):125–161. 27 Obozinski, G., Jacob, L., and Vert, J.-P. (2011). Group lasso with overlaps: the latent group lasso approach. arXiv preprint arXiv:1110.0413. 22
43
BIBLIOGRAPHY
Parente, L. A., Lotito, P. A., and Solodov, M. V. (2008). A class of inexact variable metric proximal point algorithms. SIAM Journal on Optimization, 19(1):240–260. 31 Parikh, N. and Boyd, S. (2013). Proximal algorithms. Foundations and Trends in Optimization, 1(3):123–231. 24 Passty, G. B. (1979). Ergodic convergence to a zero of the sum of monotone operators in hilbert space. Journal of Mathematical Analysis and Applications, 72(2):383–390. 27 Peyré, G., Bougleux, S., and Cohen, L. (2008). Non-local regularization of inverse problems. In Computer Vision–ECCV 2008, pages 57–68. Springer. 22 Pock, T. and Chambolle, A. (2011). Diagonal preconditioning for first order primaldual algorithms in convex optimization. In Computer Vision (ICCV), 2011 IEEE International Conference on, pages 1762–1769. IEEE. 31 Popov, L. D. (1980). A modification of the arrow-Hurwicz method for search of saddle points. Mathematical Notes, 28(5):845–848. 28 Qian, M. (1992). Variable metric proximal point algorithm: convergence theory and applications. PhD thesis, University of Washington. 31 Raguet, H., Fadili, J., and Peyré, G. (2013). A generalized forward-backward splitting. SIAM Journal on Imaging Sciences, 6(3):1199–1226. 28, 29, 31, 32 Raguet, H. and Landrieu, L. (2015). Preconditioning of a generalized forward-backward splitting and application to optimization on graphs. SIAM Journal on Imaging Sciences. 19, 30, 35 Reich, S. and Zaslavski, A. (2000). Convergence of krasnoselskii-mann iterations of nonexpansive operators. Mathematical and Computer Modelling, 32(11):1423–1431. 26 Repetti, A., Chouzenoux, E., and Pesquet, J.-C. (2015). A random block-coordinate primal-dual proximal algorithm with application to 3d mesh denoising. In 2015 IEEE International Conference on Acoustics, Speech and Signal Processing (ICASSP), pages 3561–3565. IEEE. 39 Riesz, F. (1907). Sur une espèce de géométrie analytique des systèmes de fonctions sommables. CR Acad. Sci. Paris, 144:1409–1411. 31 Rudin, L. I., Osher, S., and Fatemi, E. (1992). Nonlinear total variation based noise removal algorithms. Physica D: Nonlinear Phenomena, 60(1–4):259 – 268. 23 Spingarn, J. E. (1983). Partial inverse of a monotone operator. Applied mathematics and optimization, 10(1):247–265. 28
44
BIBLIOGRAPHY
Tibshirani, R. (1996). Regression shrinkage and selection via the lasso. Journal of the Royal Statistical Society. Series B (Methodological), pages 267–288. 21 Tibshirani, R., Saunders, M., Rosset, S., Zhu, J., and Knight, K. (2005). Sparsity and smoothness via the fused lasso. Journal of the Royal Statistical Society: Series B (Statistical Methodology), 67(1):91–108. 22 Tihonov, A. and Arsenin, V. (1978). Solutions of ill-posed problems. Mathematics of Computation, 32(144):1320–1322. 19 Tropp, J., Gilbert, A. C., et al. (2007). Signal recovery from random measurements via orthogonal matching pursuit. Information Theory, IEEE Transactions on, 53(12):4655–4666. 21 Tropp, J. A. (2004). Just relax: Convex programming methods for subset selection and sparse approximation. ICES report, 404. 21 Wipf, D. P. and Rao, B. D. (2007). An empirical Bayesian strategy for solving the simultaneous sparse approximation problem. Signal Processing, IEEE Transactions on, 55(7):3704–3716. 22 Yuan, M. and Lin, Y. (2006). Model selection and estimation in regression with grouped variables. Journal of the Royal Statistical Society: Series B (Statistical Methodology), 68(1):49–67. 22 Zhao, P. and Yu, B. (2006). On model selection consistency of lasso. The Journal of Machine Learning Research, 7:2541–2563. 21
45
BIBLIOGRAPHY
46
Chapter 3
Aggregating spatial statistics with a generalized forward-backward splitting algorithm Chapter Abstract In this chapter we present a mathematical formalization of the geospatial data aggregation problem. We then show how this problem can be efficiently solved with the algorithm presented in the previous chapter, and provide illustrations and interpretations of the results.
3.1
Aggregation as an optimization problem
As stated in the introduction of this manuscript, the weighted graph framework allows us to cast the task of aggregating spatial data as an optimization problem.
3.1.1
Aggregating spatial statistics
The amount of geo-referenced socio-economic data available has reached volumes that exceeds our ability to analyse it. We consider the problem of aggregating spatial statistics to obtain simple yet accurate representations in map form, facilitating analysis and providing valuable decision aids. Our spatial data consists of an observation (the result of an election in percentages), related to an observation weight (the number of voters), defined over subregions of a geographical space (electoral constituencies). See Table 3.2. In order to capture the spatial structure of the data, we consider a graph G = (V, E), where the vertices V represent the subregions and the edges E ⊂ V ×V represent spatial adjacencies between subregions. Further spatial information is available, encoded by the |V | strictly positive node weight λ and edges weight µ. The node weight λ = (λv )v∈V ∈ R+ |E|
weights the vertices by their surface, and the edge weight µ = (µuv )uv∈E ∈ R+ corresponds to the length of the border between adjacent subregions. y = (yv )v∈V ∈ R|V |
47
3. AGGREGATING SPATIAL STATISTICS WITH A GENERALIZED FORWARD-BACKWARD SPLITTING ALGORITHM
Variable V E λ µ y ν V0
Signification node set edge set node weight edge weight observation observation weight nodes with zero observation weight
Domain
|V |
R+ |E| R+ R|V | |V | R+
Example subregions subregion adjacency subregions surface subregions border length electoral results in percentage population in subregion uninhabited subregions
Table 3.1: Summary of the variables introduced in the map simplification problem
denotes the observed spatial data and its respective weight is denoted by ν = (νv )v∈V ∈ |V |
R+ . In addition, we single out the set V0 of vertices corresponding to regions for which the observation weight is zero. The variables introduced in this section and their meaning are given in Table 3.1.
3.1.2
Problem formulation
We define the simplification energy F such that the simplified data x⋆ is defined by x⋆ ∈ arg minx∈Rn {F (x)} and defined as follows: F (x) =
X X 1X λv |xv |0 νv |xv − yv|2 + s1 µuv |xu − xv |0 + s2 2 v∈V
(u,v)∈E
v∈V0
with V0 = {v ∈ V | νv = 0} the set of nodes with zero observation weight and |·|0 = δ·6=0 the function equal to zero at zero and one everywhere else. This energy is comprised of three parts, each weighted by its respective regularization coefficient. The first term is a data-fidelity measure, favoring a solution x⋆ close to the observation y. Each quadratic difference is naturally weighted by its observation weight. The second term is a penalization ensuring the simplicity of the solution, as it tends to merge together neighboring subregions with similar values. We weight the contribution of each edge proportionally to the length of the borders between the corresponding adjacent regions. This term is thus proportional to the total length of the contours of the constant regions of x, in a similar fashion to the geometric term in the MumfordShah functional (see for instance the review of Vitti (2012)). The coefficient s1 ∈ R++ scales its influence relatively to the other terms in F. Finally, the last term penalizes non-zero values attributed to regions whose observation weight is zero. Without this term, large areas could take values of little significance, eventually cluttering the map. Consequently, we penalize such regions proportionally to their surface. Again, s2 ∈ R++ scales its overall influence in F . The minimization of F is very challenging because the functional |·|0 is neither continuous nor non-convex. Thus, we consider the convex analog of the non-convex
48
3.2 Interpretation
problem F˜ : X X 1X F˜ (x) = λv |xv |. νv |xv − yv|2 + s˜1 µuv |xu − xv | + s˜2 2 v∈V
(u,v)∈E
(3.1)
v∈V0
We solve the non-convex problem my solving a sequence of convex problems of the form (3.1), but with coefficients λ and ν depending each time on the previously found solution, following classical reweighting techniques (see in particular the recent review of Ochs et al. (2015)). We observe that the energy in (3.1) corresponds to the experimental setup presented in the last chapter. Consequently the solution x⋆ of each problem (3.1) can be efficiently computed using the generalized Forward Backward Splitting in its reconditioned form.
3.1.3
Experimental Setting
We perform aggregation of spatial statistics over three different datasets, presented in Table 3.2. The datasets population and revenue are open-source, available at the French National Institute for Statistic and Economics Studies 1 . The dataset election is also open-source, provided by the Cartelec project (Colange et al., 2013). For each experiment a region is partitionned into subregions, and for each subregion a value is observed with respect to an observation weight. In the first experiment it is population density weighted by the subregions surface;i n the second, average revenue weighted by population; in the third election results weighted by number of voters. The first two experiments are rasterized data, i.e. square cells organized along a regular lattice. In the third experiment the vote percentages are given with respect to constituencies and their populations. Constituencies shape can be arbitrary and possibly very complex. To obtain more readable maps, the Delaunay triangulation of the vertices composing the cells is computed, with the constraint that all region borders must be used as edges by the triangles (see Chew (1989)). To each triangle forming a consituency we associate the observation corresponding to its region. In turn, the observation weight is shared among the triangles, proportionally to their surface area. See Appendix A for a more detailed explanation of this process. In the first and third experiment no regions have a zero obervation weight, as no regions has a zero surface area, and no consituency zero voters. In the second experiment however some of the triangles have zero observation weight (no population), and hence V0 is not empty, while it is empty for the two other experiments.
3.2
Interpretation
We list here the benefits and limits of our approach as a map simplification algorithm. 1
IdeesLibres.org 01/2015, INSEE 20/11/2013, https://www.data.gouv.fr/fr/datasets/donneescarroyees-a-200m-sur-la-population/
49
3. AGGREGATING SPATIAL STATISTICS WITH A GENERALIZED FORWARD-BACKWARD SPLITTING ALGORITHM
Dataset Observation Observation weight Space division Spatial extent Number of vertices Number of edges Presence of zero observation weights
y ν
population population density region surface rasters Ile-de-France 252.183 378.258
revenue average revenue population rasters Ile-de-France 252.183 378.258
election election results number of voters constituencies France 4.670.492 7.002.424
no
yes
no
Table 3.2: Dataset summary for each experimental setting
3.2.1
Aggregation as compression
As long as there is no sparsity-inducing ℓ1 penalization, our aggregation method can be seen as a lossy compression process, where one simply seeks for a trade-off between data size and loss of information. As already pointed out in the aggregation model, the complexity of a map is estimated by the total length of the contours between constant regions. We thus measure the compression ratio of the aggregation x of the spatial statistics y as: P µuv |yu − yv |0 P uv∈E uv∈E µuv |xu − xv |0
A compression of c means that the contours are c times shorter. A high value means that the resulting map is much simpler. Similarily, a relevant measure of the relative error is the root (weighted) mean square error between the simplified and observed maps, which we normalize by the (weighted) standard-deviation of the latter: pP P 2 ν v yv v∈V νv (xv − yv ) pP , with y¯ = Pv∈V . ¯)2 v∈V νv v∈V νv (yv − y
A relative error of r means that a proportion 1 − r of the standard deviation is retrieved by the simplified map. A low value of r means that the simplified map is faithful to the original map. The values of compression obtained for different regularizing strengths can be found in Table 3.3. Such measures are reported on Figures 3.2 and 3.1. Because of the presence of the sparsity-inducing penalization term, the aggregations on the revenue dataset are somewhat more difficult to interpret. Note that on Figure 3.1- revenue, local areas without population can still be distinguished, in spite of high degrees of simplification.
3.2.2
Weighted vs uniform regularization
Our formulation allows us to weight the nodes in the fidelity term according to the significance they hold in the error estimation. For example in the case of aggregating the results of an election, the weight of each subregion is determined by the number of
50
3.2 Interpretation
compression 1 6 12 21 26 38
relative error 0 0.34 0.45 0.51 0.54 0.57
Table 3.3: Compression and error for the aggregation for the population data set in the order they are represented in Figure 3.1.
voters. Figure 3.2 represents the results of aggregation weighted by either population or surface for a detail of the election dataset. If both results are comparable in simplicty, the maps regularized with voters count allows us to better capture high density details such as the political polarization at the scale of a city.
3.2.3
Adaptive scaling
Our approach allows the region sizes to adapt to local increase in variability and weight, as opposed to more traditional approaches such as Laplacian regularization Ando and Zhang (2007). Indeed by penalizing by the lenght of contours, the (local) optimum will tend to greatly simplify regions of low density or low variation to concentrate the borders in high variability areas such as urban centers, while still being able to visualize global trends. Our approach overlooks differences between low density areas in favor of statistically more significant local effect. On the contrary, the level of detail has to be set globally for Laplacian based regularizations, as illustrated in Figure 3.3.
51
3. AGGREGATING SPATIAL STATISTICS WITH A GENERALIZED FORWARD-BACKWARD SPLITTING ALGORITHM
52
3.2 Interpretation
Figure 3.1: Left: Aggregation of the population density in the greater Paris area for increasing values of s1 . The colormap represents high density areas in dark red and low density areas in pale orange. Right: Aggregation of the average yearly revenue density in the greater Paris area for increasing values of s1 and s2 . The colormap represents areas of high revenues in dark blue and areas of low revenues in cyan.
53
3. AGGREGATING SPATIAL STATISTICS WITH A GENERALIZED FORWARD-BACKWARD SPLITTING ALGORITHM
(a) Original data
(b) Density
(c) Voters weighted regularization
(d) Surface weighted regularization
(e) Detail: city of Brest
(f ) Detail: city of Brest
Figure 3.2: Close-up on the election dataset: results of the second round of the 2007 French presidential election, broken down by constituencies in French Brittany. Two candidates are opposed, the colormap goes thus from blue to red, representing respectively the regions where one candidate achieve its highest score, respectively its lowest score. Top left: Original map; top right: Number of voters per surface unit over constituencies, from low density in pale orange to high density in dark red; middle left: aggregation weighted by number of voters; middle right: aggregation weighted by surface of preccincts. Compression ratio 9, relative error 0.22. At the bottom row we see a close-up of the city of Brest and can appreciate how an aptly-weighted formulation allows us to capture local details corresponding to high population areas.
54
3.2 Interpretation
(a) Original data
(b) Density
(c) Laplacian regularization
(d) Total Variation regularization
(e) Total boundary length regularization Figure 3.3: Aggregation results for different regularization methods with the same error rate (0.23).
55
3. AGGREGATING SPATIAL STATISTICS WITH A GENERALIZED FORWARD-BACKWARD SPLITTING ALGORITHM
56
Bibliography Ando, R. K. and Zhang, T. (2007). Learning on graph with laplacian regularization. Advances in neural information processing systems, 19:25. 51 Chew, L. P. (1989). Constrained delaunay triangulations. Algorithmica, 4(1-4):97–108. 49 Colange, C., Beauguitte, L., and Freire-Diaz, S. (2013). électorales cartelec (2007-2010). 49
Base de données socio-
Ochs, P., Dosovitskiy, A., Brox, T., and Pock, T. (2015). On iteratively reweighted algorithms for nonsmooth nonconvex optimization in computer vision. SIAM Journal on Imaging Sciences, 8(1):331–372. 49 Vitti, A. (2012). The mumford–shah variational model for image segmentation: An overview of the theory, implementation and use. ISPRS Journal of Photogrammetry and Remote Sensing, 69:50–64. 48
57
BIBLIOGRAPHY
58
Chapter 4
Cut Pursuit: fast algorithms to learn piecewise constant functions on general weighted graphs Chapter Abstract In this chapter we propose working-set/greedy algorithms to efficiently solve problems penalized respectively by the total variation on a general weighted graph and its ℓ0 counterpart the total level-set boundary size when the piecewise constant solutions have a small number of distinct level-sets; this is typically the case when the total level-set boundary size is small, which is encouraged by these two forms of penalization. Our algorithms exploit this structure by recursively splitting the level-sets of a piecewiseconstant candidate solution using graph cuts. We obtain significant increase in speed over state-of-the-art algorithms for images that are well approximated with few levelsets. The material of this chapter is based on Landrieu and Obozinski (2016a) , published in the 19th International Conference on Artificial Intelligence and Statistics (AISTATS 2016), and from its journal version Landrieu and Obozinski (2016b), unpublished.
4.1
Introduction
Estimation or approximation with piecewise constant functions has many applications in image and signal processing, machine learning and statistics. In particular, the assumption that natural images are well modeled by functions whose total variation is bounded motivates its use as a regularizer, which leads to piecewise constant images for discrete approximations. Moreover a number of models used in medical imaging (El-Zehiry and Elmaghraby, 2007) assume directly piecewise constant images. More generally, piecewise constant models can be used for compression, for their interpretability and finally because they are typically adaptive to the local regularity of the function approximated
59
4. CUT PURSUIT: FAST ALGORITHMS TO LEARN PIECEWISE CONSTANT FUNCTIONS ON GENERAL WEIGHTED GRAPHS
(Wang et al., 2014). Piecewise constant functions display a form of structured sparsity since their gradient is sparse. Both convex and non-convex formulations have been proposed to learn functions with sparse gradients. The most famous being the formulation of Rudin et al. (1992), hereafter referred to as ROF, which proposed minimizing the total variation subject to constraints of approximation of the noisy signal in the least squares sense, as well as the formulation of Mumford and Shah (Mumford and Shah, 1989), which proposed penalizing the total length of discontinuities of piecewise smooth functions. A fairly large literature is devoted to these formulations mainly in the image processing and optimization domain. Although the connection between the total variation, the Mumford-Shah energy and graph cuts is today well-established, algorithms that leverage this connection are relatively recent. In particular for ROF, Chambolle and Darbon (2009); Goldfarb and Yin (2009) use the fact that the problem can be formulated as a parametric maxflow. El-Zehiry and Grady (2011) use graph cuts to solve the formulation of Mumford and Shah for the case of two piecewise constant components. The literature on sparsity in computational statistics and machine learning has shown how the sparsity of the solution sought can be exploited to design algorithms which use parsimonious computations to solve the corresponding large-scale optimization problem with significant increase in speed (Bach et al., 2012). Our work is motivated by the fact that this has to the best of our knowledge not been fully leveraged to estimate and optimize with piecewise constant functions. In the convex cases, the algorithms proposed to exploit sparsity are working set1 algorithms and the related (fully corrective) Frank-Wolfe algorithm (Harchaoui et al., 2014). In the non-convex cases, forward selection algorithms such as OMP, FoBa and others have been proposed (Mallat and Zhang, 1992; Needell and Tropp, 2009; Zhang, 2009)2 . It is well understood that algorithms for the convex and non-convex case are in fact fairly related. In particular, for a given type of sparsity, the forward step of working set methods, Frank-Wolfe and greedy algorithm is typically the same, and followed by the resolution of a reduced problem. Given their similarity, we explore in this chapter both greedy and working set strategies. The working set approach is used to solve optimization problems regularized by the total variation while the greedy strategy solves problems penalized by the total boundary size for piecewise constant functions. In the convex case, our algorithms do not apply only to cases in which the data fitting term is the MSE or a separable smooth convex function, for which some efficient algorithms implicitly exploiting sparsity ex1
We distinguish working set algorithms (aka column generation algorithm) that maintain an expansion of the solution which may have zero coefficients from active set algorithms that maintain an expansion using only non-zero coefficients and discard all other directions (or variables). This distinction can also be understood in the dual, where working set algorithms (which are dually cutting plane algorithms) maintain a superset of the active constraints, while active set algorithms maintain the exact set of active constraints. 2 Proximal methods that perform soft-thresholding or the non-convex IHT methods maintain sparse solutions, but typically need to update a full dimensional vector at each iteration, which is why we do not cite them here. They blend however very well with active set algorithms.
60
4.1 Introduction
ist (Bach, 2013; Chambolle and Darbon, 2009; Kumar and Bach, 2015), but also to a general smooth convex term. Our algorithms are very competitive for deblurring and are applicable to the estimation of piecewise constant functions on general weighted graphs.
4.1.1
Notations
Let G = (V, E, w) be an unoriented weighted graph whose edge set is of cardinality m and V = [1, · · · , n]. For convenience of notations and proofs, we encode the undirected graph G, as a directed graph with for each pair of connected nodes a directed edge in each direction. Thus E denotes a collection of couples (i, j) of nodes, with (i, j) ∈ E if and only if (j, i) ∈ E. We also have w ∈ R2m and wij = wji . For a set of nodes A ⊂ V we denote 1A the vector of {0, 1}n such P that [1A ]i = 1 if and only if i ∈ A. For F ⊂ E a subset of edges we denote w(F ) = (i,j)∈F wij . By extension, for two subsets A and � B of V we denote w(A, B) = w (A × B) ∩ E the weight of the boundary between those two subsets. Finally we denote C the set of all partitions of V into connected components.
4.1.2
General problem considered
Problem formulation In this work we consider the problem of minimizing functions Q of the form f (x) + λΦ(x) with f : Rn P → R differentiable and Φ : Rn → R a penalty function that decomposes as Φ(x) = (i,j)∈E wij φ(xi − xj ) with φ : R → + R a sparsity-inducing function such that φ(0) = 0. The general problem writes minx∈Rn Q(x) with λ X . Q(x) = f (x) + wij φ(xi − xj ). 2
(4.1)
(i,j)∈E
Energies of this form were first introduced by Geman and Reynolds (1992) for image regularization, and are widely used for their inducing spatial regularity as well as preserving discontinuities. The function φ is typically the absolute value, which corresponds to the total variation (denoted T V ), or one minus the Kronecker delta at 0, which leads to the total boundary size penalty for piecewise constant functions. More generally, for functions φ that have a non-differentiability at 0, the solution x⋆ of (4.1) has a sparse gradient {x⋆i − x⋆j | (i, j) ∈ E}. As a consequence, these solutions are constant on the elements of a certain partition of V that is typically coarse, i.e. such that has much fewer elements than |V |. We therefore reformulate the problem for candidate solutions that have that property. We define the support of a vector x ∈ Rn as the set S(x) of edges supporting its gradients . S(x) = {(i, j) ∈ E | xi 6= xj }, . and we will use S c (x) = E\S(x) for the set on which the gradients are zero.
61
(4.2)
4. CUT PURSUIT: FAST ALGORITHMS TO LEARN PIECEWISE CONSTANT FUNCTIONS ON GENERAL WEIGHTED GRAPHS
In the general case the approach presented in Section 4.2 can be easily adapated to functions φ that are differentiable in R \ {0}, are decreasing on R− , non-decreasing on R+ and such that limh→0,h>0 φ′ (h) > 0 and limh→0,h 0} and ∇− = V \∇+ . We have the following edge set: Ef low = {(s, i), ∀i ∈ ∇+ } ∪ {(i, t), ∀i ∈ ∇− } ∪ {(i, j), ∀(i, j) ∈ S c }, and the associated capacities: ∇j QS (x) ci,j = −∇i QS (x) λwij
for i = s and j ∈ ∇+ for j = t and i ∈ ∇− for (i, j) ∈ S c
(4.6)
. . where ∇+ = {i ∈ V | ∇i QS (x) > 0} and ∇− = V \∇+ . The vector ∇QS (x) is directly computed as ∇QS (x) = ∇f (x) + 12 λD⊤ y, with D ∈ R2m×n the weighted edge incidence . matrix whose entries are equal to D(i,j),k = wij (1{i=k} − 1{j=k} ) and y ∈ R2m is the
66
4.2 A working set algorithm for total variation regularization
t
− ∂Q∂xS (x) i
nodes in ∇− nodes in ∇+ i
edge in S c λwij
j
∂QS (x) ∂xi
s
Figure 4.1: Directed graph for which finding a maximal flow is equivalent to solving (4.5). Neighboring nodes with different values of x in the original graph are linked by an undirected edge with capacity λwij , nodes with non-negative gradient are linked to the source, and nodes with negative gradient to the sink with capacity |∇QS (x)|.
. vector whose entries are indexed by the elements of E and such that y(i,j) = sign(xi −xj ) with the convention that sign(0) = 0. As stated in the next proposition, finding a minimal cut in this graph provides us with the desired steepest binary cut. Proposition 2. Let S = S(x) then (C, Vf low \C) is a minimal cut in Gf low if and only if C\{s}, and its complement in V are minimizers of B 7→ Q′ (x, 1B ). This result is a well-know result which was first discussed in Picard and Ratliff (1975). We refer the reader to Kolmogorov and Zabih (2004) for a proof. Note that the min-cut/max-flow problem of Figure 5.2 decouples on each of the . connected components of the graph G|S c = (V, S c ) and that as a result solving (4.5) is equivalent to solving separately min h∇QS (xΠ ), 1C i + λw(C, A\C)
C⊂A
for each set A that is a connected components of G|S c . The binary steepest cut thus actually reduces to computing a steep cut in each connected component of the graph, 1
γB and γB c could otherwise be determined by requiring that h1V , uB i = 0. More rigorously, descent directions considered could be required to be orthogonal to span(Π), but this leads to even less tractable formulations, that we therefore do not consider here.
67
4. CUT PURSUIT: FAST ALGORITHMS TO LEARN PIECEWISE CONSTANT FUNCTIONS ON GENERAL WEIGHTED GRAPHS
and they can all be computed in parallel. Let us insist that the connected components of G|S c are often but not always the elements of Π since they can be unions of adjacent elements of Π when they share the same value. We can now characterize the optimality of xΠ or of the corresponding partition Π, based on the value of the steepest binary partition: Proposition 3. We have x = arg minz∈Rn Q(z) if and only if minB⊂V Q′ (x, 1B ) = 0 and Q′ (x, 1V ) = 0. Proof. See Appendix C Note that the rationale we propose to choose the new direction 1B is different than the one typically used for working-set algorithms in the sparsity literature and variants of Frank-Wolfe. When considering the minimization of an objective of the form f (x) + λΩ(x), where f : Rn → R is a differentiable function and Ω is a norm, the optimality condition in terms of subgradient is − λ1 ∇f (x) ∈ ∂Ω(x), where ∂Ω(x) is the subgradient of the norm Ω at x. A classical result from convex analysis is that ∂Ω(x) = {s ∈ Rn | hs, xi = Ω(x) and Ω◦ (s) ≤ 1} where Ω◦ denotes the dual norm (Rockafellar, 1970, Thm. 23.5). In particular, the subgradient condition is not satisfied if Ω◦ (−∇f (x)) ≥ λ and since Ω◦ (s) = maxΩ(ξ)≤1 hs, ξi then argmaxΩ(ξ)≤1 h−∇f (x), ξi provides a direction in which the inequality constraint is most violated. This direction is the same as the Frank-Wolfe direction for the optimization problem minx:Ω(x)≤κ f (x), also the same as the direction proposed in a variant of the Frank-Wolfe algorithm proposed by Harchaoui et al. (2014) for the regularized problem, and again the same as the direction that would be used in the primal active set algorithm of Bach (2013, Chap. 7.12) for generic Lovász extensions of submodular function, which is essentially a fully corrective and active-set version of the algorithm of Harchaoui et al. (2014). This rationale extends to the case where Ω is more generally a gauge and is most relevant when it is an atomic norm or gauge (Chandrasekaran et al., 2012), which we discuss in Appendix C. For decomposable atomic norms (Negahban et al., 2009) that have atoms of equal Euclidean norm, one can check that the steepest descent direction that we propose and the Franck-Wolfe direction are actually the same. However, for the the total variation the two differ. The Frank-Wolfe direction leads to the choice B ⋆ = arg maxB⊂V −w(B, B c )−1 h∇f (xΠ ), 1B i. We show in Section 4.4.1 and via results presented in Figure 4.6 that using the steepest cut direction outperforms the FrankWolfe direction.
4.2.2
Induced new partition in connected sets and new reduced problem
For Π = (A1 , · · · , Ak ), BΠ is chosen Pk so that the addition of a term of the form c c h uB = hγB 1B − hγB 1B to x = i=1 ci 1Ai decreases the objective function Q the most. At the next iteration, we could thus consider solving a reduced problem that consists of minimizing Q under the constraint that x ∈ span(1A1 , . . . , 1Ak , 1B ) with B = BΠ . But there is in fact a simpler and more relevant choice. Indeed, on the set
68
4.2 A working set algorithm for total variation regularization
span(1A1 , . . . , 1Ak , 1B ), the values xi1 , xi2 , xi3 and xi4 with i1 ∈ Aj ∩ B, i2 ∈ Aj ∩ B c , i3 ∈ Aj ′ ∩B and i4 ∈ Aj ′ ∩B c are a priori coupled; also, if Aj ∩ B has several connected components i 7→ xi must take the same value on these components. These constraints seem unnecessarily S restrictive. . . Consider SΠ = (A,A′ )∈Π2 ∂(A, A′ ) with ∂(A, A′ ) = (A×A′ )∩E. With the notion of support S(x) that we defined in (4.2) we actually have span(Π) = {x ∈ Rn | S(x) ⊂ SΠ }. . Now, if x ∈ span(1A1 , . . . , 1Ak , 1B ), we have in general S(x) ⊂ Snew = SΠ ∪ ∂(B, B c ), which corresponds to allowing a larger support. But then it makes sense to allow x to remain in the largest set with this maximal support Snew , that is equivalent to staying in . the vector space XSnew = {x′ | S(x′ ) ⊂ Snew }. But, if we now define Πnew as the partition of V defined as the collection of all connected components in G of all sets Aj ∩ BΠ and c for A ∈ Π, then it is relatively immediate that span(Π Aj ∩ BΠ j new ) = XSnew . The construction of Πnew from Π is illustrated in Figure 4.2.
A1
A2
A1
B
A3
A2 A4 A5
B (a) Initial partition Π = {A1 , A2 }
(b) Steepest Binary Cut B
(c) Πnew {A1 , A2 , A3 , A4 , A5 }
=
Figure 4.2: Illustration of the induced new partition. From an initial partition Π, the steepest binary cut B induced a new partition Πnew . The solid line represent the the new contours Snew \ S introduced by B. initial contours S, and the dashed line Note that the binary partition induced by B can more than double the number of resulting components.
We therefore set Πnew to be the new partition and solve the reduced problem constrained to span(Πnew ). Note that in general we do not have S(xΠ ) = SΠ , because the total variation regularization can induce that the value of xΠ on several adjacent elements of Π is the same. c ) was obtained as a The following result shows that if a non-trivial cut (BΠ , BΠ solution to (4.5) then the new reduced problem has the following solution xΠnew = arg minx∈span(Πnew ) Q(x) which is strictly better than the previous one. Proposition 4. If BΠ 6= ∅, Q(xΠnew ) < Q(xΠ ). Proof. We clearly have span(Π) ⊂ span(1A1 , . . . , 1Ak , 1BΠ ) ⊂ span(Πnew ), so that Q(xΠnew ) =
min
x∈span(Πnew )
Q(x) ≤
69
min
x∈span(Π)
Q(x) = Q(xΠ ).
4. CUT PURSUIT: FAST ALGORITHMS TO LEARN PIECEWISE CONSTANT FUNCTIONS ON GENERAL WEIGHTED GRAPHS
(a)
(b)
(c)
(d)
(e)
Figure 4.3: Two first iterations of cut pursuit for the ROF problem on the picture in (a). c Images (b) and (d) represent the new cut at iterations 1 and 2 with BΠ and BΠ respectively in black and white, and (c) and (e) represent the partial solution in levels of gray, with the current set of contours S in red. The contours induced by the cut in (b) (resp. (d)) are superimposed on (c) (resp. (e)).
Moreover, if BΠ 6= 0, then Q′ (xΠ , 1B ) < 0, which entails that there exists ε > 0 such that Q(xΠnew ) ≤ Q(xΠ + ε1B ) < Q(xΠ ). This completes the proof.
Algorithm 3: Cut Pursuit Initialize Π ← {V }, xΠ ∈ arg minz=c1V ,c∈R Q(z), S ← ∅ while minB⊂V h∇QS (xΠ ), 1B i+λwS c (B, B c ) < 0 do Pick BΠ ∈ arg minB⊂V h∇QS (xΠ ), 1B i+λwS c (B, B c ) c ∩ A} Π ← {BΠ ∩ A}A∈Π ∪ {BΠ A∈Π Π ← connected components of elements of Π Pick xΠ ∈ arg minz∈span(Π) Q(z) S ← S(xΠ ) return (Π, xΠ ) We summarize the obtained working set scheme as Algorithm 3, and illustrate its two first steps on a ROF problem in Figure 4.3.* At the beginning of each iteration, if minB⊂V Q′ (xΠ , 1B ) < 0 then the steepest binary partition is not trivial: BΠ 6= ∅. Consequently the new partition Πnew will have at least one more component than Π, and Proposition 4 states that the solution associated with Πnew will be strictly better than xΠ . This insures that the objective function is strictly decreasing along iterations of the algorithm. If minB⊂V Q′ (xΠ , 1B ) = 0, then Proposition 3 insures that optimality is reached. Provided that each constrained problem xΠ ∈ arg minz∈span(Π) Q(z) is solved exactly in finite time, this proves that xΠ converges to the the optimum x⋆ . In term of complexity, since the number of component of Π is strictly increasing and bounded by n, the algorithm converges in at most n steps, in the worst case scenario. In the next section we discuss how to exploit the sparse structure of xΠ to solve the reduced problem efficiently.
70
4.2 A working set algorithm for total variation regularization
node of V edge of E node of V
1
n1
n2
2
n4 {n1}
1 2
edge of E
n3
1
{n2,n3} {n3,n4} 3
5
n5
3
Figure 4.4: Example of reduced graph. Left: graph G with weights (wij )(i,j)∈E on the edges, Middle: partition Π of G into connected components, Right: reduced graph G with weights (wAB )(A,B)∈E on the edges.
4.2.3
A reduced graph for the reduced problem
Let Π be a coarse partition of V into connected components. We argue that the minimization problem minz∈span(Π) Q(z) can be solved efficiently on a smaller weighted graph whose nodes are associated with the elements of partition Π, and whose edges correspond to pairs of adjacent elements in the original graph. Indeed, consider the graph G = (V, E) with V = Π and E = {(A, B) ∈ V2 | ∃(i, j) ∈ (A × B) ∩ E}. Figure 4.4 shows an example of graph reduction on a small graph. For x ∈ span(Π) we can indeed express TV(x) simply: P Proposition 5. For x = A∈Π cA 1A we have TV(x) = TVG (c) with P . TVG (c) = 12 (A,B)∈E w(A, B) |cA − cB |. Proof.
2TV(x) =
X
wij |xi − xj | =
(i,j)∈E
=
X
(A,B)∈Π2
X
wij
(i,j)∈E
|cA − cB |
X
X
1{i∈A,j∈B} |cA − cB |
(A,B)∈Π2
wij ,
(i,j)∈E∩(A×B)
hence the result using the definition of w(A, B). Note that if TV is the total variation associated with the weighted graph G with weights (wij )(i,j)∈E then TVG is the total variation associated with the weighted graph � P G and the weights w(A, B) (A,B)∈E . Denoting f˜ : c 7→ f ( A∈Π cA 1A ), the reduced problem is equivalent to solving min k f˜(c) + λTVG (c) on G. If Π is a coarse parc∈R
tition, we have |E| ≪ 2m and computations involving TVG are much cheaper than those involving TV. As illustrated in Section 4.2.4, the structure of f˜ can often be exploited as well to reduce the computational cost on the reduced problem. The construction of the reduced graph itself G is cheap compared to the speed-ups allowed, as it is obtained by computing the connected components of the graph (V, E\S(x)), which can be done in linear time by depth-first search. Note that once the reduced problem is if cΠ ∈ arg minc f˜(c) + λTV � G (c), then S(xΠ ) is directly computed as S solved, ′ ′ S(xΠ ) = ∂(A, A ) | (A, A ) ∈ E, cA 6= cA′ .
71
4. CUT PURSUIT: FAST ALGORITHMS TO LEARN PIECEWISE CONSTANT FUNCTIONS ON GENERAL WEIGHTED GRAPHS
4.2.4
Solving linear inverse problems with TV
A number of classical problems in image processing such as deblurring, blind deconvolution, and inpainting are formulated as ill-posed linear inverse problems (Chan et al., 2005), where a low TV prior on the image provides appropriate regularization. Typically if x0 ∈ Rn is the original signal, H a p × n linear operator, ǫ additive noise, and y = Hx0 + ǫ ∈ Rp the degraded observed signal, this leads to problems of the form: x⋆ = arg min x∈Rn
1 kHx − yk2 + λTV(x) 2
(4.7)
First order optimization algorithms, such as proximal methods, only require the computation of the gradient H ⊺ Hx − H ⊺ y of f and can be used to solve (4.7) efficiently. However the reduced problem can be computed orders of magnitude faster provided that the current partition is coarse. Indeed for a k-partition Π of V we denote K ∈ {0, 1}n×k the matrix whose columns are the vectors 1A for A ∈ Π. Any x ∈ span(Π) can be rewritten as Kc with c ∈ Rk . The gradient of the discrepancy function with respect to c writes: ∇c 1/2 kHKc − yk2 = K ⊺ H ⊺ HKc − K ⊺ Hy. As a result, the reduced problem can be solved by a similar first-order scheme of much smaller size, with parameters K ⊺ H ⊺ HK and K ⊺ Hy, which are of size k × k and k respectively, and which can be precomputed in O(k p n) time, which is the same complexity as one iteration of gradient descent of the full problem. Solving the reduced problem is then very quick provided k is small compared to n. In the case of a blurring operator H with adequate symmetry, for which p = n is large, manipulating the matrices H or H ⊺ directly should be avoided. However x 7→ Hx being a convolution, it can be computed quickly using fast Fourier transform. The parameters K ⊺ H ⊺ HK and K ⊺ Hy can also be precomputed using fast Fourrier transform in O(k 2 n log n) time, and the reduced problem can in turn be solved very quickly for k small.
4.2.5
Complexity analysis
The computational bottlenecks of the algorithm could a priori be (a) the computation of the steepest binary cut which requires to solve a min cut/max flow problem, (b) the cost of solving the reduced problem, (c) the computation of the reduced graph itself, (d) the number of global iterations needed. (a) The steepest binary cut is obtained as the solution of a max-flow/min-cut optimization problem. It is well-known that there is a large discrepancy between the theoretical upper bound on the complexity of many graph-cut algorithms and the running times observed empirically, the former being too pessimistic. In particular, the algorithm of Boykov et al. (2001a) has a theoretical exponential worst case complexity, but scales essentially linearly with respect to the graph size in
72
4.2 A working set algorithm for total variation regularization
practice. In fact, it is known to scale better than some algorithms with polynomial complexity, which is why we chose it. (b) Solving the reduced problem can be done with efficient proximal splitting algorithms such as Raguet and Landrieu (2015), which is proved to reach a primal suboptimality gap of ε in O(1/ε2 ) iterations; in practice, the observed convergence rate is almost linear. Preconditioning greatly speeds up convergence in practice. Moreover, the problems induced on the reduced graph can typically be solved at a significantly reduced cost: in particular, as discussed in section 2.4, for a quadratic data fitting term and H a blurring operator, the gradient in the subgraph can be computed in O(k 2 ) time, based on a single efficient FFT-based computation of the Hessian per global iteration which itself takes O(k 2 n log n) time. For problems with coarse solutions, this algorithm is only called for small graphs so that this step only contributes to a small fraction of the the running time. (c) Computing the reduced graph requires computing the connected components of the graph obtained when removing the edges in S, and the weights w(A, B) between all paris of components (A, B). Theis can be efficiently performed in O(m + n) through a depth-first exploration of the nodes of the original graph. (d) The main factor determining the computation time is the number of global iterations needed. In the worst case scenario, this is O(n). In practice, the number of global iterations seems to grow logarithmically with the number of constant regions at the optimum. If for simple images or strongly regularized natural images 4 or 5 cuts seems to suffice, a very complex image with very weak regularization might need many more. In the end, our algorithm is only efficient on problems whose solutions do not have too many components. E.g. in the deblurring task, it is competitive for solutions with up to 10, 000 components for a 512 × 512 image. We would like to draw the reader’s attention to the fact that even though we ignored in Section 4.2.1 the term γB + γB c , this is not the case in general, our proofs still hold. The direction 1B + 1B c will not be in general the steepest descent direction, however Proposition 4 insures that it is always a descent direction. Furthermore Proposition 3 states that if no descent direction of this form can be found, optimality is reached. In practice, foregoing the value of γB + γB c favors binary partitions BΠ which are balanced, i.e. such that the cardinal of BΠ is close to n/2. As such partitions are more likely to have many connected components, this leads to faster partitioning of the graph. The trade-off being that it tends to overshoot, resulting in a final partition that is more refined than it needs to be, increasing the reduced problem’s size.
4.2.6
Regularization path of the total variation
Since the regularization coefficient λ is difficult to choose a priori, it is typically useful to compute an approximate regularization path, that is the collection of solutions to (4.1) for a set of values λ0 > · · · > λj > 0. For ℓ1 sparsity, Efron et al. (2004) showed how a
73
4. CUT PURSUIT: FAST ALGORITHMS TO LEARN PIECEWISE CONSTANT FUNCTIONS ON GENERAL WEIGHTED GRAPHS
fraction of the exact regularization path can be computed in a time of the same order of magnitude as the time need to compute of the last point. In general, when the path is not piecewise linear, the exact path cannot be computed, but similar results have been shown for group sparsity (Obozinski et al., 2006; Roth and Fischer, 2008). The case of total variation has been studied as well for 1-dimensional signals in Bleakley and Vert (2011). We propose a warm start approach to compute an approximate1 solution path for the total variation. The rationale behind our approach is that, if λi and λi+1 are close, the associated solutions x⋆i and x⋆i+1 should also be similar, as well as their associated optimal partition, which we will refer to as Π⋆i and Π⋆i+1 . Consequently, it is reasonable to use a warmstart technique which consists of initializing Algorithm 3 with Π⋆i to solve the problem associated with λi+1 and to expect that it will converge in a small number of binary cuts. It is important to note that while our algorithm lends itself naturally to warm starts, to the best of our knowledge similar warm-start techniques do not exist for proximal splitting approaches such as Raguet et al. (2013) or Chambolle and Pock (2011). Indeed solutions whose primal solutions are close can have vastly different auxiliary/dual solutions, and in our experiments no initialization heuristics consistently outperformed a naive initialization.
4.3
Minimal partition problems
We consider now a generalization of theP minimal partition problem minx∈Rn Q(x) with . 1 Q(x) = f (x) + λΓ(x) where Γ(x) = 2 (i,j)∈S(x) wij the total boundary size penalty for piecewise constant functions. This non-convex non-differentiable problem being significantly harder than the previous one, Pwe restrict the functions f we consider to be separable functions of the form f (x) = i∈V fi (xi ) with fi : R 7→ R continuously differentiable and convex. Our formulation, unlike most examples of the minimal partition problem in the literature, does not imply fixing the number of components in advance. We call the corresponding problem generalized minimal partition problem. Inspired by greedy feature selection algorithms in the sparsity literature and by the working set algorithm we presented for TV regularization, we propose exploiting the fact that the optimal partition |Π∗ | is not too large to construct an algorithm that greedily optimizes the objective by adding and removing cuts in the graph. Indeed, the problem that we consider has a fixed regularization coefficient λ, and so its natural counterpart for classical sparsity is the problem of minimizing an objective of the form f (x) + λkxk0 which subsumes AIC, BIC and other information criteria. The algorithmic approach we consider is thus the counterpart of a very natural greedy algorithm to minimize the former objective, which surprisingly is almost absent from 1
In fact for a quadratic data fitting term regularized by the total variation, the regularization path is piecewise linear and could thus in theory computed exactly, with a scheme similar to the LARS algorithm (Efron et al., 2004). It should however be expected that this path has many point of discontinuity of the gradient, which entails that the cost of computation of the whole path is likely to be prohibitively high. We therefore do not consider further this possibility.
74
4.3 Minimal partition problems
the literature, perhaps for the following reasons: On the one hand, work on stagewise regression and forward-backward greedy algorithms, which both add and remove variables, goes back to the 60ies (Efroymson, 1960), but the algorithms then considered were based on sequences of tests as opposed to a greedy minimization of a penalized criterion. On the other hand, the literature on greedy algorithms for sparse models has almost exclusively focused on solving the constrained problem minx f (x) s.t. kxk0 ≤ k, with algorithms such as OMP, Orthogonal least squares (OLS), FoBa, and CoSamp, which can alternatively be viewed as algorithms that are greedily approximating the corresponding Pareto frontier. A notable exception is IHT. A very natural variant of OLS solving minx f (x) + λ kxk0 can however be obtained by adding the ℓ0 penalty to the objective. This algorithm was formally considered in Soussen et al. (2011) under the name Single Best Replacement (SBR), in reference to the similar Single Maximum Likelihood Replacement (SMLR) of Kormylo and Mendel (1982). At each iteration, the algorithm considers adding or removing a single variable, whichever reduces the value of the objective the most. It should be noted that while the similar OLS and OMP are forward algorithms, SBR is a forward-backward algorithm, which can remove a variable provided doing so only increases f by less than λ. We argue in the following sections that a similar natural algorithm can be designed for the generalized minimal partition problem, where forward steps split existing components and backward steps merge two components (with the further possibility of combined merge-resplit moves). We call this algorithm ℓ0 -Cut Pursuit, since it is also naturally very similar to Cut Pursuit.
4.3.1
A greedy algorithm for regularized minimal partition
As for Pkthe working set algorithm, we propose building an expansion of x of the form x = i=1 ci 1Ai , for Π = (A1 , · · · , Ak ) a partition of V , by recursively splitting some of the existing sets A ∈ Π. Assume that we split the set of existing regions (Aj )1≤j≤k by introducing a global cut (B, B c ) for some set B ⊂ V . This cut induces a cut on each element Aj of the form (Aj ∩B, Aj ∩B c ). Two simple properties should be noted: (a) the additional boundary length incurred with the cut is simply the sum Pk of the lengths of the cuts induced within each element Aj and is precisely of the form j=1 w(Aj ∩B, Aj ∩B c ) — the boundary of previously accepted component is thus “free” (cf Figure 4.2), (b) if the value of x is re-optimized under the constraint that it should be constant on each of the elements Aj ∩ B and Aj ∩ B c of the new partition, then the separability of f entails that the optimization is independent on each set Aj . As a consequence of (a) and (b) the choice of an optimal cut reduces to independent choices of optimal cut on each set Aj as defined by the objective X X min min′ fi (h′j ) + λw(Aj ∩ B, Aj ∩ B c ). fi (hj ) + B⊂V (hj ,hj )
i∈Aj ∩B
i∈Aj ∩B c
We should therefore design an algorithm that cuts a single set A at a time. To simplify notations we consider hereafter the case Π = {V }, which corresponds to the very first cut of the algorithm.
75
4. CUT PURSUIT: FAST ALGORITHMS TO LEARN PIECEWISE CONSTANT FUNCTIONS ON GENERAL WEIGHTED GRAPHS
Optimal binary cut with alternating minimization In the same way that we defined the steepest binary cut in the working set algorithm, we define the optimal binary partition (B, B c ) of V such that Q optimized over span(1B , 1B c ) is as small as possible. Ideally, we should impose that B and B c have a single connected component each, because as argued in section 4.2.3, it does not make sense to impose that xi should have the same values in different connected components. However, since this constraint is too difficult to enforce, we first ignore it and address it later with post-processing. Note however that the penalization of the length of the boundary between B and B c should strongly discourage the choice of sets B with many connected components. Since Γ(h1B + h′ 1B c ) = Γ(1B ) = w(B, B c ), and ignoring the connectedness constraint, the corresponding optimization problem is of the form X X fi (h′ ) + λw(B, B c ). (4.8) fi (h) + min min ′ B⊂V h,h ∈R
i∈B
i∈B c
This problem is a priori hard to solve in general, because B 7→ minh,h′ ∈R f (h1B +h′ 1B c ) is not a submodular function. However, when h, h′ are fixed, the assumption that f is separable entails that B 7→ f (h1B + h′ 1B c ) is a modular function, so that the objective can be optimized with respect to B by solving a max-flow problem. Similar to the flow problem (4.9) we define the flow graph Gf low = (V ∪ {s, t}, Ef low ) whose edge set and . . capacities are defined as followed, with ∇+ = {i ∈ V | fi (h) > fi (h′ )} and ∇− = V \∇+ .: Ef low = {(s, i), ∀i ∈ ∇+ } ∪ {(i, t), ∀i ∈ ∇− } ∪ {(i, j), ∀(i, j) ∈ S c },
and the associated capacities: ′ fj (h) − fj (h ) for i = s and j ∈ ∇+ (4.9) ci,j = fi (h′ ) − fi (h) for j = t and i ∈ ∇− c λwij for (i, j) ∈ S . . where ∇+ = {i ∈ V | fi (h) > fi (h′ )} and ∇− = V \∇+ . The smoothness and convexity of f with respect to h and h′ guarantee that the objective can be minimized efficiently with respect to these P variables. AsPsuggested by Bresson et al. (2007) or El-Zehiry et al. (2011), ψ(B, h, h′ ) = i∈B fi (h)+ i∈B c fi (h′ )+ λw(B, B c ) can be efficiently minized by alternatively minimizing with respect to B and (h, h′ ). This alternated procedure can be shown to find a local minimum of ψ(B, h, h′ ) with the following assumptions: • (A0): the function fi are continuous. • (A1): the solution of min(h,h′ ) ψ(h, h′ , B) exists and is unique for all sets B. • (A2): the minimizer with respect to B of ψ(hA , h′A , B) is unique for all A. Note that (A1) holds if for example all functions fi are strictly convex. (A2) can be shown to hold with probability one if fi is appropriately random, for example if fi (·) = (· − xi )2 with xi drawn i.i.d. from a continuous distribution, which corresponds to our case of interest.
76
4.3 Minimal partition problems
Proposition 6. Assuming that the assumptions (A0), (A1) and (A2) hold, the alternate minimization scheme converges in a finite number of iterations to a local minimum of ψ(h, h′ , B) in the sense that there exists a neighborhood NB of (hB , h′B ) such that for all (h, h′ , A) ∈ NB × 2V , we have ψ(h, h′ , A) ≥ ψ(hB , h′B , B). Proof. Let ψ(B) = minh,h′ ψ(h, h′ , B). By construction and with assumption (A1), the sequence (ψ(B t ))t is strictly decreasing until minimization with respect to either (h, h′ ) or B yields no progress, i.e. until a partial minimum with respect to both blocks is attained. Since the set 2V is finite, the algorithm must converge in a finite number of iterations. The point B attained must be a local minimum in the sense above: indeed for any set A different than B, we must have φ(hB , h′B , B) < φ(hB , h′B , A) because the algorithm stopped (which excludes φ(hB , h′B , B) > φ(hB , h′B , A)) and because an equality is excluded by (A2). But then by assumption (A0), φ is continuous with respect to (h, h′ ) so that in a neighborhood NB of (hB , h′B ) we must have φ(h, h′ , A) sufficiently close to φ(hB , h′B , A) for the inequality characterising a local minimum to hold.
From binary cut to partition in connected components Like the working set algorithm proposed for the total variation, ℓ0 -Cut Pursuit recursively splits the components of the current partition Π. The sets B and B c obtained as a solution of (4.8) are not necessarily connected sets, but splitting B and B c into their connected components and assigning each connected component its own value obviously does not change the contour length Γ and can only decrease f . Given the collection of connected components A1 , . . . , AkP of B and B c we therefore set x = h1 1A1 + . . . + hk 1Ak with hj the minimizer of h 7→ i∈Aj fi (h). Note that each hi could possibly be computed in parallel given the separability of f .
Backward step In greedy algorithms for plain sparsity, backward steps remove variables to reduce the support of the solution. In our case, the appropriate notion of support is S(x), which is formed as the union of the boundaries between pairs of components. A backward step is a step that reduces the total boundary length (or size). The most natural way to obtain this is by merging two adjacent components. Using the same ideas as the ones proposed in Soussen et al. (2011) for plain sparsity, we consider backward steps when the reduction of penalty obtained is larger than the increase of f . Simple merge step: If a pair of adjacent components (A, B) is merged into a single constant component, Γ(x) decreases by w(A, B) and the merge is worth it if f increases by less than λ w(A, B). If we denote Π− (A, B) the partition obtained by merging A and B, the corresponding decrease in energy δ− (A, B) is δ− (A, B) = f (xΠ ) − f (xΠ− (A,B) ) + λw(A, B), . with Π− (A, B) = Π\{A, B}∪{A∪B}. It should be noted that the merge step considered does not in general not correspond to canceling a previous cut.
77
4. CUT PURSUIT: FAST ALGORITHMS TO LEARN PIECEWISE CONSTANT FUNCTIONS ON GENERAL WEIGHTED GRAPHS
A shortcoming of the simple merge step is that while the removal of boundaries between components is considered, a shift or other type of remodeling of the created boundaries is not possible. But since the optimal binary computation only considers binary partitions, the shape of the components might be suboptimal without justifying, however, a complete removal. We therefore consider another kind of step: Merge-resplit: This step is a combination of a merge step immediately followed by a new cut step on the merged components. It is a “backward-then-forward” step, which can be worth it even if the corresponding backward step taken individually is not decreasing the objective. It amounts to solve the corresponding min cut/max flow problem min
zi ∈{0,1},i∈A∪B
X
zi fi (xA ) + (1 − zi )fi (xB ) +
i∈A∪B
λ 2
X
wij |zi − zj |.
(i,j)∈(A×B)∩E
Note that finding the best way to resplit is very similar to what Boykov et al. (2001b) call an α-β swap in the context of energy minimization in Markov random fields: nodes assigned to other components1 than A or B keep their current assignments to components, but the nodes of A ∪ B are reassigned to A or B so that the boundary between A and B minimizes the above energy. Note that the merge-resplit step includes the possibility of a simple merge step (without resplitting), since all elements can be “swapped” in the same set by the α-β swap , so that the new boundary is effectively empty. Note that during the merge-resplit step the value of xA and xB is held constant and only updated upon completion of the step. In fact, in a number of cases, it might be possible to iterate such steps for a given pair (A, B). We do not consider this computationally heavier possibility. Remark: The work we presented in this section focussed on a formulation in which the total boundary size is penalized and not constrained. It is worth pointing out that trying to solve directly the constrained case seems difficult: indeed, designing algorithms that are only based on forward steps (e.g., in the style of OMP, OLS, etc) might not succeed, because of the dependence between the cuts that need to be introduced to form the final solution. Based on similar ideas as the ones used in ℓ0 -Cut Pursuit, we designed and tested an algorithm generalizing the FoBa algorithm (Zhang, 2009). The obtained algorithm tended to remain trapped in bad local minima and yielded solutions that were much worse than the ones based on the penalized formulation.
4.3.2
Implementation
Similar to the convex case, ℓ0 -Cut Pursuit maintains a current partition Π that is recursively split and computes optimal values for each of its components. It is comprised of three main steps: the splitting of the current partition, the computation of the connected components and their values, and a potential merging step, when necessary. Splitting. For each component an optimal binary partition (B, B c ) is obtained by 1
In the context of MRFs the components correspond to a number of different classes fixed in advance and are in general not connected.
78
4.3 Minimal partition problems
solving (4.8) as described in section 4.3.1: we alternatively minimize the objective with respect to B and with respect to (h, h′ ) until either B does not change or a maximum number of iterations is reached. In practice, the algorithm converges in 3 steps most of the time. The choice of an appropriate initialization for B is non-trivial. Since the problem in which λ = 0 is often simpler, and can in a number of cases be solved analytically, we chose to use that solution to initialize our alternating minimization scheme. Indeed, for λ = 0, and when f is a squared Euclidean distance f : x 7→ kx−x0 k22 the objective of (4.8) is the same as the objective of one dimensional k-means with k = 2; in this particular setting, the problem reduces to a change-point analysis problem, and an exact solution can be computed efficiently by dynamic programming (Bellman, 1973). This can be generalized to the case of Bregman divergences and beyond (Nielsen and Nock, 2014). As described in section 4.3.1, the partition Π is updated by computing its connected components after it is split by (B, B c ). Subroutine 1 gives the procedure algorithmically. It is important to note that this is the only operation that involves the original graph G, and hence will be the computational bottleneck of the algorithm. Fortunately since f is separable, this procedure can be performed on each component in parallel. Component saturation. We say that a component is saturated if the empty cut is an optimal binary cut. A saturated component will no longer be cut (because the separability of f entails that other cuts do not change the fact that it is saturated) unless it is first involved in a merge or merge-resplit step. A partition Π is said to be saturated if all its components are saturated. Simple merge. This backward step consists of checking for each neighboring components A and B in Π whether merging them into a single component decreases the energy. δ− is computed for each neighboring components, and stored in a priority queue. Each pair that provides a nonnegative decrease is merged, and δ− is updated for the neighbors of A and B to reflect the change in value and graph topology. This operation scales with the size of the reduced graph only, and therefore can be performed efficiently for problems with a coarse solution. Merge-resplit. This more complex backward step, already described in 4.3.1 is significantly computationally more intensive as it is performed on the edges of the full graph, by contrast with the simple merge which only considers the edges of the reduced graph. As a consequence, while all potential simple merge steps can be precomputed and performed based on a priority queue by merging first the pair of components yielding the largest decrease in objective value, this would be too computationally heavy here and we perform boundary changes only once for each pair of neighbors in the graph E. The pseudocode of the procedure is detailed in subroutine 3. Algorithm structure: In Algorithm 4 and 5, we present implementations of the algorithm using respectively only simple merge or merge-resplit steps. We chose to alternate between splitting all components at once (possibly in parallel) and then iterating backward steps over all adjacent pairs of components. This allows for the splitting to be done in parallel directly on the original flow graph, thus avoiding the memory over-
79
4. CUT PURSUIT: FAST ALGORITHMS TO LEARN PIECEWISE CONSTANT FUNCTIONS ON GENERAL WEIGHTED GRAPHS
heads associated with constructing a new flow graph for each new component. It would have been theoretically possible to be more greedy and to perform a single forward step (corresponding to splitting a single region) at a time or a single backward step at a time by maintaining a global priority queue and greedily choosing the most beneficial. However we did not implement this option because the overhead costs would have been prohibitive.
Subroutine 1: [Π, E] ← split(Π, E, A) Split component A with a binary cut. Π ← Π \ {A} P P B ← arg minB⊂A,h,h′ i∈B fi (h) + i∈B c fi (h′ ) while not_converged do P x ← arg minh Pi∈B fi (h) x′ ← arg minh i∈A\B fi (h) P P B ← arg minB⊂A i∈B fi (x) + i∈B c fi (x′ ) + λw(B, B c ) [B1 , · · · , Bk ] ← connected components of B and A \ B Π ← Π ∪ {B1 , · · · , Bk } E ← updated adjacency structure return Π;
Subroutine 2: [Π, E] ← simple_merge(Π, E, A, B) Merges components A and B Π ← Π \�{A, B} ∪ {A ∪ B} E ← E \ {A, B} for C neighbors � of A or B do E ← E ∪ {A ∪ B, C}
Subroutine 3: [Π, E] ← merge_resplit(Π, E, A, B) Perform a merge-resplit operation on components A and B. [Π, E] ← simple_merge(Π, E, A, B) Π ← Π \ {A ∪ B} P xA ← arg minh Pi∈A fi (h) xB ← arg minh i∈BPfi (h) P C ← arg minC⊂A∪B i∈C fi (xA ) + i∈A∪B\C fi (xB ) + λw(C, A ∪ B \ C) [C1 , · · · , Ck ] ← connected components of C and A ∪ B \ C Π ← Π ∪ {C1 , · · · , Ck } E ← updated adjacency structure
80
4.3 Minimal partition problems
Algorithm 4: Simple merge variant (ℓ0 -CPm) Initialization: Π0 = {V }, E = ∅ while Π is not saturated do for A ∈ Π in parallel do if A is not saturated then [Π, E] ← split (Π, E, A) Compute δ− (A, B) for all (A, B) ∈ E while max(A,B)∈E δ− (A, B) > 0 do (A, B) = arg max(A′ ,B ′ )∈E δ− (A′ , B ′ ) [Π, E] ← merge (Π, E, A, B) Update δ− (A, B) for all (A, B) ∈ E
Algorithm 5: Merge-resplit variant (ℓ0 -CPs) Initialization: Π0 = {V }, E = ∅ while Π is not saturated do for A ∈ Π in parallel do if A is not saturated then [Π, E] ← split (Π, E, A) E′ ← E for {A, B} ∈ E′ do if {A, B} ∈ E then [Π, E] ← merge_resplit (Π, E, A, B)
We now prove the local optimality of the solution provided the following assumption: P • (A4) the solution of minz∈R i∈B fi (h) exists and is unique for any B ⊂ V .
Proposition 7. If assumptions (A0) and (A4) are verified, then the ℓ0 cut pursuit algorithm provides in a finite number of iterations a partition Π = (A1 , · · · , An ) such . that xΠ = arg minz∈span(Π) Q(z) is a local minimum of Q. Proof. Assumption (A4) and the fact that f is separable ensure that P xΠ can be minimized separately over each connected component: xAi = arg minz i∈Ai fi (z). We denote Πt the partition at iteration t, and xtΠ the associated solution. We first prove that the sequence Q(xtΠ ) is strictly decreasing. Indeed if the stopping criteria for the algorithm is not met, then there exists at least one component Aj which is not saturated, i.e.Psuch that there exists a binary partitions B ( Aj such that P P minh,h′ i∈B fi (h) + i∈B c fi (h′ ) + λw(B, B c ) < i∈Aj fi xAj . Consequently this component will be split in the next partition to yield a strict decrease of the objective function Q, at least equal to the one provided by the miminizing arguments (h, h′ ). Since the set of all partition is a finite set, the algorithm stops in a finite number of steps. We now prove that the partition Π attained when the algorithm stops is such that the corresponding variable xΠ is a local minima of Q. Let E be the set of pairs of adjacent components of Π. We can assume that xA 6= xB for any (A, B) ∈ E. If it is not the case we replace Π by the partition in which such components are merged, without changing xΠ . Consequently there exists δ > 0 such that |xA − xB | > δ for any (A, B) ∈ E. Let x′ be an element of the ball B centered on xΠ and of radius 31 δ such that Q(x′ ) ≤ Q(xΠ ). We can first recognize that since the values of xΠ associated to each
81
4. CUT PURSUIT: FAST ALGORITHMS TO LEARN PIECEWISE CONSTANT FUNCTIONS ON GENERAL WEIGHTED GRAPHS
connected component differs by at least δ, x′ cannot have two connected components of Π sharing a common value. Consequently the boundary length can only increase Γ(x′ ) ≥ Γ(xΠ ). If we first assume that Γ(x′ ) = Γ(xΠ ), then x′ must be piecewise constant with respect to Π, and be such that f (x′ ) ≤ f (xΠ ), which is contradictory with (A4) and the definition of xΠ . We must then assume that Γ(x′ ) > Γ(x), and since (A0) states that f is continuous, there exists a neighborhood of xΠ included in B such that xΠ is a local minima of Q.
4.4 4.4.1
Experiments Deblurring experiments with TV
(a) Original
(b) PSNR : 12.1
(c) PSNR : 20.1
(d) Original
(e) PSNR : 15.9
(f ) PSNR : 27.2
(g) Original
(h) PSNR : 23.3
(i) PSNR : 24.5
Figure 4.5: Benchmark on the deblurring task. Left column: original images, middle column: blurred images, right column: images retrieved by Cut Pursuit (CP)
To assess the performance in terms of speed of our working set algorithm for the total variation regularization, we compare it with several state-of-the-art algorithms on a deblurring task of the form presented in section 4.2.4. Specifically, given an image x, we compute y = Hx + ǫ, where H is a Gaussian blur matrix, and ǫ is some Gaussian additive noise, and we solve (4.1) with a total variation regularization based on the 8-neighborhood graph built on image pixels. We use three 512 × 512 images of increasing complexity to benchmark the algorithms: the Shepp-Logan phantom, a simulated
82
4.4 Experiments
example, and Lena, all displayed in Figure 4.5. For all images the standard deviation of the blur is set to 5 pixels.
Competing methods Preconditioned Generalized Forward Backward (PGFB). As a general baseline, we consider a recent preconditioned generalized forwardbackward splitting algorithm by Raguet and Landrieu (2015) whose prior non-preconditioned version was shown to outperform state-of-the art convex optimization on deblurring tasks in Raguet et al. (2013), including among others the algorithm of Chambolle and Pock (2011). Raguet and Landrieu (2015) demonstrate the advantages of the preconditioning strategy used over other adaptive metric approaches, such as the preconditioning proposed in Pock and Chambolle (2011) and the inertial acceleration developed in Lorenz and Pock (2014). Accelerated forward-backward with parametric max-flows (FB+). Since efficient algorithms that solve the ROF problem have been the focus of recent work, and given that the ROF problem corresponds to the computation of the proximal operator of the total variation, we also compare with an implementation of the accelerated forwardbackward algorithm of Nesterov (2007). To compute the proximal operator, we use an efficient solver of the ROF problem based on a reformulation as a parametric max-flow proposed by Chambolle and Darbon (2009). The solver we use is the one made publicly available by the authors, which is based on a divide and conquer approach that works through the resolution of a parametric max-flow problem. This implies computing a sequence of max-flow problems, whose order make it possible to re-use the search trees in the Boykov et al. (2001b) algorithm, thereby greatly speeding up computations. Cut Pursuit with Frank-Wolfe descent direction (CPFW). We consider an alternative to the steepest binary partition to split the existing components of the partial solution: Inspired by the conditional gradient algorithm for regularized problems proposed by Harchaoui et al. (2014), consider a variant of Cut Pursuit in which we replace the steepest binary cut by the cut (B, B c ) such that 1B is the Frank-Wolfe direction for the total variation, i.e. minimizing w(B, B c )−1 h∇f (x), 1B i (see the discussion at the end of Section 4.2.1 and Appendix C). Note that the corresponding minimization of a ratio of combinatorial functions can in this setting be done efficiently using a slight modification of the algorithm of Dinkelbach (1967). See Appendix C for more details. We chose not to make direct comparisons with the algorithms of Harchaoui et al. (2014) and of Bach (2013, Chap. 7.12), since it is clear that these algorithms will be outperformed by CPFW. Indeed, these algorithms include a single term of the form 1A in the expansion of x at each iteration, while CP and CPFW grow much faster the subspace in which x is sought (its dimension typically more than doubles at each iteration). This entails that these algorithms must be slower than CPFW, because for the former and for the latter, a single iteration requires to compute a Frank-Wolfe step, which requires solving several graph-cuts on the whole graph, and, as we discuss in Section 4.4.1 and illustrate in Figure 4.7, the cost of graph cuts already dominates the per iteration cost of CP and CPFW. Cut Pursuit. To implement our algorithm (CP), we solve min-cut problems using
83
4. CUT PURSUIT: FAST ALGORITHMS TO LEARN PIECEWISE CONSTANT FUNCTIONS ON GENERAL WEIGHTED GRAPHS
the Kohli and Torr (2005) solver, which itself is based on Boykov et al. (2001b) and Kolmogorov and Zabih (2004). The problems on the reduced graph are solved using the PGFB algorithm. This last choice is motivated by the fact that the preconditioning is quite useful as it compensates for the fact that the weights on the reduced graph can be quite imbalanced.
10−1
10−2
10−2
Qt /Q∞ −1
Qt /Q∞ −1
10−1
10−3
10−3
10−4
10−4
10−5 0
5
10
15
20
25
30
35
time
10−5
0
5
10
15
20
25
30
35
time
10−1
Qt /Q∞ −1
FB+ PGFB CP CPFW
10−2
10−3
0
10
20
30
40
50
time
Figure 4.6: Relative primal suboptimality gap Qt /Q∞ − 1 at time t (in seconds) for different algorithms on the deblurring task: accelerated forward backward (FB+), Preconditonned Generalized Forward Backward (PGFB), Cut pursuit (CP) and a variant using Frank-Wolfe directions (CPFW), and for different 512 × 512 images and different regularization values: Shepp-Logan phantom (left), our simulated example (middle) and Lena (right). The marks in (FB+), (CP) and (CPFW) corresponds to one iteration.
Results Figure 4.6 presents the convergence speed of the different approaches on the three test images on a quad-core CPU at 2.4 Ghz. Precisely, we represent the relative primal suboptimality gap (Qt −Q∞ )/Q∞ where Q∞ is the lowest value obtained by CP in 100 seconds. We can see that our algorithm significantly speeds up the
84
4.4 Experiments
direct optimization approach PGFB when the solution is sparse, and that it remains competitive in the case of a natural image with strong regularization. Indeed since the reduced problems are of a much smaller size than the original, our algorithm can perform many more forward-backward iterations in the same allotted time. The variant of Cut Pursuit using Frank-Wolfe directions (CPFW) is as efficient over the first few iterations but then stagnates. The issue is that the computation of a new Frank-Wolfe direction does not take into account the current support S(x) which provides a set of edges that are “free”; this means that the algorithm overestimates the cost of adding new boundaries, resulting in overly-conservative updates. Accelerated forward-backward with parametric max-flow (FB+) is also slower than the Cut Pursuit approach in this setting. This can be explained by the fact that the calls to max-flow algorithms, represented by a mark on the curve, are better exploited in the cut pursuit setting. Indeed in the forward-backward algorithm, the solutions of parametric max-flow problems are exploited by performing one (accelerated) proximal gradient step. By contrast, in the Cut Pursuit setting, the solution of each max-flow problem is used to optimize the reduced problem. Since the reduced graph is typically much smaller than the original, a precise solution can generally be obtained very quickly, yet resulting in significant decrease in the objective function. Furthermore, as the graph is split into smaller and smaller independent connected components by Cut Pursuit, the calls to the max-flow solver of Boykov et al. (2001b) are increasingly efficient because the augmenting paths search trees are prevented from growing too wide, which is the main source of computational effort. Figure 4.7 presents the breakdown of computation time for each algorithm over 60 seconds of computation. In PGFB, the forward-backward updates naturally dominate the computation time, as well as the fast Fourier transform needed to compute the gradient at each iteration. In FB+, the computation of the proximal operator of the partial solution through parametric maximum flows is by far the costliest. Our approach and CPFW share a similar breakdown of computation time as their structures are similar. The maximum flow represents the highest cost, with the fast Fourier transform needed to compute K ⊺ H ⊺ HK a close second. Finally diverse operations such as computing the reduced graph takes a small fraction of the time. More interestingly, solving the reduced problem (with the PGFB subroutine of CP) takes comparatively very little time (roughly 3%) when this is the only step that actually decreases the objective function. This is expected as, even at the last iteration, the reduced graph had only 300 components so that the associated problem is solved very rapidly.
Approximate regularization path We now present the computation of an approximate regularization path for the ROF minimization, using warm-starts as described in Section 4.2.6. We consider the task of ROF-denoising on three natural images presented in Figure 4.9. For each image we pick 20 values of λ evenly distributed logarithmically in the range of parameters inducing from coarse to perfect reconstructions.
85
4. CUT PURSUIT: FAST ALGORITHMS TO LEARN PIECEWISE CONSTANT FUNCTIONS ON GENERAL WEIGHTED GRAPHS
100% 80% 60% 40% 20% 0%
PGFB
FB+
CP
CPFW
FFT Forward-Backward Maxflow Other Figure 4.7: Time breakdown for the different algorithms over 60 seconds of optimization.
Competing methods Parametric max-flows (PMF). We use the parametric max-flow based ROF solver of Chambolle and Darbon (2009) to compute each value. In our numerical experiments, it was the fastest of all available solvers, and moreover returns an exact solution. Cut Pursuit (CP). We use the algorithm presented in this chapter to separately compute the solutions for each parameter value. The algorithm stops when it reaches a relative primal suboptimality gap Qt /Q∞ −1 of 10−5 , with Q∞ the exact solution given by PMF. Cut Pursuit Path (CPP). We use the warm start approach proposed in Section 4.2.6, with the same stopping criterion.
Results We report in Figure 4.9 the time in seconds necessary to reach a primal suboptimality gap of 10−5 for the different approaches. We observe that, in general, cut pursuit (CP) is slightly faster than the parametric max-flow. It should be noted, however, that the latter finds an exact solution and remains from that point of view superior. Warm starts allow for a significant acceleration, needing at most two calls to the max-flow code to reach the desired gap. Unlike the deblurring task, for high noise levels, Cut Pursuit remains here very competitive for natural images which are not sparse, as illustrated in Table 4.10 and Figure. 4.8. As the regularization strength decreases, the coarseness of the solution decreases, and as a consequence the Cut Pursuit approaches CP and CPP become less and less efficient. This is because as the number of components increases, so does the time needed to solve the reduced problem. We note however that for the values provided with the peak PSNR, the warm-start approach is faster than PMF.
86
4.4 Experiments
Original PSNR:
λ = 3.16 20.0
λ = 1.62 24.6
λ = 0.83 29.2
λ = .43 31.3
λ = .25 29.4
Noisy 11.7
Original PSNR:
λ = 0.79 23.2
λ = .55 24.5
λ = .38 25.6
λ = .27 26.2
λ = .20 25.1
Noisy 11.4
Original PSNR:
λ = 0.79 22.7
λ = .55 23.4
λ = .38 23.9
λ = .27 23.7
λ = .20 22.0
Noisy 10.6
Figure 4.8: Illustration of the regularization path for the three images in the data set for 5 of the 20 values in the regularization parameters in the path. The peak PSNR is reached for λ = 0.53, 0.28 and 0.34 respectively.
PMF and CP perform significantly worse on sparse images and for high values of λ. This can be explained by the inner workings of the max-flow algorithm of Boykov et al. (2001b). Indeed for high values of λ or sparse images, the pairwise term of the corresponding Potts model will dominate, which forces the algorithm to build deep search trees to find augmenting paths. Indeed as the size of the regions formed by the cut increase, the combinatorial exploration of all possible augmenting paths drastically increases as well. The warm-started path approach does not suffer from this problem because the graph is already split in smaller components at the warm-start initialization, which prevents the search trees from growing too large.
4.4.2
Experiments on minimal partitions
Denoising experiment We now present experiments empirically demonstrating the superior performance of the ℓ0 -Cut pursuit algorithm presented in section 4.3. We assess its performance against two state-of-the art algorithms to minimize the problem regularized by the total boundary size for two noisy 512 × 512 images: the Shepp-Logan phantom (Shepp and Logan, 1974) and another simulated example. In order to illustrate the advantage of our algorithm over alternatives which discretize the value range, we add a small random shift of grey values to both images. We also test the algorithms
87
30
6
20
4
time (in s)
time (in s)
4. CUT PURSUIT: FAST ALGORITHMS TO LEARN PIECEWISE CONSTANT FUNCTIONS ON GENERAL WEIGHTED GRAPHS
10
0 100.5
100
10−0.6
λ
2
0 10−0.1
10−0.4
10−0.7
λ
time (in s)
8
CP CPP PMF peak PSNR
6
4
2
0 10−0.1
10−0.4
10−0.7
λ
Figure 4.9: Time in seconds necessary to solve the problem regularized with a given λ (from the warm-start initialization when applicable) with a relative primal suboptimality gap of 10−5 , for regularly sampled values of λ along the regularization path. The competing methods are Cut Pursuit (CP), Cut Pursuit with warm start (CPP) and the parametric max-flow solver (PMF) for different 512 × 512 noisy images: simulated example (left), Lena (middle) and eagle (right). The computation times are averaged over 10 random degradations of the images by uniform noise. The blue arrow indicates the best PSNR value.
on a spatial statistic aggregation problem using open-source data1 which consists of computing the statistically most faithful simplified map of the population density in the Paris area over a regular grid represented in Figure 4.12. The raster is triangulated to obtain a graph with 252, 183 nodes and 378, 258 edges. We use the squared loss weighted by the surface of each triangle as a fidelity term.
Competing methods α-expansions on quantized models (CRFi). If the range of values of xi is quantized, the MPP and TV problems reduce to a Potts model, 1
https://www.data.gouv.fr/fr/datasets/donnees-carroyees-a-200m-sur-la-population
88
4.4 Experiments
Method CPP CP PMF
Simulated 59 194 356
Lena 25 62 67
Eagle 27 70 91
Figure 4.10: Time in seconds necessary to compute the entire approximate regularization path at a relative primal suboptimality gap of 10−5 for the different algorithms, averaged over 10 samplings of the noise.
in which each class c is associated with a (non necessarily connected) level-set (Ishikawa, 2003). In the MPP case, the pairwise terms are of the form 1{ci 6=cj } wij . We use αexpansions (Boykov et al., 2001b) to approximately minimize the corresponding energy. More precisely, we use the α-expansions implementation of Fulkerson et al. (2009), which uses the same max-flow code (Boykov and Kolmogorov, 2004) as our algorithm. We denote the resulting algorithm CRFi where i is the number of levels of quantization of the observed image value range. While this algorithm is not theoretically guaranteed to converge, it does in practice and the local minima are shown by Boykov et al. (2001b) to be within a multiplicative constant of the global optimum. Non-convex relaxation (TV0.5 ). We implemented a non-convex analog of the total variation, inspired by Nikolova et al. (2010) and the adaptive Lasso of Zou (2006), with 1 t 7→ (ǫ + t) 2 in lieu of t 7→ |t|. The resulting functional can be minimized locally using a reweighted TV scheme described in Ochs et al. (2015). We use our Cut Pursuit algorithm to solve each reweighted TV problem as it is the fastest implementation. ℓ0 -Cut Pursuit We implemented three versions of ℓ0 cut pursuit with different backward steps. In the simplest instantiation, ℓ0 -CPf, no backward step is used and the reduced graph can only increase in size. In ℓ0 -CPm, described in Algorithm 4, the simple merge step is performed after each round of cuts. Finally in ℓ0 -CPs, described in Algorithm 5, merge steps are replaced by merge-resplit steps but without priority queue. After a few preliminary experiments, we chose not to include either level-set methods (Chan and Vese, 2001) or active contour methods based on solving Euler-Lagrange equations (Kass et al., 1988) as their performances were much lower than the algorithms we consider. Comparing speed results of code is always delicate as the degree of code optimization varies from one implementation to another. The α-expansion code uses the implementation of Fulkerson et al. (2009) which is a highly optimized code, ℓ0 -CPf and ℓ0 -CPm are implemented in C++, while ℓ0 -CPs and TV0.5 are implemented in Matlab with a heavy use of mex-files. Even if minor improvements could be obtained on the latter, we believe that it would not change the performances significantly. In particular, a justification for direct time comparisons here is that computation time for each of the algorithms is mostly spent computing min cuts which is done in all codes using the same implementation of Boykov and Kolmogorov (2004) and which accounts for most of the computation time.
89
4. CUT PURSUIT: FAST ALGORITHMS TO LEARN PIECEWISE CONSTANT FUNCTIONS ON GENERAL WEIGHTED GRAPHS
Results Given that the MPP is hard, and that all the algorithms we consider only find local minima, we compare the different algorithms both in terms of running time and in terms of the objective value of the local minima found. The marks on the curves correspond to one iteration of each of the considered algorithms: For TV0.5 there is a mark for each reweighted TV problem to solve, for CRFk, a mark corresponds to one α-expansion step, i.e. solving k max-flow problems. For ℓ0 -CP this corresponds to one forward (split) and one backward step. For clarity, the large number of marks were omitted in the third experiment, as well as for ℓ0 -CPs in the first experiment. In Figure 4.11, we report the energy obtained by the different algorithms normalized by the energy of the best constant approximation. We can see that our algorithms find local optima that are essentially as good or better than α-expansions for the discretized problems in less time, as long as the solutions are sufficiently sparse. For the population density data, the implementation ℓ0 -CPm with simple merge is faster and finds a better local minimum than CRF40, but is outperformed by CRF60. The implementation with swaps merge-resplit (ℓ0 -CPs) is on par with CRF60 when it comes to speed, and finds a slightly better minimum. The simple merge step provides with a better solution than the purely forward approach at the cost of a slight increase in computational time. The merge-resplit backward step improves the quality of the solution further, but comes with a significant increase in computation. In Figure 4.14, we report the performance of approximations with CRFs solved with iterative α-expansions for different numbers of quantization levels, as compared to the performance of ℓ0 -CPm. We observe that although CRFs can outperform ℓ0 -CPm in terms of quality of the local minima found for some of the higher numbers of quantization levels, the performances are very unstable with respect to this number. The fact that ℓ0 CP does not rely on an a priori quantized level leads to overall good performance, with significantly faster computation times. Plotting the corresponding PSNR shows that the smaller local minima of the objective found correlates well with gain in PSNR. It is interesting to note however that small improvements of the objective, which could be assessed as negligible, can yield unexpectedly high improvements in PSNR, as illustrated in Table 4.13.
90
4.4 Experiments
0.086
CRF15 CRF30
0.512
CRF15 CRF30 0.085
Qt /Q0
Qt /Q0
0.51
0.508
0.084
0.506 0.083
0.504
0
5
10
15
0.082
20
time (in s)
0
2
4
6
8
10
12
time (in s)
0.28
CRF40 CRF60
Qt /Q0
0.275
TV0.5 ℓ0 -CPf ℓ0 -CPm ℓ0 -CPs
0.27
0.265
0.26
0.255
0
5
10
15
20
25
time (in s)
Figure 4.11: Mumford-Shah energy at time t (in seconds) divided by the same energy for the best constant approximation obtained by different algorithms: Non-convex relaxation (TV0.5 ), ℓ0 -CPf with no backward step, ℓ0 -CPm with simple merge step, ℓ0 -CPs with merge-resplit steps, and finally, α-expansions with different number of levels of quantization (see image legends), for different images: the Shepp-Logan phantom (left), our simulated example (middle) and the map simplification problem (right). Markers correspond respectively to one reweighting, one α-expansion cycle and one cut for (TV0.5 ), (CRF) and (ℓ0 -CP).
91
14
4. CUT PURSUIT: FAST ALGORITHMS TO LEARN PIECEWISE CONSTANT FUNCTIONS ON GENERAL WEIGHTED GRAPHS
(a) PSNR : 24.8
(b) PSNR : 38.1
(c) PSNR : 18.8
(d) PSNR : 34.8
(e) Population density of Paris
(f ) Simplified map
Figure 4.12: Benchmark on the denoising task. First two lines: (left) noisy images, (right) images retrieved by Cut Pursuit (CP). Last line: (left) rasterized population density of Paris area, (right) simplified map obtained by ℓ0 -Cut Pursuit with simple merge steps (ℓ0 -CPm): 69% of variance explained with 1.2% of contours length.
Experiment Algorithm Noisy image ℓ0 -CP CRF15 CRF30 T V0.5
Phantom PSNR time 16.8 33.5 4.3 32.6 8.6 33.3 25.3 32.2 16.4
Simulated PSNR time 16.8 37.0 4.6 34.2 4.0 34.8 11.4 33.6 18.0
Figure 4.13: PSNR at convergence and time to converge in seconds for the four algorithms as well as the noisy image for the first two denoising experiments.
92
4.4 Experiments
35
0.28
30
0.26
0.25
0
10
20 # classes
30
0
40
convergence time
0.145 0.14
0.135 0.13
0.125 0
10
20 # classes
30
40
25
20
0
10
20 # classes
30
15
40
10
20 # classes
30
40
10
20 # classes
30
40
35
15
10
5
0
0
40
20
0.15
Qt /Q0
10
PSNR
0.24
30 20
PSNR
convergence time
Qt /Q0
0.27
30 25 20
0
10
20 # classes
CRF
30
ℓ0 -CPM
40
15
0
noisy image
Figure 4.14: Behavior of the CRF algorithm for different number of quantization levels for the phantom (top) and the simulated data (bottom) averaged on 10 denoising experiments: (left) ratio between the energy Q at convergence and the energy at time 0, (middle) running time, (right) corresponding PSNRs. The two algorithms represented are α-expansions (CRF) for a varying number of quantization levels and ℓ0 -CPM.
93
4. CUT PURSUIT: FAST ALGORITHMS TO LEARN PIECEWISE CONSTANT FUNCTIONS ON GENERAL WEIGHTED GRAPHS
4.5
Conclusion
We proposed two algorithms to minimize functions penalized respectively by the total variation and by the Mumford-Shah boundary size. They computationally exploit the fact that for sufficiently large regularization coefficients, the solution is typically piecewise constant with a small number of pieces, corresponding to a coarse partition. This is a consequence of the fact that, in the discrete setting, both the total variation and the Mumford-Shah boundary size penalize the size of the support of the gradient: indeed, functions with sparse gradients tend to have a small number of distinct level sets which are moreover connected. The sparsity that is optimized is thus not exactly the same as the sparsity which is exploited computationally, although both are related. By constructing a sequence of approximate solutions that are themselves piecewise constant with a small number of pieces, the proposed algorithms operate on reduced problems that can be solved efficiently, and perform only graph cuts on the original graph, which are thus the remaining bottleneck for further speed-ups. Like all workingset algorithms, the cut pursuit variants are not competitive if the solution has too many connected level-sets. In the convex case, cut pursuit outperforms all proximal methods for deblurring images with simple solutions. For denoising with a ROF energy, it outperforms the parametric maxflow approach when computing sequences of solutions for different regularization strengths. In the ℓ0 case, our algorithm can find a better solution in a shorter time than the non-convex continuous relaxation approach as well as the approach based on α-expansions. Furthermore, while the performance of the latter hinges critically on setting an appropriate number of level-sets in advance, cut pursuit needs no such parametrization. Future developments will consider the case of Lovász extensions of other symmetric submodular functions (Bach, 2011) and to the multivariate case. It would also be interesting to determine the conditions under which the alternating scheme presented in 4.3.1 provides a globally optimal solution of (4.8), as it would be a necessary step in order to prove approximation guarantees to the solution of ℓ0 -cut pursuit itself.
94
Bibliography Aubert, G., Barlaud, M., Faugeras, O., and Jehan-Besson, S. (2003). Image segmentation using active contours: calculus of variations or shape gradients? SIAM Journal on Applied Mathematics, 63(6):2128–2154. 63 Bach, F. (2013). Learning with submodular functions: a convex optimization perspective. Foundations and Trends in Machine Learning, 6(2-3):145–373. 61, 64, 65, 68, 83 Bach, F., Jenatton, R., Mairal, J., and Obozinski, G. (2012). Optimization with sparsity-inducing penalties. Foundations and Trends in Machine Learning, 4(1):1– 106. 60, 65 Bach, F. R. (2011). Shaping level sets with submodular functions. In Advances in Neural Information Processing Systems, pages 10–18. 64, 94 Bellman, R. (1973). A note on cluster analysis and dynamic programming. Mathematical Biosciences, 18(3):311–312. 79 Bleakley, K. and Vert, J.-P. (2011). The group fused Lasso for multiple change-point detection. arXiv preprint arXiv:1106.4199. 74 Boykov, Y. and Kolmogorov, V. (2004). An experimental comparison of min-cut/maxflow algorithms for energy minimization in vision. IEEE Transactions on Pattern Analysis and Machine Intelligence, 26(9):1124–1137. 64, 89 Boykov, Y., Veksler, O., and Zabih, R. (2001a). Efficient approximate energy minimization via graph cuts. IEEE Transactions on Pattern Analysis and Machine Intelligence, 20(12):1222–1239. 72 Boykov, Y., Veksler, O., and Zabih, R. (2001b). Fast approximate energy minimization via graph cuts. IEEE Transactions on Pattern Analysis and Machine Intelligence, 23(11):1222–1239. 64, 78, 83, 84, 85, 87, 89 Bresson, X., Esedo¯glu, S., Vandergheynst, P., Thiran, J.-P., and Osher, S. (2007). Fast global minimization of the active contour/snake model. Journal of Mathematical Imaging and Vision, 28(2):151–167. 76
95
BIBLIOGRAPHY
Chambolle, A., Caselles, V., Cremers, D., Novaga, M., and Pock, T. (2010). An introduction to total variation for image analysis. In Theoretical foundations and numerical methods for sparse recovery, pages 263–340. De Gruyter. 63 Chambolle, A. and Darbon, J. (2009). On total variation minimization and surface evolution using parametric maximum flows. International Journal of Computer Vision, 84(3):288–307. 60, 61, 64, 83, 86 Chambolle, A. and Pock, T. (2011). A first-order primal-dual algorithm for convex problems with applications to imaging. Journal of Mathematical Imaging and Vision, 40(1):120–145. 64, 74, 83 Chan, T., Esedo¯glu, S., Park, F., and Yip, A. (2005). Recent developments in total variation image restoration. In Mathematical Models of Computer Vision, pages 17– 31. Springer Verlag. 72 Chan, T. F. and Vese, L. A. (2001). Active contours without edges. IEEE Transactions on Image Processing, 10(2):266–277. 63, 89 Chandrasekaran, V., Recht, B., Parrilo, P. A., and Willsky, A. S. (2012). The convex geometry of linear inverse problems. Foundations of Computational mathematics, 12(6):805–849. 62, 68 Chen, S., Cowan, C. F., and Grant, P. M. (1991). Orthogonal least squares learning algorithm for radial basis function networks. IEEE Transactions on Neural Networks, 2(2):302–309. 65 Dinkelbach, W. (1967). On nonlinear fractional programming. Management Science, 13(7):492–498. 83 Efron, B., Hastie, T., Johnstone, I., Tibshirani, R., et al. (2004). Least angle regression. The Annals of statistics, 32(2):407–499. 64, 73, 74 Efroymson, M. (1960). Multiple regression analysis. Mathematical methods for digital computers, 1:191–203. 75 El-Zehiry, N. and Grady, L. (2011). Discrete optimization of the multiphase piecewise constant Mumford-Shah functional. In Energy Minimization Methods in Computer Vision and Pattern Recognition, pages 233–246. Springer. 60, 63 El-Zehiry, N., Sahoo, P., and Elmaghraby, A. (2011). Combinatorial optimization of the piecewise constant Mumford-Shah functional with application to scalar/vector valued and volumetric image segmentation. Image and Vision Computing, 29(6):365–381. 76 El-Zehiry, N. Y. and Elmaghraby, A. (2007). Brain MRI tissue classification using graph cut optimization of the Mumford–Shah functional. In Proceedings of the International Vision Conference of New Zealand, pages 321–326. 59, 63
96
BIBLIOGRAPHY
Friedman, J., Hastie, T., and Tibshirani, R. (2010). Regularization paths for generalized linear models via coordinate descent. Journal of Statistical Software, 33(1):1–22. 64 Fulkerson, B., Vedaldi, A., and Soatto, S. (2009). Class segmentation and object localization with superpixel neighborhoods. In Proceedings of the International Conference on Computer Vision, pages 670–677. IEEE. 89 Geman, D. and Reynolds, G. (1992). Constrained restoration and the recovery of discontinuities. IEEE Transactions on Pattern Analysis & Machine Intelligence, (3):367– 383. 61 Goldfarb, D. and Yin, W. (2009). Parametric maximum flow algorithms for fast total variation minimization. SIAM Journal on Scientific Computing, 31(5):3712–3743. 60, 64 Harchaoui, Z., Juditsky, A., and Nemirovski, A. (2014). Conditional gradient algorithms for norm-regularized smooth convex optimization. Mathematical Programming, 152(1–2). 60, 64, 68, 83 Ishikawa, H. (2003). Exact optimization for Markov random fields with convex priors. IEEE Transactions on Pattern Analysis and Machine Intelligence, 25(10):1333–1336. 64, 89 Jaggi, M. (2013). Revisiting Frank-Wolfe: projection-free sparse convex optimization. In Proceedings of the 30th International Conference on Machine Learning, pages 427– 435. 64 Jegelka, S., Bach, F., and Sra, S. (2013). Reflection methods for user-friendly submodular optimization. In Advances in Neural Information Processing Systems, pages 1313–1321. 64 Kass, M., Witkin, A., and Terzopoulos, D. (1988). Snakes: Active contour models. International Journal of Computer Vision, 1(4):321–331. 63, 89 Kohli, P. and Torr, P. H. (2005). Efficiently solving dynamic Markov random fields using graph cuts. In International Conference on Computer Vision (ICCV), volume 2, pages 922–929. IEEE. 84 Kolmogorov, V. and Zabih, R. (2004). What energy functions can be minimized via graph cuts? IEEE Transactions on Pattern Analysis and Machine Intelligence, 26(2):147–159. 67, 84 Kormylo, J. J. and Mendel, J. M. (1982). Maximum likelihood detection and estimation of Bernoulli-Gaussian processes. IEEE Transactions on Information Theory, 28(3):482–488. 75 Kumar, K. and Bach, F. (2015). Active-set methods for submodular optimization. arXiv preprint arXiv:1506.02852. 61, 64
97
BIBLIOGRAPHY
Landrieu, L. and Obozinski, G. (2016a). Cut pursuit: fast algorithms to learn piecewise constant functions. In 19th International Conference on Artificial Intelligence and Statistics (AISTATS 2016). 59 Landrieu, L. and Obozinski, G. (2016b). Cut pursuit: fast algorithms to learn piecewise constant functions on general weighted graphs. 59 Lorenz, D. A. and Pock, T. (2014). An inertial forward-backward algorithm for monotone inclusions. Journal of Mathematical Imaging and Vision, 51(2):311–325. 83 Mallat, S. and Zhang, Z. (1992). Adaptive time-frequency decomposition with matching pursuits. In Time-Frequency and Time-Scale Analysis, Proceedings of the IEEE-SP International Symposium, pages 7–10. IEEE. 60, 65 Mumford, D. and Shah, J. (1989). Optimal approximations by piecewise smooth functions and associated variational problems. Communications on pure and applied mathematics, 42(5):577–685. 60, 62 Needell, D. and Tropp, J. A. (2009). CoSaMP: Iterative signal recovery from incomplete and inaccurate samples. Applied and Computational Harmonic Analysis, 26(3):301– 321. 60, 65 Negahban, S., Yu, B., Wainwright, M. J., and Ravikumar, P. K. (2009). A unified framework for high-dimensional analysis of m-estimators with decomposable regularizers. In Advances in Neural Information Processing Systems, pages 1348–1356. 68 Nesterov, Y. (2007). Gradient methods for minimizing composite objective function. Technical report, Université catholique de Louvain, Center for Operations Research and Econometrics (CORE). 83 Nielsen, F. and Nock, R. (2014). Optimal interval clustering: Application to Bregman clustering and statistical mixture learning. Signal Processing Letters, 21(10):1289– 1292. 79 Nikolova, M., Ng, M. K., and Tam, C.-P. (2010). Fast nonconvex nonsmooth minimization methods for image restoration and reconstruction. IEEE Transactions on Image Processing, 19(12):3073–3088. 89 Obozinski, G., Taskar, B., and Jordan, M. (2006). Multi-task feature selection. Statistics Department, UC Berkeley, Tech. Rep. 64, 74 Ochs, P., Dosovitskiy, A., Brox, T., and Pock, T. (2015). On iteratively reweighted algorithms for nonsmooth nonconvex optimization in computer vision. SIAM Journal on Imaging Sciences, 8(1):331–372. 89 Osher, S. and Sethian, J. A. (1988). Fronts propagating with curvature-dependent speed: algorithms based on Hamilton-Jacobi formulations. Journal of Computational Physics, 79(1):12–49. 64
98
BIBLIOGRAPHY
Picard, J.-C. and Ratliff, H. D. (1975). Minimum cuts and related problems. Networks, 5(4):357–370. 64, 66, 67 Pock, T. and Chambolle, A. (2011). Diagonal preconditioning for first order primal-dual algorithms in convex optimization. In Proceeding of the International Conference on Computer Vision (ICCV), pages 1762–1769. IEEE. 83 Raguet, H., Fadili, J., and Peyré, G. (2013). A generalized forward-backward splitting. SIAM Journal on Imaging Sciences, 6(3):1199–1226. 64, 74, 83 Raguet, H. and Landrieu, L. (2015). Preconditioning of a generalized forward-backward splitting and application to optimization on graphs. SIAM Journal on Imaging Sciences, 8(4):2706–2739. 73, 83 Rockafellar, R. T. (1970). Convex analysis. Princeton University Press. 68 Roth, V. and Fischer, B. (2008). The group-lasso for generalized linear models: uniqueness of solutions and efficient algorithms. In Proceedings of the 25th international conference on Machine learning, pages 848–855. ACM. 64, 74 Rudin, L. I., Osher, S., and Fatemi, E. (1992). Nonlinear total variation based noise removal algorithms. Physica D: Nonlinear Phenomena, 60:259 – 268. 60, 63 Santner, J., Pock, T., and Bischof, H. (2011). Interactive multi-label segmentation. pages 397–410. Springer. 63 Shepp, L. A. and Logan, B. F. (1974). The Fourier reconstruction of a head section. IEEE Transactions on Nuclear Science, 21(3):21–43. 87 Soussen, C., Idier, J., Brie, D., and Duan, J. (2011). From Bernoulli–Gaussian deconvolution to sparse signal restoration. IEEE Transactions on Signal Processing, 59(10):4572–4584. 65, 75, 77 Szeliski, R., Zabih, R., Scharstein, D., Veksler, O., Kolmogorov, V., Agarwala, A., Tappen, M., and Rother, C. (2006). A comparative study of energy minimization methods for Markov random fields. In Proceeding of the European Conference in Computer Vision (ECCV), pages 16–29. Springer. 64 Tsai, Y.-H. R. and Osher, S. (2005). Total variation and level set methods in image science. Acta Numerica, 14:509–573. 64 Vese, L. A. and Chan, T. F. (2002). A multiphase level set framework for image segmentation using the Mumford and Shah model. International Journal of Computer Vision, 50(3):271–293. 63 Wang, Y.-X., Sharpnack, J., Smola, A., and Tibshirani, R. J. (2014). Trend filtering on graphs. arXiv preprint arXiv:1410.7690. To appear in JMLR. 60
99
BIBLIOGRAPHY
Zhang, T. (2009). Adaptive forward-backward greedy algorithm for sparse learning with linear models. In Advances in Neural Information Processing Systems, pages 1921–1928. 60, 65, 78 Zou, H. (2006). The adaptive lasso and its oracle properties. Journal of the American Statistical Association, 101(476):1418–1429. 89
100
Chapter 5
Learning in graphical models Chapter Abstract In this chapter we present an overview of the framework of graphical models, introducing the theoretical foundations used in the next chapter. We highlight the links that exist between conditional independance in a set of random variables and the factorization of its probability density function over a graph structure. We present as well the framework of exponential families. We review how probabilistic inference and learning can be performed in two particular graphical models, namely Potts model and the continuous time Markov chain. This chapter does not present original work, it serves however as an introduction and motivation for the continuously indexed Pott’s model presented in the next chapter. This chapter refers extensively the very comprehensive book Graphical models, exponential families, and variational inference by Wainwright and Jordan (2008).
5.1
Introduction
Graphical models are a powerful framework used to model interactions between random variables with graphs. They boast applications across numerous fields, such as bioinformatics, computer vision, and speech and natural language processing. In the general setting, when considering a set of random variables one must assume that the conditional probability distribution of each variable involves the realization of all other variables. In the simplest case where each variable has a Bernoulli marginal distribution, this would involve an exponential number of configurations for each variable. For any real life application with millions of nodes, a naive parameterization of such distributions appears unreasonable. However in many cases, the direct influence of a random variable is sparse in the sense that its realization only influences the conditional probabilities of a limited number of other random variables. Markov chains are a prime example of such sparse influence, as the conditional distribution of variable at time t is solely determined by the realization at t − 1. We can create a graphical model for any given collection of variables by assigning
101
5. LEARNING IN GRAPHICAL MODELS
nodes to represent random variables, with the edges between nodes encoding the direct influence of the corresponding variables. The goal of graphical models is to represent models in a compact form by exploiting that the joint distribution of the variables can be represented in a simplified form. This framework allows us to use graph-based algorithms like message passing schemes to solve queries on the models, such as marginal inference or parameters learning. Graphical models also blend well with exponential families. This latter class of models has great expressive power and has been wellstudied, and also makes it possible to cast queries on the distribution as optimization problems. In this chapter we study two graphical models in more detail : the Potts model, a special case of unoriented discrete state Markov random field, and the directed continuous time Markov Chain, as well as the extension of the latter to trees.
5.2 5.2.1
Undirected graphical models Conditional independence
We are interested in modelling the behavior of a multivariate random variable X = {X1 , · · · , Xn } with Xi ∈ X for all i. Realizations of the random variable Xi are denoted by xi ∈ X. For a realization x = {x1 , · · · xn } ∈ Xn we denote p(x1 , · · · xn ) = P (X1 = x1 , · · · , Xn = xn ) its probability. For A ⊂ V a subsets of nodes we denote XA the corresponding multivariate random variables and xA a realization. The notion of influence between nodes is more rigourously formalized with the notion of conditional independence, which extends the traditional notion of random variable independance to the conditional setting. For A, B and C, three subsets of nodes, we say that the two random variables XA and XB are independent given Xc if p(xA , xB | xC ) = p(xA | xC ) p(xB | xC ), or equivalently, with Bayes rule: p(xA | xB , xC ) = p(xA | xC ). The random variables X = {X1 , · · · , Xn } may have a complex dependance structure, in which the realization of certain variables influences the conditional probability distibution of others. We denote G = (V, E) the graph formalizing the structure of dependency between those random variables with V = {1, · · · , n} the node set. The edge set E ⊂ V × V contains the edges (i, j) if and only if the conditional probability distribution of Xi given all other variables depends on the realization of Xj . Note that a simple appliaction of Bayes rule shows that this relationshipis symetrical, thus we take the edges of G to be unoriented. The graph G is constrcuted so that for i ∈ V we have: � p xi |xV \i = p (xi |xNi ) , with Ni the neighors of node i in graph G.
102
5.2 Undirected graphical models
In the unoriented setting the conditional independance of two variables given a set of other variables can be deduced directly from graph G with the notion of separation in graph-theory: a node subset A is said to be separated from a node subset B by a a node subset C if and only if every path from A to B go through a C. The chain rule of probability allows to see the equivalence between separation of A and B and the conditonal independance of XA and XB given XC . It is important to note that in the oriented setting the naive notion of separation is neither necessary nor sufficient to insure conditional independance. It is however the case if G is supposed to be oriented but also tree-shaped, provided there are no v-structure. We refer the reader to Wainwright and Jordan (2008) for more details.
5.2.2
Factorization
A set of nodes c ⊂ V is called a clique if all pairs of nodes of c are connected by an edge in G. We denote C(G) the sets of maximal cliques of graph G, i.e. the set of cliques that are not contained within another clique. We say that the probability distribution of multivariate random variable X = {X1 , · · · , Xn } factorize on a graph G if its density function can be written as followed: Y ψc (xc ), (5.1) p(x1 , · · · xn ) ∝ c∈C(G)
where ψi : K 7→ R+ and ψi,j : K2 7→ R+ are called potential functions. Note that contrary to probability and conditional probability distributions, potential functions aren’t normalized, and the probability density function (5.1) needs to be normalized. A key result underpinning graphical models is the Hammersley–Clifford theorem (Hammersley and Clifford, 1971; Lafferty et al., 2001) which states that conditional independance and the factorization of the probability distribution over a graph are equivalent. This is the fundamental theorem of Graphical Models, linking probability and the graph-theoretic notion of separation. Theorem 1 (Hammersley–Clifford). Let X = {X1 , · · · , Xn } be a multivariate random variable such that its conditional independance structure is captured by G and p(x) > 0 for all x ∈ Xn . The probability distribution of X factorizes over G following equation 5.1.
5.2.3
Parameterization
Exponential families Many graphical models are naturally parametrized as member of an exponential family. A collection of distribution distribution is called an exponential family if the logarithm of the probability density function ℓ of all member can be written under the following form: ℓ(x; θ) = hb(θ), φ(x)i − A(θ). with respect to a base measure γ on x. The involved quantities are:
103
5. LEARNING IN GRAPHICAL MODELS
• φ(x) = [φ1 (x), · · · , φk (x)]⊺ ∈ RK the sufficient statistics vector. It is comprised of a collection of functions φi : ξ → 7 R encompassing the relevant statistics of x. • θ ∈ RK the canonical parameter vector, which weighs each sufficient statistic. • b(θ) are called the transformed parameters. When b is the identity, the family is called a flat exponential family, and a curved exponential family otherwise. • A(θ) : RK 7→ R+ is the log-partition function insuring that p defines indeed a probability. We denote Ω = {θ | A(θ) < ∞} the set of admissible parameters, called domain. A parameterization is said to be minimal if the sufficient statistics are linearly independent. A distribution in the exponential family defined by such φ and γ is uniquely defined by a vector of canonical parameter θ. This formulation is very general and includes, among many others, the following family of distributions: Bernoulli, binomial, normal, exponential, Poisson, gamma and beta.
Mean parameterization We define the mean parameter with respect to an arbitrary distribution density function p as: µp = Ep (φ(X)) =
Z
φ(x)p(x)dγ(x). Xn
The set of all achievable mean parameters plays an important role and is called the marginal polytope M: M = {µp | p ∈ P} , with P the set of all distributions over Xn . It is important to note that in the definition of M, p is not restricted to members of the exponential family defined by φ and γ. However we will show that in the case of a minimal representation there is a one-toone mapping between canonical parameters and mean parameters. Consequently an exponential family parametrized by θ can also be equivalently parameterized by the associated mean parameter µθ obtained for pθ the distribution parametrized by θ.
The log-partition function The normalization of distributions in an exponential family is ensured by the log-partition function A(θ): Z A(θ) = log exp hθ, φ(x)idγ(x). Xn
This function, although convex, is impractical to compute for most problems as one must integrate over all possible realizations of X, which is a combinatorial set. However in some circumstances it can be computed, either exactly or approximately, as we will expand upon in section 5.3.3. A key property of the log-partition function is the relation
104
5.2 Undirected graphical models
between its derivative with respect to the canonical parameters and the associated mean parameters: ∂A(θ) = µθ , (5.2) ∂θ where µθ is the mean parameter defined with respect to the distribution pθ associated with θ. This property constitutes a mapping from canonical parameters to mean parameters, and is very useful in a context of learning. An important result is that even if the representation is not minimal, this mapping from Ω to the interior of M is surjective, which means that any mean parameter µ within the interior of the marginal polytope can be obtained for the canonical parameter θ(µ).
Fenchel conjugate Since A(θ) is convex, we can define its Fenchel conjugate: A∗ (µ) = sup hµ, θi − A(θ).
(5.3)
θ∈Ω
We denote θ(µ) a minimizing argument of this optimization problem. Conversely we have A(θ) = sup hµ, θi − A∗ (µ), (5.4) µ∈M
and denote µ(θ) a maximizing parameter of this optimization problem. At the optimum we have ∇A∗ (µ(θ)) = θ. Consequently, it appears that ∇A∗ defines the reverse mapping from mean parameterization to canonical parameters. Finally an important result states that the conjugate of the log-partition function can be expressed with the entropy of the probability distribution: ( −H(pθ (µ)) if µ ∈ M◦ ⋆ A (µ) = ¯ +∞ if µ 6∈ M, ¯ is its closure. The value at at the frontier of M is where M◦ is the inetrior of M and M determined by the limit of a converging sequence. Denote that for X a finite set, M is a closed set.
5.2.4
Inference and learning
Inference Inference is the problem of predicting the value of a model given its parameters. Wa can distinguish between several forms of inference, such as Bayesian inference, which consists of estimating the likelihood of an hypothesis, or MAP -inference, which consists of finding the model’s value of highest probability. In this chapter we are interested in marginal inference, which consists of estimating the probability of a certain subsets of variables taking a particular value. For a single variable Xi this amounts to finding p(xi ) for xi ∈ X. Such marginal probabilities are in general hard to compute. There are however algorithms that perform either exact or approximate inference in specific settings, as we will illustrate for several models in the rest of the chapter.
105
5. LEARNING IN GRAPHICAL MODELS
Learning Given a model for observed data, learning can be reduced to the estimation of the fitting parameters. One of the main estimators is the the maximum likelihood estimator, which is the one we opt for in this manuscript. Note that this is not the only way that learning a model can be understood as there are alternatives such as Bayesian learning, which involves priors on the distribution and subsequent penalizations, risk minimization and many other approaches. However this is the point of view we chose for the rest of the chapter. From a set of independent observations {xt }Tt=1 of a random variable X, we define learning as finding the parameters θ which maximize the emission probability of the observed data. This is formalized by the maximization of the log-likelihood: ℓ({xt }Tt=1 ; θ)
=
T X
ℓ(xt ; θ),
(5.5)
t=1
with ℓ(xt ; θ) the log-likelihood associated with the model paramerized by θ given observation xt . Learning the model amounts to finding the optimal parameter: θˆ = arg max ℓ({xt }Tt=1 ; θ). θ∈Ω
5.3 5.3.1
Potts model Definition
The Potts model is a graphical model in which the variables take their value in a discrete, finite set, and in which the direct influence between variables is pairwise. In other words the conditional probability of a given variable is influenced by the realizations of other variables separately. This excludes conditional probabilities depending on the joint realizations of two or more other variables. Let X = (X1 , · · · , Xn ) ∈ Xn be a random variable whose distribution follows a Potts model with d states, meaning that each node can be one of d labels. Pd We parameterize the state of each node by the discrete simplex d X = {z ∈ {0, 1} | i=1 zi = 1}. A node i is in state k when xi is equal to the vector of size d with value 1 at index k and zeros elsewhere. We sometimes write for convenience xi = k in this case.
Factorization Let G = (V, E) be the graph which captures the dependency structure of X, as described in Section 5.2.1. As the model is pairwise, we can rewrite 5.1 as: Y 1 Y p(x1 , · · · xn ) = ψi (xi ) ψij (xi , xj ), (5.6) Z (∈V
(ij)∈E
with ψi : K 7→ R+ and ψij : K2 7→ R+ respectively the unary and binary potential functions.
106
5.3 Potts model
θi
node of G edge of G unary potential binary potential
i θij
j
Figure 5.1: Potts model obtained for undirected graph G with unary and binary potentials represented.
Parameterization From Equation 5.6 one can see a Potts model can naturally be parameterized as an exponential family. Furthermore, they comform to a particular parameterization called the standard overcomplete representation. Indeed as influence between variables is pairwise, the sufficient statistics for each variable are the realization vector xi ∈ X and the combined realization xi x⊺j ∈ X2 for nodes which are adjacent on the graph G. Hence the canonical parameters θ can be split into an unary parameter {θi }i∈V and pairwise parameter {θi,j }(i,j)∈E . The unary parameter θi ∈ RK associates a i,j value θki to the realization xi = k, and the binary parameter θ(i,j) ∈ RK×K associates θk,l to the joint realization xi = k and xj = l. The log-likelihood of such parameterization given realization x can be rewritten as follows: ℓ(x; θ) =
X
x⊺i θi +
i∈V
X
x⊺i θi,j xj − A(θ).
i,j∈E
Remark that as its name suggest, the standard overcomplete representation is not minimal as the sufficient statistics xi x⊺j , xi and xj are not independant. As detailed in Section 5.2.3 the mean parameter plays an important role as well. We define µiθ = ⊺ d×d . According to Equation 5.2 we have: Eθ (xi ) ∈ [0, 1]d and µi,j θ = Eθ (xi xj ) ∈ [0, 1] ∂A(θ) = µiθ ∂θi
5.3.2
and
∂A(θ) = µi,j θ ∂θi,j
Inference in Potts models
We consider the problem of finding the marginal probability in a Potts model. With the canonical parameterization, this is equivalent to finding the mean parameters: pθ (xi ) = Eθ (xi ) = µiθ
107
5. LEARNING IN GRAPHICAL MODELS
As stated in Section 5.2.4, the probabilistic inference problem is difficult in general. It is in fact NP-complete for Potts models. In this section we present several algorithms for exact and approximate inference.
5.3.3
Exact inference
Belief propagation on trees If G has a tree structure one can use a dynamic programming algorithm to efficiently organize the summation over an exponential number of terms involved in the computing of the marginals: X
pθ (xi ) =
pθ (y)
n
y ∈ X | yi = x i The algorithm is called belief propagation because it can be interpreted as messages going through each edge, carrying information about the partial tree structure which is obtained by removing the edge. More precisely the message Mi→j contains all necessary information about the subtree containing i obtained when removing (i, j) from E. The messages are defined as follows: Mj→i (xi ) ∝
X
ψij (xi , xj )ψ(xj )
xj
X
Mv→j (xj ),
v∈Nj \i
where Ni denotes the neighbors of i in G. This scheme, called collect and distribute, starts on leaves and is propagated to the root and back. Once the messages have converged, the marginals are obtained with the following equation: µiθ ∝ ψi (xi )
Y
Mj→i (xi )
j∈Ni
The junction tree algorithm The sum product algorithm can be generalized for exact inference on cyclic graphs with the junction tree algorithm. The first step of the algorithm is to compute the clique tree, whose nodes are the maximal cliques of G. The second step is a similar message passing scheme on the clique tree. This algorithm, although exact, has an exponential complexity with respect to the cardinal of the largest clique (treewidth) of the graph, hence is only used in specific graphical models whose junction tree has a know low treewidth.
5.3.4
Approximate inference
Although message passing algorithms provide exact marginals on trees in a reasonable time, this is not the case for general graphs. In practice, approximate inference is often used, as it allows us to find good approximate solutions faster.
108
5.3 Potts model
Sampling methods Gibbs sampling is the most straightforward way to obtain approximate values for the marginals. The idea is to obtain a set of realizations (samples) from which the marginals can be approximatively inferred. The samples are obtained by initializing a realization x0 randomly and iteratively updating xti for each node while the values of all other nodes are fixed. In other words, xti is sampled according to t−1 t−1 t−1 p(xi | xt−1 1 , · · · xi−1 , xi+1 , · · · , xn ). After a sufficient number of iterations the value obtained is considered a realization of the joint probability. Averaging over all obtained samples gives an approximation of the marginal distribution, which has been proved to converge to the real distribution for a high enough number of samples (Geman and Geman, 1984). In practice the first few samples are usually discarded following the burn in heuristic. The update can be done sequentially with each node (usually in a random order), but this process is often very long as many samples are needed to obtain. Parallel computations would be faster but the scheme would then not converge to the desired distribution. Gonzalez et al. (2011) proposes a parallel scheme in which the graph is colored so that no adjacent nodes share the same color. Then each color of the nodes is sequentially updated in parallel. This process allow for a consequent acceleration as well as provable convergence.
5.3.5
Loopy belief propagation
The sum-product algorithm detailed in the previous section has only be proved to provide an exact result on tree-shaped graphs. It has however been applied on general graphs with good empirical success. This heuristic was dubbed Loopy belief propagation due to the presence of cycles in the graphs considered. In this section we will see that although there is no theoretic guarantee to find the same result as the exact inference, the approximations made are well understood and convergence results have been obtained under restrictive conditions (Heskes, 2004; Tatikonda and Jordan, 2002; Weiss, 2000). Wainwright and Jordan (2008) have presented how this algorithm can be understood as the combination of two approximations.
The local polytope Even though the marginal polytope is convex, its structure can be very complex, with a number of facets growing exponentially in the number of nodes. The first approximation is using a surrogate polytope called local polytope L whose structure is simpler. For a marginal µ to be realizable, it must be consistent. The unary marginals µi must be probabilities: (P d i k=1 µk = 1 ∀i ∈ V (5.7) µik ≥ 0 ∀i ∈ V, ∀k = 1, · · · , d, and the binary marginals µij must be consistent with the unary marginals: d X
µi,j k,l
=
µil
and
k=1
d X l=1
109
i µi,j k,l = µk .
(5.8)
5. LEARNING IN GRAPHICAL MODELS
The local polytope is the set of mean parameters µ that respect conditions (5.7) and (5.8). It is obvious that any reachable marginals µ in M must also be consistent, and hence that M is included in L. This inclusion is actually tight for trees.
Bethe entropy The second approximation is replacing the entropy which appears as the conjugate of the log partition function A⋆ (µ) by the Bethe entropy −HBethe (µ): ! i,j K K X X XX µ k,l µik log(µik ) − HBethe (µ) = − µi,j . (5.9) k,l log µik µjl i∈V k=1 (i,j)∈E k,l=1 Here again, this approximation is tight on trees.
Bethe variational problem The two prior approximations induce an approximate mapping between canonical parameters and mean parameters: the approximate marginals µ ˜ are solutions of the following variational problem: µ ˜ = arg max hθ, µi + HBethe (µ) µ∈L
This problem, although not concave, is differentiable and its constraints are simple. The marginal distribution has been proved to be a fixed point of the sum-product algorithm and a local maximum of the Bethe variational problem (Yedidia et al., 2005).
Convergence issue In addition to the non-concavity of the problem, the belief propagation algorithm may have some convergence issues. Ihler et al. (2005) introduces an index which depends on the graph values, which insures convergence when bounded by 1. As this index is the maximum over all edges of a quantity which increases with the number of neighbors and the strength of the corresponding potentials, convergence requires simultaneously weak potentials and a small enough neighborhood structure for all nodes. Noorshams and Wainwright (2013) propose a stochastic synchronous scheme which is not only faster on trees where the convergence is proven, but is also more robust with respect to convergence. However the synchronous nature of the algorithm makes it slower in general, as updates cannot be computed in parallel. Heskes (2002) details how one can obtain a more resilient algorithm by damping the message updates: messages are taken as linear combinations between the updated messages and the ones previously obtained.
5.3.6
Learning in Potts models
Let {xt }Tt=1 be a set of T independent observations of the Potts model. Equation 5.5 rewrites: T X ⊺ X X ⊺ (5.10) xi θi,j xtj − T · A(θ). ℓ(x; θ) = xi θ i + t=1
i∈V
i,j∈E
110
5.4 Continuous time Markov models
P Denoting µ ˆi = T1 Tt=1 xti and µ ˆi,j = can rewrite (5.11) as:
1 T
⊺ t t=1 xi xj
PT
the vectors of empirical marginals we
X X � ℓ(x; θ) = T 1⊺ µ ˆi,j ⊙ θij 1 − A(θ) , (ˆ µi ) ⊺ θ i + i∈V
(5.11)
i,j∈E
with 1 the vector of ones of size K and ⊙ the entrywise matrix product, otherwise known as Hadamard product. This quantity is concave and hence can be maximized with a first order method such as gradient ascent. Recalling from Equation 5.4, we have : ∇θ A(θ) = µθ . The gradient of the log-likelihood writes: (
1 T ∇θ i ℓ(x; θ) 1 T ∇θ i,j ℓ(x; θ)
=µ ˆi − µiθ =µ ˆi,j − µi,j θ
Note that the gradient computation requires performing inference. The particular form of the gradient is easily interpretable: the parameters are optimal when they perfectly explain the observations, i.e when the empirical mean and the mean of the model are the same. This property is called the moment matching property, and is only true for flat parametrizations.
5.4
Continuous time Markov models
In this section we present another type graphical model, the Continuous Time Markov models which displays some major difference with the Potts models, mainly due to its continuous nature. The simplest version of these models is the Continuous Time Markov Chain, which is used to describe the evolution of a continuous time process that has the Markov property. Typical examples of applications include the study of chemical reactions speed (Anderson and Kurtz, 2011), the spread of infectious diseases (Jacquez and O’Neill, 1991; Keeling and Ross, 2008) and queuing theory (Gross and Harris, 1998). Continuous time Markov trees are an extension of Markov chains and are used when the continuous time process can branch out. A prime example is the study of speciation events through the analysis of phylogenetic trees. Holmes and Rubin (2002) proposes this framework for protein sequence alignment.
5.4.1
Continuous time Markov chain
Definition We consider the continuously indexed set of random variables {Xt }t∈[0,T ] P with T > 0 which take values in the set X = {z ∈ {0, 1}d | di=1 zi = 1}, and denote {xt }t∈[0,T ] a realization of the process. The random variables{Xt }t∈[0,T ] define a process for which we make two assumptions: the Markov property and a notion of homogeneity that we detail below.
111
5. LEARNING IN GRAPHICAL MODELS
The Markov property implies that the influence of the past is entirely comprised of the last observation. In other words, for 0 < s, t < T , {xt }t∈[0,T ] a realization and k ∈ X we have: p(Xs+t = k | x[0,t] ) = p(Xs+t = k | xt ). (5.12) Homogeneity states that the evolution of the process is identical at all times. In the case of as continuous time Markov chain, it translates into the following property, for k ∈ X and h, t > 0: p(Xt+h = k | xt ) is independent of t. at distance h: This property allows us to define the transition matrix Ph ∈ Rd×d + [Ph ]i,j = p(Xh = i | X0 = j) ∀(i, j) ∈ X2
(5.13)
From (5.13) we immediatly see that P is a stochastic matrix. We assume that P : R 7→ RK×K is a continuous application, which entails that P0 = I. The chain rule of + probability translates into the following equation, for s, t > 0: Ps+t = Ps Pt
(5.14)
Parameterization We denote W the rate matrix, or infinestimal generator, defined as the derivative of Ph at h = 0: W , lim
h→0
Ph − I . h
(5.15)
Combining equations (5.14) and (5.15) we can write the transition matrix at distance h asfollows: Ph = exp(hW ), (5.16) with exp being the matrix exponential. Simple calculus, detailed in the next chapter, shows that the stochasticity of P implies that the columns of W must sum to zero. The process needs to be initialized, and we define π ∈ RK + the initial probability: [π]k = p(X0 = k).
(5.17)
Factorization The law of a process with an infinite number of variables cannot be expressed directly. We write the joint probability for an arbitrary finite number of variables which corresponds to points on the chains. Furthermore, Kolmogorov’s extention theorem (Kallenberg, 2006, Theorem 5.14) insures the existence of the process at all points of the chain if it can be written for an arbitrarily large but finite number of points. Let t0 = 0 ≤ t1 < · · · < tn ≤ T be the ordered position on the chain of the variables considered, and let us denote Xi = Xti the variable indexed by ti , and xi its realization. Note that the process is however defined at all points 0 ≤ t ≤ T .
112
5.4 Continuous time Markov models
From equation (5.12) and (5.17), the probability of a realization x = {x0 , · · · , xT } of the variable formed by X = {X0 , · · · , Xn } can be factorized as follows: p(x0 , · · · , xn ) = π(x0 )
n Y i=1
t1
Pti −ti−1 (xi | xi−1 )
t3
t2
t3 + dt
(5.18)
∞
Figure 5.2: Continuous time random Markov chain.
Exponential family The form of the distribution defined in (5.18) suggests writing the process as a member of the exponential family with sufficient statistics x0 and {x⊺i−1 xi }ni=1 . Indeed we can write the logarithme of the density function as: ℓ(x0 , · · · , xn ; θ) = x⊺0 θ0 +
n X
x⊺i−1 θi xi ,
(5.19)
i=1
with θ0 and θi the parameters as defined: ( θ0 = log(π0 ) θi = log(Pti −ti−1 ), where log is the entrywise logarithm. Remark that θ as defined are not the canonical parameters but the transformed parameters. The canonical parameter of this representation is the rate matrix, and the transformation is the matrix exponentation to the power defined by the edge weights.
Inference Marginal inference on continuous Markov chains can be performed with the same collect and distribute algorithm used in tree-shaped Potts models.
Learning With the homogeneity hypothesis and Equation (5.16), the canonical parameters can be expressed with the infinitesimal generator, which only has at most d(d − 1) free parameters. The derivation of the log-likelihood’s gradient with respect to W can be found in Holmes and Rubin (2002), and very similar calculations can be found in the next chapter. Consequently the infinestimal estimator can be learnt from a single realization of the process on the chain, as each transition between obserevd nodes
113
5. LEARNING IN GRAPHICAL MODELS
gives information about W . This is a difference with the setting detailed for the Potts model in Section 5.3.6, which implied learning from several independent realization of the process. In the next section we extend these derivations to the case of tree-shaped graphs.
5.4.2
Continuous time Markov tree
Definition Holmes and Rubin (2002) use the framework of continuous time Markov trees to study protein alignements using phylogenetic trees. Let G = (V, E, w) be a |E| tree-shaped graph with w ∈ R+ being a length associated with each edge. We consider an homegeneous process continuously indexed by the edge of the tree: edges can be viewed as continuous Markov chains. As in the continuous Markov chain setting, we limit ourself to a finite number of variables, taken at the nodes of graph G. As for the Potts model, conditional independance in directed trees is equivalent to graph separation. Consequently each edge can be treated independently given x. The probability density function p can be written as follows: p(x1 , · · · , xn ) = π(x0 )
Y
pi,j (xi | xj ),
(5.20)
(i,j)∈E
with π the marginal probability vector of the root node, and pi,j (xi | xj ) the probability of node i having the value xi given that node j has value xj .
Parameterization Since the process is homogeneous over the entire tree, its joint probability can be parametrized by a single rate matrix W and the multinomial distribution π of the state of the root node. Note that in the protein aligmnent context of the article, the homogeinity of the transition rate matrix is an empirically well-established fact. The further hypothesis of time reversibility of the process implies the detailed balance equation linking π and W : πi Wij = πj Wji q Consequently the matrix S = Wij ππji is symetrical and can be diagonalized by V ∈ RK,K and µ ∈ Rn : S = V ⊺ diag(µ)V .
5.4.3
Inference and learning
Inference can be made by performing the collect and distribute algorithm as the results on chains generalizes on tree shaped graphs easily. Learning however is more intricate and requires an Expectation Maximization scheme. The E step implies performing inference, and the M step is closed-form thanks to the diagonal parameterization (V, µ).
114
5.5 Conclusion
5.5
Conclusion
In this chapter we reviewed the framework of graphical models and how the problem of inderence and learning can be formulated using concepts from exponential families. In particular, we’ve presented several well-known graphical models, namely the Potts model and the continuous time Markov chains and trees. Those two models are quite different: • continuous-time models are defined at all wheras Potts models are only defined on nodes • cycles in the graph are forbidden for continuous time Markov trees, whereas general graph can structure a Potts model. • continuous-time model are oriented and Potts models are defined on unoriented graphs. In the next chapter we present a new model which takes charactersitics from both model,a s it expands continuous time Markov trees to the case of general unoriented graphs.
115
5. LEARNING IN GRAPHICAL MODELS
116
Bibliography Anderson, D. F. and Kurtz, T. G. (2011). Continuous time markov chain models for chemical reaction networks. In Design and analysis of biomolecular circuits, pages 3–42. Springer. 111 Geman, S. and Geman, D. (1984). Stochastic relaxation, Gibbs distributions, and the bayesian restoration of images. IEEE Transactions on pattern analysis and machine intelligence, (6):721–741. 109 Gonzalez, J., Low, Y., Gretton, A., and Guestrin, C. (2011). Parallel Gibbs sampling: From colored fields to thin junction trees. In International Conference on Artificial Intelligence and Statistics, pages 324–332. 109 Gross, D. and Harris, C. (1998). Fundamentals of queueing theory. 111 Hammersley, J. M. and Clifford, P. (1971). Markov fields on finite graphs and lattices. 103 Heskes, T. (2002). Stable fixed points of loopy belief propagation are local minima of the Bethe free energy. In Advances in neural information processing systems, pages 343–350. 110 Heskes, T. (2004). On the uniqueness of loopy belief propagation fixed points. Neural Computation, 16(11):2379–2413. 109 Holmes, I. and Rubin, G. (2002). An expectation maximization algorithm for training hidden substitution models. Journal of Molecular Biology, 317(5):753–764. 111, 113, 114 Ihler, A., Fisher, J., and Willsky, A. (2005). Loopy belief propagation: Convergence and effects of message errors. The Journal of Machine Learning Research, 6:905–936. 110 Jacquez, J. A. and O’Neill, P. (1991). Reproduction numbers and thresholds in stochastic epidemic models in homogeneous populations. Mathematical Biosciences, 107(2):161–186. 111 Kallenberg, O. (2006). Foundations of modern probability. Springer Science & Business Media. 112
117
BIBLIOGRAPHY
Keeling, M. J. and Ross, J. V. (2008). On methods for studying stochastic disease dynamics. Journal of The Royal Society Interface, 5(19):171–181. 111 Lafferty, J., McCallum, A., and Pereira, F. C. (2001). Conditional random fields: Probabilistic models for segmenting and labeling sequence data. 103 Noorshams, N. and Wainwright, M. J. (2013). Stochastic belief propagation: A lowcomplexity alternative to the sum-product algorithm. Information Theory, IEEE Transactions on, 59(4):1981–2000. 110 Tatikonda, S. C. and Jordan, M. I. (2002). Loopy belief propagation and gibbs measures. In Proceedings of the Eighteenth conference on Uncertainty in artificial intelligence, pages 493–500. Morgan Kaufmann Publishers Inc. 109 Wainwright, M. J. and Jordan, M. I. (2008). Graphical models, exponential families, and variational inference. Foundations and Trends in Machine Learning, 1(1-2):1–305. 101, 103, 109 Weiss, Y. (2000). Correctness of local probability propagation in graphical models with loops. Neural computation, 12(1):1–41. 109 Yedidia, J. S., Freeman, W. T., and Weiss, Y. (2005). Constructing free-energy approximations and generalized belief propagation algorithms. IEEE Transactions on Information Theory, 51(7):2282–2312. 110
118
Chapter 6
Continuously indexed Potts model Chapter Abstract This chapter introduces an extension to undirected graphical models of the classical continuous time Markov chains. This model can be used to solve a transductive or unsupervised multi-class classification problem at each point of a network defined as a set of nodes connected by segments of different lengths. The classification is performed not only at the nodes, but at every point of the edge connecting two nodes. This is achieved by constructing a Potts process indexed by the continuum of points forming the edges of the graph. We propose a homogeneous parameterization which satisfies Kolmogorov consistency, and show that classical inference and learning algorithms can be applied. We then apply our model to a problem from geomatics, namely that of labelling city blocks automatically with a simple typology of classes (e.g. industrial area, collective housing) from simple properties of the shape and sizes of buildings of the blocks. Our experiments shows that our model outperform standard MRFs and a discriminative model like logistic regression. The material of this chapter is based on Landrieu and Obozinski (2014) , published at the 30th Conference on Uncertainty in Artificial Intelligence (UAI2014), pages 459 to 468.
6.1
Introduction
Connections in networks typically have a length or weight that gives a measure of distance between the nodes connected, or the intensity of their interaction. This length information has been used to perform unsupervised or semi-supervised classification on graphs based among others on graph partitioning algorithms (see e.g. Zhu and Goldberg, 2009). When defining probabilistic graphical models on such networks, it is not clear how to take this distance into account naturally so that the interaction decreases with the distance. In this chapter, we propose an unoriented counterpart of the continuoustime Markov process on a tree proposed by Holmes and Rubin (2002) which is naturally generalized to any unoriented graph.
119
6. CONTINUOUSLY INDEXED POTTS MODEL
In a continuous time Markov chain, a random state Xt is associated with every point t ∈ R+ . The generalization to a continuous tree mode considered by Holmes and Rubin (2002) is most simply described through its application in phylogenetics. The phylogenetic tree of a family of species is assumed given as a directed tree with branches of different lengths. The length of the branches measure the genetic distance between extant or extinct species. Branching nodes are associated with speciation events. Each point of each branch of the tree corresponds to the form taken by a species as it existed at one time in the past and the variable modeled as a random process and defined at each such point is typically a discrete trait of that species such as the nucleic acid among {A, C, T, G} at a certain position in the DNA. In the absence of speciation event, the state evolves like a continuous-time Markov chain, with time here being measure in terms of the genetic distance along an edge. When a branching occurs, the Markov chain is split into two identical states which continue to involve independently. For that process, if the edges of the trees are identified with line segments, there is a random variable Xt associated with every point t of each of these segments. Since a tree is simply connected, removing point t will split the tree in at least two components, and with this model we have the fundamental Markov property that the subprocesses defined on each component are conditionally independent given Xt . We aim to extend these models in two ways. First, these continuously indexed processes are fundamentally oriented. This stems for the fact that the continuous Markov chain in this model is homogeneous, which implies that the conditional distributions forward in time are constant, a property which, while true forward, is not in general true backwards in time. This implies in particular that all marginals of the process on any finite set of points including at least all nodes of degree different than two is naturally parameterized as a product of conditionals p(xs |xt ) whose value depends on the graph only through the distance between s and t. We aim to propose natural parameterization for unoriented continuously indexed models with the same Markov property as the oriented trees. Second, the considered models are simply connected and we would like to propose an extension from weighted trees to general weighted graphs, where all edges are identified with a real segment of lengths equal to their weights, and which satisfy the Markov property in the sense that if a finite set of points A on these segments cuts the graph into several connected components, the processes on the two subgraphs are conditionally independent given (Xa )a∈A . The obtained models will be Potts models that take into account in a natural way the length of the edges and such that the interaction between two nodes decreases with the distance separating them. More precisely, we consider a continuous graph formed of a set of junction nodes connected by segments of different lengths. In such a graph, each point of each segment can be viewed as a node of the graph linked to its neighbors by edges of infinistimal length. We then construct a discrete valued random process defined at any point of the graph, such that the process induced on the junction nodes of the graph is a usual Potts model, but with binary potentials that take into account in a natural way the length of the edges and such that the interaction between two nodes decreases with the distance separating them.
120
6.1 Introduction
After a discussion of related work, we first consider the simplest case of an unoriented continuous chain for which we propose an exponential family parametrization. Next, we show how this parametrization is naturally extended to general unoriented continuous graphs. We derive the marginal log-likelihood of different subsets of nodes, as well as the form of its gradients, and show that inference and learning in these models can be obtained with classical algorithms. We then extend the model and algorithms to the hidden Markov random field case where a feature vector is attached to a certain number node. In terms of experiments, we consider first a transductive classification problem from geomatics, which consists in assigning city blocks to different classes from simple buildings characteristics, while taking into account the distances between the blocks. Then we illustrate the possibility of using the model for transfer learning in order to refine predictions for city blocks from a new entirely unlabelled city.
6.1.1
Related work
The model we consider in this work can be viewed as an extension to undirected graphs of the continuous time Markov chain (CTMC). We therefore first review the literature pertaining to both CTMCs and graphical models The continuous-time Markov chain (Norris, 1997) is a fundamental model in probability and statistics for random variables that takes values in a set of discrete states and that can transition at any point in continuous time from one state to another. Beyond its theoretical value, it has been applied directly in queuing theory, for the statistical modeling of chemical reactions and in genetics. Indeed they provide a natural parameterization of how the joint distribution of two discrete valued random variables should change as these variables are separated in time, or in terms of a genetic divergence or another type of distance. In genetics, CTMC models have been notably used to propose models of the evolution of DNA at the nucleotide level (Durrett, 2008; Nielsen, 2005), with among several others, the celebrated Jukes-Cantor model. In this context, these models have been extended to directed trees, where the tree corresponds to a phylogeny of species or of proteins, and which has been used to estimate rate matrices or for genetic sequence alignment (Von Bing and Speed, 2004). The rate matrices of bases substitutions have been empirically proven to be temporally homogenous , and this model allows for accurate alignment of large of DNA, RNA or protein sequences. Like for CTMCs, the fact that these models are continuous arise from temporality, and the models derived are thus intrinsically oriented. For these CTMC on trees, Holmes and Rubin (2002) proposed an exponential family parametrization of the likelihood and showed that it was possible to design an EM algorithm to learn the rate matrices modeling the substitution of DNA bases over time, in a way that generalizes the classical EM algorithm on trees. As is the case for the CTMC, continuously indexed processes arise typically as the limit of discretely indexed processes. Along these lines, Yaple and Abrams (2013) consider a continuum limit of the Ising model on a regular grid where the lengths of the edges are infinitesimal and use it to characterize the patterns of magnetic polarity in ferromagnetic materials through the resolution of integro-differential equations.
121
6. CONTINUOUSLY INDEXED POTTS MODEL
A different but also recent line of research combining ideas from the graphical models literature with stochastic processes is known under the name of continuous time Bayesian networks (CTBNs, Nodelman et al., 2002). These are models of structured multivariate stochastic processes in time in which the interaction between the different components of the process can be modeled by a graphical model. These models are quite different than the continuous time tree models or the models we will propose in this chapter in that, for CTBNs, the graphical model structure is somehow orthogonal to the direction of time which is the unique global oriented continuous variable for the process. Last but not least, a common family of approaches which take into account the length of edges in a graph in the context of unsupervised or semi-supervised classification are the graph partitioning and related spectral clustering techniques (see e.g. Zhu and Goldberg, 2009, chap. 5). A review of these techniques is beyond the scope of this chapter. We however discuss how these methods differ and are not directly comparable to ours in section 6.3.3.
6.1.2
Notations
All multinomial variables considered take values in K = {1, . . . , K} and are represented by the indicator vector x ∈ {0, 1}K whose sole non zero entry P is xk when the multinomial is the kth state. We thus define X = {x ∈ {0, 1}K | k∈K xk = 1}. Given a vector x ∈ RK , diag(x) is the diagonal matrix whose elements are the entries in x. We use ⊙ (resp. ⊘) to denote the Hadamard product (resp. division), that is the entrywise multiplication (resp. division) of matrices. We will denote nodes of graphical model with the sans-serif font a, b, and set of nodes with upper capitals of the same font: A, B.
6.2 6.2.1
Continuous graph Potts models Parametrization
An unoriented continuous chain model To derive a parameterization of the model, we start with the case of an unoriented chain that we identify with the [0, l] segment, where without loss of generality l is an integer. We will denote by Xa a multinomial random variable associated with the point a ∈ [0, l]. Before defining the process at any point of the segment, we model the joint distribution of the random variables Xk for k an integer in {0, . . . , l}. Denoting by xk ∈ {0, 1}K an instance of Xk , and assuming that both unary and binary potentials are constant, the log-likelihood of the parameterization given a realization (xk )k∈{0,1,...,l} can be written in multiplicative form as p(x0 , x1 , . . . , xl ; U, h) ∝
l Y
k=0
h⊺ x k
l−1 Y
x⊺k U xk+1 ,
(6.1)
k=0
with h ∈ the vector of unary potential values and U ∈ RK×K the matrix of +∗ binary potential values. For reasons of symmetry and invariance along the chain, we RK +∗
122
6.2 Continuous graph Potts models
assume that those parameters do not depend on the position k and that U = U ⊺ . Note that, while similar in spirit, the assumption that these parameters are constant is different from assuming that the Markov chain is homogeneous; we discuss this point in section 6.3.3. To get concise forms for the log-likelihood induced on subsets of the 1 1 Xk s by marginalization, we introduce further H = diag(h) and W = H 2 U H 2 , which is a parameter that combines the binary potential with half of the unary potentials from each point of an edge. This allows us to rewrite (6.1) as follows:
p(x0 , x1 , . . . , xl ; U, h) ∝ ∝
l−1 Y
i=0 l−1 Y
x⊺i U xi+1
l Y
⊺
h xi
i=0
l Y
1
1
x⊺i H − 2 W H − 2 xi+1
i=0
i=0
∝
l Y
1
x⊺i H 2
i=0
∝
∝
Hxi
1 x⊺0 H 2
1 x⊺0 H 2
l−1 Y
1
1
x⊺i H − 2 W H − 2 xi+1
l Y
1
H 2 xi
i=0
i=0 l−1 Y
1 1 1 1 x⊺i H 2 x⊺i H − 2 W H − 2 xi+1 H 2 xi
i=0 l−1 Y
x⊺i W xi+1
i=0
!
!
1
H 2 xl
1
H 2 xl
We can now marginalize all variables except for the extreme points of the segment to obtain:
p(x0 , xl ; W, h) ∝
X
p(x0 , x1 , . . . , xl ; W, h)
x1 ··· xl−1 1 2
∝ x⊺0 H
X
l−1 Y
x1 ··· xl−1 i=0
�
1
x⊺i W xi+1 H 2 xl
� 1 1 ∝ x⊺0 H 2 x⊺0 W l xl H 2 xl � � 1 1 ∝ ht x0 x⊺0 H − 2 W l H − 2 xl h⊺ xl
(6.2)
We call W the corrected binary potential matrix. This matrix takes into account the unary potentials of the hidden states, and allows to write the likelihood by separating the influence of the edge and the end nodes, which allows for a more natural generalization to graphs later on. Similar calculations show that, for any sequence a0 = 0 < a1 < . . . < am = l with ak ∈ {0, . . . , l}, denoting dj = d(aj , aj−1 ) = aj − aj−1 the distances between consecutive
123
6. CONTINUOUSLY INDEXED POTTS MODEL
nodes and A = {a0 , · · · , am }, we have: p(xA ; W, h) ∝
m Y
⊺
h x aj
j=0
m Y
1
1
x⊺aj−1 H − 2 W dj H − 2 xaj .
j=1
By simply taking the logarithm of this expression we obtain a curved exponential family of distributions with log-likelihood ℓ (xA ; θ) =
m X
η ⊺ xaj +
j=0
m−1 X
x⊺aj Λ(θ, dj ) xaj+1 − A(θ),
(6.3)
j=0
with ∀k ∈ K, ηk = log(hk ), θ = (W, η), A the log-partition function and where Λ(θ, d) 1 1 is defined entrywise by [Λ(θ, d)]kk′ = log([H − 2 W d H − 2 ]kk′ ). It is now very natural to try and use this formula to extend the definition of the process to any sequence of points a0 = 0 < a1 < . . . < am = l that are no longer restricted to take integer values. This requires however that for all for all s ≥ 0, W s should be a well defined real valued matrix with non-negative (or for learning purposes positive) entries. The fact that W is real symmetric and that all its powers should be real implies that it should have non-negative eigenvalues. Since we can approximate a low rank matrix with a full rank matrix, we assume for convenience that all it eigenvalues are positive (any low rank matrix can be approximated by a full rank one). W is then a matrix exponential W = exp(Π). The fact that all its powers should have non-negative entries implies in particular that for any s, W s is completely positive.1 We therefore need to characterize which conditions on Π are needed to obtain a valid W . Note that Π can be viewed as the counterpart of the rate matrix for CTMCs.
Infinitesimal generator Π To easily compute the matrix exponential we use the eigendecomposition of Π: Π = P ⊺ ΣP,
Σ = diag(σ),
P ⊺ P = P P ⊺ = IK
(6.4)
and exponentiate its eigenspectrum.2 In the context of learning, it is natural to assume that the entries of W s are actually strictly positive so that the log-likelihood is always finite. The following lemma provides sufficient and necessary conditions on Π for the entries of exp (lΠ) to be either non negative or positive. Lemma 1. For Π a square matrix, [exp (l Π)]i,j ≥ 0 ∀l ∈ R+ and ∀i, j if and only if Πi,j ≥ 0 for all i 6= j. Similarly, [exp (l Π)]i,j > 0 for all i, j and ∀l ∈ R∗+ , if and only � � � � (k) (k) with ui,j = Πk i,j is such that its first non-zero value exists if the sequences ui,j k∈k
and is strictly positive, for all i 6= j .
K×m 1 A ∈ RK×K is completely positive iff there exists B ∈ R+ with A = BB ⊺ (see e.g. Seber (2008) p. 223). 2 One caveat of this parametrization is that if W is close to low rank, the corresponding eigenvalues in σ have to take large negative values. This could be addressed by working with (σk−1 )k∈K .
124
6.2 Continuous graph Potts models
Proof. See Appendix D. Remark: it is easy to see from the proof of the lemma that Πi,j > 0 for i 6= j is a sufficient condition for [exp (l Π)]i,j to be positive for all i, j and for all l ∈ R∗+ . Note that because of its normalization the likelihood obtained in (6.3) is invariant by a multiplication of H or U and thus of W by a positive scalar. As a result it is also invariant by addition of a constant multiple of the identity matrix to Π or equivalently to σ. This means that the likelihood is invariant by addition of an arbitrary identical constant to all the eigenvalues (σi )i∈K . In particular, it is possible to choose this constant sufficient large to guarantee that the diagonal of Π is positive. This implies that it will be conveniently possible to parameterize the model by the entrywise logarithm of Π.
Existence of the process on the chain We now go on to prove the existence of such process when k the number of points in A approaches infinity and the distance dj between points of A decreases towards zero. Proposition 2. There exists a stochastic process (Xa )a∈[0,l] defined at all points of the segment [0, l] whose finite marginal on any finite set of points containing a0 and al is given by (6.3). Proof. Let A = {a0 , . . . , am } and B = {b0 , . . . , bn } two such sets with a0 = b0 = 0 and am = bn = l. It is clear that using (6.3) to define a joint log-likelihood given (Xa )a∈A∪B , the log-likelihood obtained by marginalization of elements of A\B using the same type of derivation used in (6.2) is still of the form of (6.3). Since the same holds for B\A, we just showed that the collection of proposed marginals are consistent and by Kolmogorov’s extension theorem (Chung and Speyer, 1998, chap. 6). This proves the existence of the process.
6.2.2
Extending the model to graphs
Real graphs To extend the model we proposed on a segment to undirected trees and more generally to undirected graphs, we first define what we will call continuous graphs or real graphs.1 Given a weighted graph G = (V, E) with the weight dab associated with the edge (a, b) ∈ E, we define the associated real graph G as the space constructed as the union of line segments of lengths dab associated with the edges (a, b) ∈ E and whose extreme points are respectively identified with the nodes a and b through an equivalence relation. Put informally, a real graph is the set of line segments that we usually draw to represent an abstract graph. For any pair of points a′ , b′ on the same segment [a, b], we will denote by da′ b′ the length of that subsegment. Remark: Continuous trees have been studied by the field of geometrical topology . In this chapter we limit ourselves to the study of simplicial trees for which the set of nodes with more than two neighbors is discrete and finite. 1
Real graphs extend the notion of real trees which have been introduced previously in the literature (Chiswell, 2001) and are of interest notably in mathematical cladistics and to construct Brownian trees.
125
6. CONTINUOUSLY INDEXED POTTS MODEL
(b)
(a)
Figure 6.1: (a) Representation of a real graph with a zoom that shows that edges are actually a continuum of nodes linked by infinestimal unoriented edges. (b) The induced discrete graph associated with the junction nodes in red and the observed nodes in blue.
It should be noted that, in a real graph, the segments connecting a node of degree two are essentially merged into a single segment by concatenation. We will call all nodes of degree different than two junction nodes. Conversely, identifying nodes and points in the real graph, any point that is not a junction node can actually be viewed as a degree two node.
Figure 6.2: (left) Toy example illustrating that the process is defined at all points of the continuous graph. For a model on three classes (red, green blue) each point of each edge is colored with the mixture of these three colors corresponding to the probability of observing each of the classes, given that all the circle nodes are observed with the given colors.
Definition 3. Let S be the set of junction nodes. Given A a set of points on the real graph, we will call the induced discrete graph on A ∪ S, denoted by GA the graph with vertices A ∪ S and whose edges EA link the nodes that can be joined on the real graph by segments not containing elements of A ∪ S: EA = {(a, b) | ] a, b [ ∩ (A ∪ S) = ∅}. To distinguish the set of nodes in A from S \ A, we will call them observed nodes. The concepts of real graph, junction node, observed node and induced graph are illustrated on Figure 6.1.
126
6.3 Learning with continuous graphs
Towards a Potts model on real graphs To extend the stochastic process previously defined to real graphs, we first define its marginals. In particular, given a set of points A = {a0 , · · · , am }, the marginal on A ∪ S is naturally defined as follows: let GA = (A ∪ S, EA ) be the induced discrete graph on A ∪ S, we propose to define the log-marginal likelihood given (Xa )a∈A∪S as X X x⊺a Λ(θ, dab ) xb − A(θ), (6.5) ℓ (xA∪S ; θ) = η ⊺ xa + a∈A∪S
(a,b)∈EA
with θ = (η, W ) which we reparametrize from now on with θ = (η, Π). If A does not contain S, then p (xA ) is obtained by marginalizing xS\A out in p (xA∪S ).
Existence of the process on a real graph The existence of the process on a real graph is again proven using Kolmogorov’s theorem: Proposition 4. There exists a stochastic process (Xa )a∈G defined at all points of the real graph G with log-marginals on any set of nodes A containing the junction nodes given by Eq. (6.5). Proof. Let A and B be two subsets of nodes on the real graph G, for which the distributions xA and xB are obtained by marginalizing S out of xA∪S and xB∪S in Eq. (6.5). We note that a node on an edge is conditionally independent of any node on a different edge given xS . Proposition 2 tells us that the marginals are consistent on each edge with fixed endpoints, from which we can deduce that the definition of the definition of the process on A ∪ S and B ∪ S provided in Eq. (6.5) is consistent since it is obtained by marginalization of the joint distribution at the nodes A ∪ B ∪ S. The process being consistent on A and A ∪ S by definition of p(xA ), and similarly on B and B ∪ S, we have proved Kolmogorov consistency between A and B which in turn proves the existence of the process on the real graph. We will refer to the obtained process, illustrated on Figure 6.2, as a continuous graph Potts model or continuous graph Markov random field (CGMRF).
6.3 6.3.1
Learning with continuous graphs Inference
Probabilistic inference is an operation which is key to learning and making predictions in graphical models. It usually consists in computing the log-partition function, some cliques marginals or the expected value of some sufficient statistics in exponential families. In the case of our continuous graph G, if we consider any segment [a, b] with a, b ∈ S and any a′ , b′ ∈ [a, b], it should be noted that p(x{a,a′ ,b′ ,b} ) = p(x{a′ ,b′ } |x{a,b} )p(x{a,b} ) where p(x{a,b} ) is computed as a clique marginal of p(xS ), and p(x{a′ ,b′ } |x{a,b} ) reduces to the model on the segment and hence has a simple analytical expression. This implies
127
6. CONTINUOUSLY INDEXED POTTS MODEL
that marginal distributions on any finite collection of nodes on the same edge can be computed efficiently provided the edge marginals of the induced model on S can be computed efficiently. In spite of the fact that the graph has uncountably many nodes, inference can thus be performed by any classical inference algorithm scaling with |A ∪ S| and |EA |. For example, if the graph is a tree the sum-product algorithm can be used, and typically approximate inference techniques otherwise, such as loopy belief propagation.
6.3.2
Learning
In this section, we focus on learning the model from data. Since the process values are only observed at a finite number of points, we are somehow always in the situation where some nodes are unobserved. However, when all junctions nodes are observed the joint likelihood of a given set of nodes has the closed form expression of Eq. (6.5). Since this a curved exponential family, the log-likelihood is in general not a concave function of the parameters.1 To avoid having to cope with positivity constraints, and given the rapid divergence of the likelihood on the boundary of the domain we parameterize the likelihood by η and the entrywise logarithm of Π, since given the remark following lemma 1, it is possible to take Π positive entrywise. For the CTMC directed tree, Holmes and Rubin (2002) consider the likelihood of the entire process, show that it has a canonical exponential family form with a small number of sufficient statistics and derive an EM algorithm based on this representation to learn the parameters. A similar exponential family form can be obtained for our process, with also a small number of sufficient statistics and in theory it is possible to construct a similar EM algorithm. Unfortunately, in our case the M-step of the algorithm would still require solving a convex optimization problem whose solution is not closed form. We therefore do not pursue further this approach or detail the corresponding canonical exponential family form of the process. We propose instead to optimize the likelihood using a gradient based method. We show that the gradient can be computed from the moments obtained by performing the probabilistic inference on the model in different settings. In the next sections, we derive the form of the gradient of the likelihood, first when all junction nodes are observed, then, when any set of nodes is observed, and finally, when some nodes are observed and another (typically larger) set of nodes emits observed vectors of features that are each conditionally independent given the state of associated node, as in a hidden Markov random field setting. Since computing the inference is typically intractable in graphs, we introduce a variational approximation in 6.3.2 that allows for faster (linear) computation.
Gradient of the likelihood on a segment Given that the model is parameterized by exponentials of Π, the gradients involve the differential of the matrix exponential. � We will therefore repeatedly use the function ψl,Π with ψl,Π (X) = P ⊺ (P XP ⊺ )⊙Γl,Π P, 1
It is however clearly concave when all edges are of the same length, because the constraint of equality of the parameters for all potentials is a convex constraint.
128
6.3 Learning with continuous graphs
where Π = P diag(σ)P ⊺ is the eigenvalue decomposition of Π and exp (l σi ) − exp (l σj ) if σ 6= σ i j σi − σj [Γl,Π ]i,j = l exp(l σj ) if σi = σj .
The function ψ is such that the gradient of x⊺ exp (lΠ) y is ψl,Π (xy ⊺ ). It is essentially switching to the spectral space of Π, where the gradient has a simple multiplicative form given by Γ and then maps the result back to the original space. With this function, we thus have Lemma 5. The gradient with respect to variable Π of the log-likelihood ℓ of xa and xb on a segment of length l whose end points are a and b can be written as �� � � ∇Π ℓ (xa , xb ; θ) = ψl,Π xa x⊺b − E Xa Xb⊺ ⊘ W l . We first prove the following intermediate result:
Proposition 6. For x and y elementary vectors of zero value is set to one we have ∇Π [x⊺ exp (dΠ) y] P ⊺ ((P XP ⊺ ) ⊙ Γd ) P and exp (l σi ) − exp (d σj ) σi − σj [Γd ]i,j = d exp(d σj )
size K, for wich the only non= ψd,Π (xy ⊺ ) , with ψd,Π (X) =
if σi 6= σj if σi = σj ,
⊺
with Π = P diag(σ)P the eigenvalue decomposition of Π.
Proof. In Appendix D. Using the previous result we can show the following proposition: � � Proposition 7. ∇Π [x⊺ Λ(d)y] = ψd xy ⊺ ⊘ W d
� � � � 1 1 1 1 Proof. With Proposition 6 we have that ∇Π x⊺ H − 2 exp (d Π) H − 2 y = ψd H − 2 xy ⊺ H − 2 and since � � d − 21 ⊺ ⊺ − 12 x Λ(d)y = log x H W H y , we have, with ⊘ denoting the termwise division, � � � �� � 1 1 1 1 ∇Π (x⊺ Λ(d)y) = ψd H − 2 xy ⊺ ⊘ H − 2 W d H − 2 H− 2 � � = ψd xy ⊺ ⊘ W d . Finally we compute the gradient of the log partition:
129
(6.6)
6. CONTINUOUSLY INDEXED POTTS MODEL
Proposition 8. ∇Π A (Π, h) = ψd E [XY ⊺ ] ⊘ W d
�
Proof. It is a classical result in the theory of exponential families that ∇Λ(d) A (Π, h) = E [X ⊺ Y ]. By the chain rule, we have ∇Π (A (Π, h)) = J (Λ(d), Π)⊺ ∇Π [A (Π, h)] . where J (Λ(d), Π) is the Jacobian of the function Π 7→ Λ(d), which is given by 6.6 : [J (Λ(d), Π)](i,j),(k,l) =
∂ [Λ(d)](k,l) ∂Π(i,j)
� � = ψd 1k,l ⊘ W d ,
in which 1k,l denote the K×K matrix whose only non zero entry is 1 at k, l.Consequently ∇Π (A (Π, h)) = J (Λ(d), Π)⊺ × E [XY ⊺ ] � � = ψd E [XY ⊺ ] ⊘ W d ,
(6.7)
Subtracting the equation found in proposition 7 from the one in proposition 8 yields the gradient of the likelihood with respect to variable Π announced in lemma 5.
Partially observed junction nodes To learn from partially labelled data it is necessary to consider the likelihood of XB for B a set of nodes that does not necessarily contain S. Let B be a set of observed nodes, i.e. for which we know the states xB , and A a set of unobserved nodes containing S\B. We have the following log-likelihood: ℓ (xA∪B ; θ) =
X
η ⊺ xa +
a∈A∪B
ℓ (xA |xB ; θ) =
X
x⊺a Λ(θ, dab )xb − AA∪B (θ)
X
(a,b)∈EA∪B ⊺
a∈A∪B
x⊺a Λ(θ, dab )xb − AA|B (θ, xB ) ,
X
η xa +
(a,b)∈EA∪B
We can rewrite the log-likelihood as follows (Wainwright and Jordan, 2008) : ℓ (xB ; θ) = AA|B (Π, h, xB ) − AA∪B (Π, h) , and its gradient are therefore computed according to the following proposition: Proposition 9. X
∇Π ℓ (xB ; θ) =
ha,b)∈EA∪B
∇η ℓ (xB ; θ) =
X
� � ψdab ,Π (µab|B − µab ) ⊘ W dab
µa|B − µa
a∈A∪B
− 12
X
(a,b)∈EA∪B
with µab|B = E
�
Xa Xb⊺ |XB
�
� µa|B − µa + µb|B − µb .
= xB and µa|B = E [Xa |XB = xB ].
130
6.3 Learning with continuous graphs
Hidden Markov model We consider a hidden Markov random field variant of our model in which some nodes have, in addition to the state variable, a feature vector with a state specific distribution. More precisely, we envision to learn from data on a graph in which the states of a set of nodes B are observed and in which each node in a set A (with A ∩ B 6= ∅) provides an observed feature vectors ya which is conditionally independent of the rest of the graph given the corresponding node state xa . For simplicity, we assume that S ⊂ A ∪ B. The joint and conditional likelihood of observed and unobserved variables are very similar as above
ℓ (xA∪B , yA ; θ, κ) =
X
η ⊺ xa +
a∈A∪B
+
X
log (p (ya |xa ; κ))
a∈A
x⊺a Λ(θ, dab )xb
X
− AA∪B (θ, κ)
(a,b)∈EA∪B
ℓ (xA |yA , xB ; θ, κ) =
X
η ⊺ xa +
a∈A∪B
+
X
X
log (p (ya |xa ) ; κ)
a∈A
x⊺a Λ(θ, dab )xb − AA|B (θ, κ, xB , yA ) ,
(a,b)∈EA∪B
which allows us to rewrite the likelihood of observations as ℓ (xB , yA ) = AA|B (θ, κ, yA , xB )− AA∪B (θ, κ). Given that the model for p(ya |xa ) is Gaussian or at least an exponential family, when envisioning an EM algorithm to learn κ and θ, it is easy to see that the update for κ is closed form while that of θ is not. This motivates a variant of the EM algorithm which does not attempt to maximize with respect to both κ and θ simultaneously but which either maximizes the expected likelihood with respect to κ or maximizes it with respect to θ. The algorithm can then be summarized as an E-M1-E-M2 algorithm, where the E-step is the usual computation of expected sufficient statistics given current parameters, M1 solves for κ in closed form and M2 maximizes with respect to θ using gradient ascent.1
Variational approximation For graphs with cycles, since inference is intractable, we replace the likelihood by a pseudo-likelihood obtained using a variational approximation of the log-partition. Our variational approximation is the one associated with the entropy of Bethe (see, e.g. section 4.1 in Wainwright and Jordan, 2008), but other choices would be possible. The main motivation behind this approximation is that the exact gradient of this pseudo-likelihood is directly obtained from the pseudo-moments given by loopy BP. In practice, damping needs to be used (see Wainwright and Jordan, 2008, chap. 7). 1
Note that gradient ascent itself requires to perform some inference to recompute the log-partition function
131
6. CONTINUOUSLY INDEXED POTTS MODEL
In term of complexity, the parametrization of CGMRF could suggest that inference is slower than in the discrete setting since the computation of the SVD of Π is required. However, since the number of states is typically much smaller than the number of nodes in the graph, the computational cost of the SVD is negligeable compared to the overall cost of the algorithm. Hence, inference in the CGMRF is just as hard as for any discrete MRF. The log-likelihood is a curved exponential family and is in particular not a convex function of the parameters, while it is convex for a standard MRF. As a consequence the pseudo log-likelihood based on the variational approximation is also non-convex. We take advantage of the likelihood’s invariance and impose that the largest eigenvalue of Π be 0 and that the largest value of η be 0. We use gradient descent with a line-search based on the Wolfe (see Nocedal and Wright, 1999, chap. 3) conditions to approximate the maximum of the likelihood. Empirically the iterates are attracted to the same stationnary point from random initializations. It does however more iterations to converge than the MRF counterpart. Experiments showed that the training for CGMRFs was only two times longer than for regular MRFs.
6.3.3
Power of expression of the model
In this section, we discuss more precisely features of CGMRFs that are unique or common with other models and approaches existing in the literature. First, we note that for a tree, our model is not equivalent to that of Holmes and Rubin (2002). Their model uses a constant rate matrix (i.e. the Markov process is homogeneous) while we use constant infinitesimal potentials, which do not lead to a constant rate matrix on any orientation of the tree. If the tree is just the segment [0, L], for s and t with 0 < s < t < L a CTMC is such that p(xt |xs ) only depends on t − s and not on L. By contrast for our model log p (xt |xs ) depends also on L − t and L − s since log p (xt |xs ) = x⊺s Λ (t−s) xt + x⊺t η + x⊺t Λ (L−t) 1 − x⊺s Λ (L−s) 1, where for simplicity we omitted the dependance in θ, and 1 is the constant vector equal to 1. Consequently in our model the conditional probability does not only depends on the position from the conditioned variable but also from the the position in the graph. Conversly to a CTMP it is possible to have p (xt |xs ) to be non-monotonic in t − s as can be seen on Figure 6.3. To obtain this figure we consider a binary process on a chain which state 1 is repulsive, ie transitions to state 0 are very attractive from either state, even more so than 1 to 1 transitions. As a result the probability of being in state 1 is higher on the edges of the chain than at its center because edges have only one neighbor instead of two. Even when only conditioning on the first node of the chain this gives a non-monotonic probability distribution. To obtain Figure 6.3 we chose the following value for U and h: � � � � 1 1.7 .9 . and h = U= 1.3 .9 .6 We can see that when in state 1 the process has a higher incentive to switch in state 0 in which it stays. This behavior is impossible to obtain with a homogeneous
132
6.4 Experiments
continuous time markov process. More generally our model take into account the graph structure better than an oriented model, at the price of regular homogeneity. 1
CGRMF CTMC
0.5
0 0
0.5
1
Figure 6.3: Conditional probability of being in state 0 on a segment conditionally on the first node being in state 1 for different processes: (blue) CGMRF with state 1 being repulsive, (red) different CTMC interpolation sharing the same conditional probability on the last node.
Our model has in common with graph partitioning techniques and spectral clustering (SC) that the distance between nodes are taken into account. But there are several important differences: first, in SC, there is no model learning in the sense that no parameters are learned to optimize the model (Bach and Jordan (2006) who learn the metric for SC, are an exception). Second, our model captures that there could be different transition probabilities between different classes along the graph which is not possible in SC. Then, the main assumption in SC is that classes are separated by edges of smaller weights so that each class is as disconnected as possible. By contrast, our model authorizes (to some extent) transitions between classes on short edges and moreover permits that each class corresponds to several connected components. Our models extends naturally to a hidden Markov model that makes it possible to include feature vectors for some nodes and not for others, which is not possible with SC techniques. Another graph-based approach to classification which is perhaps more related to ours is the work of Zhu et al. (2003) on binary classification with harmonic functions. Indeed, the Gaussian field considered there is similar to the Potts model we obtain on the junction nodes. The approach of Zhu et al. (2003) is however just concerned by inference and not by learning, but their approach could be extended both to multi-class classification and to perform learning of the parameters.
6.4
Experiments
We present in this section experiments on real as well as synthetic data.
6.4.1
Synthetic data
In this section we provide a detailed description of simulated experiments destined to test the core model of CGMRF in a setting with no hidden layers.
133
6. CONTINUOUSLY INDEXED POTTS MODEL
We consider two multi-class classification problems on real graphs: in the first case the real graph is a tree and the data is drawn exactly according to the model proposed in this chapter, in the second case we consider the problem of predicting regions in the plane corresponding to a quantization of level sets of a random Gaussian function
Potts process on an unoriented graph In this first experiment, we generate a random weighted graph and generate data on this graph following the Potts model on the continuous graph. We compare the labels predicted with a CGMRF trained with the maximum likelihood principle, with the predictions obtained from the true CGMRF model, and with the prediction of a standard Potts model, i.e. which ignores the length of the edges (and which is thus the classical MRF counterpart of the CGMRF). We consider a semi-supervised setting in which only a small fraction of the labels of the nodes of the continuous graph are observed. The graph is generated by picking greedily 3 random neighbors for each node and each edge is assigned a length sampled from a gamma distribution. Then, the variables at the junction nodes are sampled using Gibbs sampling, given a set of parameters. We hide a portion of those variables, learn the parameters of the process following the maximum likelihood principle using a trust-region algorithm and infer the labels of the unseen nodes based those learned parameters using damped loopy belief propagation (Wainwright and Jordan, 2008, chap. 7). For each model, we construct a precision-coverage curve reported on Figure 6.5 and based on sorting the probabilistic predictions by increasing values of the entropies of these predictions. As a possible contender to compare our algorithm with, we consider a variant of the k-nearest neighbor (k-NN) algorithm on the graph that was called graph geodesic k-nearest neighbor in Herbster and Pontil (2006) (even though not the focus of that work) and where the geodesic distance is the shortest path in the graph in the sense of the sum of the lengths of the edges. In practice, we find nearest labelled neighbors in the geodesic sense using a simple algorithm based on a priority queue that explores recursively neighbors of neighbors. We should stress that the algorithm is not a label propagation algorithm based on the graph and that we actually follow geodesics until we find labelled points. We also consider a variant of this geodesic k-NN in which the prediction is obtained with weighted majority vote with weights that are inversely proportional to the exponential of the graph induced distance between them. The prediction is thus probabilistic and the predictor is a form of Nadaraya-Watson estimator based on the geodesic distance. For both of these methods, the number of neighbors k is chosen by cross validation. Finally we also compare with the naive algorithm which predicts systematically the most frequent label. We do not make any comparisons with graph partitioning algorithms for the reasons expressed in the discussion section. The results are as follows. The baseline naive algorithm that constantly picks the most frequent labels of the revealed nodes attains a precision of 61% for the experiment (reported on Figure 6.5), and the geodesic k-NN algorithm cross validated on k yields a similar precision of 60.9%. For the weighted geodesic k-NN, since it produces
134
6.4 Experiments
probabilistic predictions, we report its precision-coverage curve on Figure6.5. This precision-coverage curves indicate that, even when a small proportion of node labels are revealed, the precision obtained when learning parameters is almost as high as when using the true generating distribution and significantly above the precision obtained with the discrete random Markov field. Confident predictions of our models have a much higher precision than the k-NN algorithm, which can be very useful if not all data has to be labelled or in an active learning context. The labels form clusters on the graph and it is tempting to try and apply other common clustering algorithm such as spectral clustering on the tree, but this fails for the following reasons: first the clusters from the labels are not connected. Second the main hypothesis of spectral clustering is that the different clusters are in different connected component, or at least somewhat separated. This is not the case in this setting for which the label can possibly transition on an edge of small length. Finally the semi-supervision of the algorithm is not possible here as there are many more clusters than labels, since a given label can appear on different clusters.
Level sets of a random Gaussian function As mentioned in the discussion section, one of the advantages of our model over approaches based only on distance is that it can learn that some transitions between classes are more likely than others. To illustrate this we generate highly structured spatial data in the following way: we sample points uniformly on [0, 1]2 and compute at each point the value of a random function obtained as a random linear combination of Gaussian functions. We then quantize these values into a finite number of classes. See Figure 6.4. From such data, we construct a graph by connecting together the points whose Voronoi cells are adjacent. We could also have used a k nearest neighbor graph. As a baseline we implemented a classical k-NN algorithm based on the Euclidean distance and a weighted k-NN algorithm using weights that are inversely proportional to the exponential of the Euclidean distance to the point, like in the previous experiment but with the Euclidean distance. Again k is chosen by cross validation. We compare the precision of the result of learning for standard Potts model (MRF) and for the continuous Potts model (CGMRF). We report average precision-coverage curves over 100 replicates of the experiment on Figure 6.6. When making prediction for all unlabeled points, the different algorithms have the following precision: for k-NN 77.4%, for the weighted k-NN 81%, the MRF 71.2%, and our CGMRF 83.5%. It is interesting to note that weighted k-NN outperforms k-NN by a large margin and that the MRF has lower precision than k-NN, even though it has a much higher precision for confident predictions. In spite of the fact that the precision coverage curve of the weighted k-NN is quite close, the misclassification error of the CGMRF is 13% smaller than weighted k-NN, 27% smaller than k-NN, and 42.7% smaller than the MRF. The gain in precision is not only obtained in average since the misclassification error of the CMRF was lower than that of its closest competitor, the weighted k-NN, in 99 out of 100 experiments, which means that the CMRF performs
135
6. CONTINUOUSLY INDEXED POTTS MODEL
significantly better and by a large margin than all competitors based on Wilcoxon signed rank tests. It is interesting to note that the MRF has initially a higher precision than the CGMRF on Figure 6.6. This is explained by the fact that predictions of the CGMRF can be very confident if the closest neighbor is very close and behave in those pathological case like 1-NN, while the MRF requires that a large fraction of the neighbors have the same label to reach a similar level of confidence.
6.4.2
Experiments on real data
In geographic information systems, data is often aggregated either on regular grid or on cells corresponding to abstract administrative boundaries, which do not necessarily reflect the structure of a city. A fairly natural type of representation for urban environment is based on graphs and in particular weighted graphs which can encode a distance information. We consider a problem from geomatics in which this type of representation could be beneficial and which consists in predicting building use in urban and peri-urban environments from a few annotations and simple building shape characteristics that can be extracted easily from aerial images. More precisely, we consider the transductive learning problem of assigning city blocks to one category from {individual housing, collective housing, industrial/commercial area}.
Building the city block continuous graph A city can be divided into city blocks using its layout and road network as in Figure 6.7. Assuming that the blocks are given, we compute the Voronoi diagram of the block centroids and link together blocks with adjacent Voronoi cells. Edges are annotated with a proximity measure, in our case the distance between their respective closest buildings. This provides a continuous graph encapsulating the s tructure of the city. Each block is then annotated into one of three categories : individual residential, collective residential and industrial/commercial area. The blocks are annotated by hand using cadastral information, business registration codes, and resorting to Google street view images for ambiguous blocks (see Figure 6.7).
Data descriptors and learning setting A block is then described by the weighted average of characteristics of the buildings it contains, each building counting with a weight proportional to its volume. We tested 10 different building descriptors, found that floor area and height were the most discriminative, and that adding more descriptors actually decreases the performance of all tested algorithms. We use the example of Sevran, a French city of 50 000 inhabitants north of Paris. We divided it into 461 blocks, 400 of which can clearly be assigned one of three labels mentioned above and the rest being of insignificant size, ambiguous, or corresponding to other categories such as schools or hospitals. We consider the transductive learning problem of predicting all block labels from a subset of labelled blocks. In our experiments, 7% of annotated labels, corresponding to 28 blocks, are used for training and the remaining are used for testing.
136
6.4 Experiments
Figure 6.4: Inference of the algorithm on a random Gaussian map. (top) Quantized levels of the random Gaussian map. (middle) nodes drawn from the map with nodes whose labels are provided to the algorithm circled in black. (bottom) predictions of the CGMRF with mistakes marked with ×.
137
6. CONTINUOUSLY INDEXED POTTS MODEL
Precision−coverage in random continuous graph 1 Weighted k−NN Oracle MRF CGMRF k−NN
0.95
Precision
0.9 0.85 0.8 0.75 0.7 0.65
0
0.2
0.4
0.6
0.8
1
coverage
Figure 6.5: Averaged precision coverage curves for the inference in 28 random continuous trees of 500 nodes with 6 states and 20% of the labels revealed. We plot the precision of the inference with the exact parameters used to generate the data (red), parameters learnt in the continuous graph (black), in the discrete graph, or Markov random field (green), the weighted nearest neighbors alogorithm (blue) and the nearest neighbors alogorithm (magenta).
Competing algorithms As baselines we consider two algorithms that do not take into account spatial information: a generative Gaussian mixture model and a logistic regression trained each using the 7% revealed labels. We also consider classical hidden MRFs, which cannot take into account the distance, and whose graph is either the same as for the CGMRF or a pruned graph in which all edges longer than a threshold (corresponding to the average city block radius) have been removed. The different graphs are illustrated on Figure 6.8. Note that the Gaussian mixture model does not take the graph structure into account, and can be interpreted as an edgeless MRF In all Markov models, we use Gaussian emissions to model the distribution of the building descriptors given the block label, which can conveniently be optimized in closed form. To train the CGMRF and MRF models we learn the parameter θ with the maximum likelihood principle following the approach presented in section 6.3.2.
Results analysis For each model, we construct a precision-coverage curve, obtained by sorting the probabilistic predictions by increasing values of their entropies, and reported on Figure 6.9. The confidence bands represented corresponds to one standard error for the estimation of the mean precision. The classification error at 100% coverage is reported in Table 6.1. We can see that enriching the simple Gaussian mixture model by adding a graph structure significantly improves the overall performance. Building a MRF using all the edges from the Voronoi proximity or only retaining a fraction of the shorter edges yields similar results, on par with logistic regression. Building a CMRF using the edges
138
6.4 Experiments
Precision − coverage for random Gaussian map 1
0.95
Precision
0.9
0.85
0.8
0.75
0.7 0
Weighted k−NN MRF CGMRF k−NN 0.2
0.4
0.6
0.8
1
coverage
Figure 6.6: Averaged precision coverage curves for the inference in 100 random gaussian maps with 5 level sets, containing 1000 nodes each and with 20% of the labels revealed. We plot the precision of the inference parameters learnt in the continuous Potts model (black), in the Markov random Field (green), and the performance of thek-nearest neighbors algorithm, weighted (blue) and not (red).
Figure 6.7: (left) Buildings and road network of Sevran. (middle) Division into city blocks. (right) City blocks with annotations. Blue: individual housing, cyan: collective housing, red: industrial/commercial area. (Best seen in color.)
Figure 6.8: (left) continuous graph used to train the HCGMRF, the darker the edge the shorter the annoted distance, (middle) graph used for the HMRF including all edges or (right) with only edges shorter than a threshold.
139
6. CONTINUOUSLY INDEXED POTTS MODEL
Figure 6.9: Precision coverage curves on Sevran. Averaged precision coverage curves for the inference for 300 random resamplings of 7% of revealed labels on the city of Sevran. (Best seen in color.)
Method CGMRF Gaussian Mixture Logistic Regression MRF Pruned MRF
error 6% 12% 7.5% 7.6% 8.4%
relative gain 50% 20% 21% 29%
Table 6.1: Error at 100% coverage for the different methods in the Sevran dataset over 300 random resamplings. The relative gain represent the improvement in error by using the best methods (CGM RF ).
annotated with a distance measure leads to a performance which is significantly above all others based on estimated standard errors. When making prediction for all unlabeled points from the 7% of revealed annotations, the different algorithms yield the following average precisions (over the 300 resamplings): for the Gaussian mixture model 88.0%, for logistic regression 92.5%, the full MRF 92.4%, the pruned MRF 91.6% and our CGMRF 94.0%. Both pruned MRF and full MRF outperform the simple Gaussian mixture model, but not logistic regression, even though their precision at intermediate coverage is higher. The misclassification error of the CGMRF is 20% smaller than that of logistic regression, 21.5% smaller than for the best MRF model, and 50.2% smaller than for the Gaussian mixture. The gain in precision is not only obtained in average since the misclassification error in the CMRF was lower than MRF and logistic regression in respectively 193 and 293 out of 300 experiments. Wilcoxon signed rank tests assigns respectively p-values of 7 · 10−26 and 3 · 10−24 to the common median hypothesis. In this experiment, with 461 nodes and 2718 edges the inference takes less than 0.1s on a CPU at 3.3GHz. Learning requires usually around 50 calls to the inference step for the MRF (5s total), while it is closer to 100 for the CGMRF (10s total).
140
6.4 Experiments
GRAPH A
GRAPH A
GRAPH B
ANNOTATION A LEARNING
GRAPH B
ANNOTATION A
ˆ κˆ θ,
LEARNING
LEARNING
ˆ κˆ θ,
LEARNING
ˆ κˆ θ,
TESTING
TESTING
(a) No transfer learning.
(b) Transfer learning
Figure 6.10: Illustration of the transfer learning process from a data set A to a data set B. (a) The parameters are learnt in a semi-supervized fashion with graph A and partial annotation A, then directly applied on graph B. (b) The parameters are learnt with graph A and annotation A and serve as initilialization while unsupervized learning is performed on graph B. The parameters relearnt on graph B may outperform those learnt on graph A.
Transfer learning on another city We now consider the problem of predicting block labels on a new unannotated city using partial annotation from a given city. More precisely, we train our model with 15% of revealed labels from Sevran, and consider several schemes to make predictions on the neighboring urban area formed by Pierrefittesur-Seine together with Stains, for a total of 63000 inhabitants and 583 blocks, for which both graph and features are available but no labels are revealed. We consider logistic regression and the Gaussian mixture model trained from the annotated blocks from Sevran as baselines, and test for each of the CGMRF and MRF the models learnt as follows: • θ and κ are learnt on data from Sevran • idem followed by a single EM-step on κ alone (E-M2) on the graph of Pierrefitte+Stains • idem followed by an EM-step on θ (E-M1) and then an EM-step on κ (E-M2). This process is illustrated in Figure 6.10 and the results on Figfure 6.11.
Results analysis The precision coverage curves for the different methods on the Pierrefitte-Stains dataset, with and without relearning are reported in Figure 6.11. The classification error at 100% coverage is reported in Table 6.2. The results observe on Figure 6.11 demonstrates both the benefit of relearning, and the superiority of the CGM RF approach. Indeed the relearning step decreases the error by 15% for the CGM RF approach, allowing a gain of 46% and 35% against respectively the Gaussian Mixture and Logistic Regression appraoch. The MRF approach however
141
6. CONTINUOUSLY INDEXED POTTS MODEL
Figure 6.11: Precision coverage curves for transfer learning. Averaged precision coverage curves for the inference on the Pierrefitte/Stains conglomeration for 200 random resamplings of 15% of revealed labels on the city of Sevran. (Best seen in color.)
Method CGMRF relearning CGMRF Gaussian Mixture Logistic Regression MRF MRF relearning
error 6.8% 8% 12.6% 10.4% 10.6% 12%
relative gain 15% 46% 35% 36% 43%
Table 6.2: Error at 100% coverage for the different methods in the SPierrefitte-Stains dataset over 200 random resamplings. The relative gain represent the improvement in error by using the best methods (CGMRF with relearning).
see its performance decreased by the tyransfer learning. This is explained by the nonsupervized nature of the relearning step, which relies entirely on the quality of the initialization and the adequacy between the model and the data, both of which are inferior in the MRF setting. The pruned MRF heuristic, performing worse with or without relearning, is not represented here.
6.5
Conclusion
In this chapter, we constructed a Potts model over a continuous graph and showed how to compute the likelihood of several of its variants as well as the corresponding gradients, for the purpose of learning. Our experiments on a problem from geomatics show that this model outperforms regular MRFs, and compares favorably with logistic regression which although discriminative does not leverage unlabelled data. Finally, we showed that the model can be
142
6.5 Conclusion
used to perform transfer learning from a first partially labelled graph towards a new completely unlabeled graph. We use the 359 labelled blocks (out of 583) of the Pierrefitte/Stains conglomeration as a testing set and construct the precision-coverage curves reported on Figure 6.11 We observe that the CGMRF setting is superior to its competitors, and that the relearning step improves the performance. The MRFs does not perform as well, which can be explained by the initial prediction being inferior, and relearning degrades its performance. The setting where only one E-M2 step is performed yields in both cases results comprised between the two other settings.
143
6. CONTINUOUSLY INDEXED POTTS MODEL
144
Bibliography Bach, F. R. and Jordan, M. I. (2006). Learning spectral clustering, with application to speech separation. The Journal of Machine Learning Research, 7:1963–2001. 133 Chiswell, I. (2001). Introduction to Lambda Trees. World Scientific Publishing Company. 125 Chung, W. H. and Speyer, J. L. (1998). Stochastic Processes, Estimation, and Control. Society for Industrial and Applied Mathematics. 125 Durrett, R. (2008). Probability models for DNA sequence evolution. Springer. 121 Herbster, M. and Pontil, M. (2006). Prediction on a graph with a perceptron. In Advances in Neural Information Processing Systems, pages 577–584. 134 Holmes, I. and Rubin, G. (2002). An expectation maximization algorithm for training hidden substitution models. Journal of Molecular Biology, 317(5):753–764. 119, 120, 121, 128, 132 Landrieu, L. and Obozinski, G. (2014). Continuously indexed potts models on unoriented graphs. In UAI 20114-30th Conference on Uncertainty in Artificial Intelligence, pages 459–468. 119 Nielsen, R. (2005). Statistical methods in molecular evolution. Springer. 121 Nocedal, J. and Wright, S. (1999). Numerical Optimization. Springer. 132 Nodelman, U., Shelton, C. R., and Koller, D. (2002). Continuous time Bayesian networks. In Proceedings of the Eighteenth conference on Uncertainty in artificial intelligence, pages 378–387. Morgan Kaufmann Publishers Inc. 122 Norris, J. R. (1997). Markov chains. Cambridge University Press. 121 Seber, G. A. (2008). A matrix handbook for statisticians, volume 15. Wiley. 124 Von Bing, Y. and Speed, T. P. (2004). Modeling DNA base substitution in large genomic regions from two organisms. Journal of Molecular Evolution, 58(1):12–18. 121
145
BIBLIOGRAPHY
Wainwright, M. J. and Jordan, M. I. (2008). Graphical models, exponential families, and variational inference. Foundations and Trends in Machine Learning, 1(1-2):1–305. 130, 131, 134 Yaple, H. A. and Abrams, D. M. (2013). A continuum generalization of the Ising model. arXiv1306.3528. 121 Zhu, X., Ghahramani, Z., and Lafferty, J. (2003). Semi-supervised learning using Gaussian fields and harmonic functions. In Proceedings of the International Conference on Machine Learning (ICML), volume 3, pages 912–919. 133 Zhu, X. and Goldberg, A. B. (2009). Introduction to semi-supervised learning. Synthesis lectures on Artificial Intelligence and Machine Learning, 3(1):1–130. 119, 122
146
Conclusion The key motivation of this thesis was to develop tools to handle some of the specifities of spatial data, and more precisely geostatistics. This led us to consider the problems of learning and generalizing from data whose structure is encoded by weighted graphs with high variability in edge weight and node degrees, as opposed to the grid graphs typically used when considering images or raster data. Examining corresponding machine learning questions led us to develop several mathematical methods for efficiently and accurately solving graph-structured optimization and classification problems. While initially conceived for geostasistics, the methods developed in this manuscript can also be applied to more general problems that can be modelled by a weighted graph. This thesis made two types of contribution: it developed faster algorithms for solving problems induced by existing models, and it introduced a new model to accurately represent discrete processes defined on a weighted graph. We illustrated the efficiency of our algorithms on image recovery and spatial data analysis tasks, for which we provided context and analysis as well. The first chapter introduced spatial data analysis, the specifities of geostatistics, and how prior knowledge of the organization of spatial data imposes a specific structure on associated problems. In chapters 2 to 4, we focused on the development of convex optimization algorithms to efficiently solve problems structured by general weighted graphs. In particular, we presented a novel preconditioning scheme for the Generalized ForwardBackward proximal splitting algorithm well suited for graphs with high variance in edge weights and neighborhood size, which lead to badly-conditioned structured optimization problems. The proposed preconditioning allowed us to obtain faster convergence than classical approaches, such as the first order primal dual algorithm, as demonstrated for geostatistical data aggregation. In chapter 4, we introduced a new algorithm, cut pursuit, which exploits the relationship between total variation and graph-cut algorithms in a simple and novel manner. It follows a working set scheme in which the graph is iteratively split into constant regions until the optimum is reached. For problems that can be well-estimated with few level-sets, our approach displays a significant gain in computational speed. In the non-convex Mumford-Shah setting, we proposed a variant of cut pursuit which is able to find better approximated solutions than the state-of-theart methods such as α-expansion, and in a shorter time. We illustrated the algorithm’s performance with image recovery and spatial aggregation problems. In chapters 5 and 6, we considered the problem of probabilistic classification for
147
BIBLIOGRAPHY
data structured by a weighted graph. We proposed a novel graphical model that we call continuously indexed Potts model, which provides a mathematically principled way of taking edge weights into account for inference and learning. This model extends the continuous time Markov chains to the general undirected graph setting, with the length of each edge corresponding to its weight. An important difference from Potts models is that the associated process is defined at all points of the continuum forming the edges, and not just at a discrete set of nodes. This model was used for the spatially-structured problem of predicting land-use in urban environement. Our approach neither increases the number of parameters nor the computation time compared to standard approaches, and allows us to take into account more accurately the influence between neighboring regions, leading to more precise classification. The weighted graph framework being highly versatile and expressive, we argue that many spatial analysis problems could be formalized and efficiently solved by extending the methods proposed in this manuscript. Spatial data types not covered in this thesis, such as multispectral aerial photography or LIDAR point clouds, can also be embedded in a weighted graph structure. Tasks such as segmentation or regularization of semantic classification could then be cast as the optimization problem similar to the ones tackled in this thesis.
148
Appendix A
Converting spatial data to graph Chapter Abstract This appendix presents details on how to convert raster or vector data into a weighted graph structure.
A.1
Converting spatial data to graph
In this section we present two methods for capturing the spatial structure of a geographical space with graphs. The examples are taken from Grand Lyon, an intercommunal structure based around the French city of Lyon and its suburbs. With just under 1.3 million inhabitants, 500.000 distincts buildings and 40.000 roads segments, it is one of the major French population and economic center. We consider two types of urban data: raster and vector data.
A.1.1
Raster data
Raster data are geographical data aggregated over a regular grid, which often is isotropic. For example the French National Institue for Statistics and Economic research have made public a spatialized database composed of 18 socio-ecomomic variables on a 200 × 200m raster. The rasterization also causes several problems depending on the scales at which we want to consider the data: from afar the resolution is too refined and prevent the global tendencies and information from standing out. At closer view, the 200 × 200m raster appears coarse and do not respet the finer urban structure, such as buildings blocks or roads network. To convert a raster structure to a graph the general baseline is to compute the adjacency graph of each of the rectangular cell. This approach has however several limitations. In image and spatial data analysis it is common for the length of the contour of a zone to intervene, and it is in particular the case for the models presented in chapter 2 to 4. However in a square grid this length is obtained from the Manhattan distance, which tends to induce numerous anisotropic artifacts, as a square of side 1
149
A. CONVERTING SPATIAL DATA TO GRAPH
Figure A.1: Rastered average income per consumption unit of Grand Lyon at different scales (left) Intercommunality (middle) Lyon (right) First Arrondissement
π √4 2π 16
Figure A.2: Illustration of the conversion of raster data into a weighted graphs. Remark that the gaps are taken into account by adding empty cells.
and a circle of diameter 1 share the same perimeter. Another limitation is the case of incomplete grids: as some cells are missing the adjacency structure do not capture the gaps well. To tackle those issues some empty nodes are added to complete the grid, and the 8 neighborhood is computed. The edge weight are chosen to best approximate the length of the curves with the Cauchy-Crofton formula (Goldfarb and Yin, 2009, formula 2.5).
A.1.2
Vector data
Vector data are given at the level of each individual building and road. For each building is given shape of the floor space as well as facade height. For each road is given its extent and its type, as illustrated in Figure A.3. Individual building are often not a convenient unit when modeling urban phe-
150
A.1 Converting spatial data to graph
Figure A.3: Buidlings shape (top) and roads network (bottom) of Grand Lyon at different scales (left) Intercommunality (middle) Lyon (right) First Arrondissement
nomenons as it is too granular, making the choice of statistically significant parameters difficult. Indeed morphological descriptors such as height and surface at the individual building level have little spatial structure, and are not robust to arbitrary modelisation choices. For example, the modeliser must determine if two buildings linked by a thin stretch shall be considered as a large unique buildings, or two smaller ones? If so what is the width threshold? Hence it is desirable to automatically group buildings into geographical meaningful units, such as urban blocks Keating and Krumholz (2000). This partition groups together buidings that are : (a) close by (b) not separated by any roads. City blocks are preferred to rasters as they are less arbitrary and more robust. Furthermore they capture in part the spatial structure of the underlying urban space by taking into account the cadastral data and the road network simultaneously. We present here an algorithmic approach to grouping buildings into city blocks. City blocks are defined by the following properties: (i) building within the same building blocks are close to one another and are not separated by any roads
151
A. CONVERTING SPATIAL DATA TO GRAPH
(a) Fixed-radius neighbors
(b) 4-nearest neighbors
(c) Voronoi neighbors
Figure A.4: Adjacency graphs for different notion of neighborhood on a non-uniform sample of points. Remark that only A.4c connects point across rows.
(ii) city blocks are polygonal and completely covers the floor space of enclosed buildings (iii) city blocks boundaries do not cross roads.
Grouping buildings The first step is to find buildings that are close to one another. There are numerous ways to cluster buildings by proximity, such as from k-nearest neighbors or distance thresholding. We prefer however the parameters free relative neighborhood graphs of Jaromczyk and Toussaint (1992), which amount to compute the Voronoi cells of the centroids of all buildings and link buildings whose cells are neighbors. Indeed this approach allows to better capture line-of-sight neighborhood, and is more robust to irregular configuration of buildings. Indeed houses belonging densely packed in a row would not be connected to the building they are facing in other directions with fixed radius or the k-nearest neighbor approach, as illustrated in Figure A.4a and Figure A.4b. The relative neighborhood graph would connect adjacent house as well as houses from other rows, as seen on Figure A.4c. The latter approach defines a notion of proximity that is more relevant to the urban setting capture better the urban notion of promiscuity betwenen buildings (Cetinkaya et al., 2015). Following (ii) we define the pruned relative neighborhood graph (PRNG) as the relative neighborhood graph in which the edges crossing roads are removed. To avoid linking buidlings that are too distant we also prune edges linking buildings whose centroids are further away than a given threshold. This is the only parameter, and only intervene on a minority of edges as the road network cuts most long edges. The connected components of this graph provide a clustering of buildings that take the network into account, see Figure A.5.
Computing the blocks’ shape Property (ii) imply that the polygon corresponding to each connex component of the PRNG must cover entirely the surface area of
152
A.1 Converting spatial data to graph
(a) the selected roads
(b) Buildings centroids
: : : : : :
buildings roads buildings centroids edges of the PRNG edges too long edges intersecting a road
(c) Pruned relative Neighborhood Graph Figure A.5: Illustrtation of the process of the building grouping process. From the shape of all buildings (a) is computed their centroids (b). Then the relative neighborhood graph is computed and the edges that are either too long or intersecting a road are removed (c).
the inclosed buildings. We choose the convex hull of all points composing the buildings contours and perform a dilatation, see Figure A.6. To verify property (iii) we must reshape this polygon until it doesn not cross any roads. We define an intercepting path a set of consecutive roads segments that crosses the initial polygon exactly twice and both its free ends are oustide the polygon. Such a path split the polygon in two parts, one containing all the buildings, and another that contains none, and therefore must be discarded, see Figure A.6.
Computing the partition At this point of the process are computed a set of polygons containing the different connected component of the PRNG and following the road network. We would like to have a polygonal partition of the entire space, and hence need to add polygons between the current blocks. To proceed we compute the relative neighborhood graph of the vertices constituing the boundaries of the city blocks, see Figure A.7b. To decrease redudnancy we merge the triangles joining the same blocks, see Figure A.7c.
153
A. CONVERTING SPATIAL DATA TO GRAPH
(a) Initial block
(b) Intersecting roads
: : : : :
building Convex hull roads intersecting roads city block
Figure A.6: Illustration of the computation of the shape of a city block. First the convex hull of all buildings is computed as well as the neighboring roads (a), then the intersecting roads are detected (b) and finally the city block is retrieved (c).
The polygon added in this process, which contains no buildings, are called empty blocks, and will defines regions with observation weight zero, as described in Chapter 3.
154
A.1 Converting spatial data to graph
(a) City blocks
(b) RNG of the city blocks vertices
: : : :
city block city blocks’ vertex edge of vertices’ RNG empty block
(c) final partition Figure A.7: Illustration of the computation of the polygonal partition. The relative neighborhood graph of the verices forming the city blocks ’a) is computed (b). Then the triangles joining the same blocks are merged (c).
155
A. CONVERTING SPATIAL DATA TO GRAPH
156
Bibliography Cetinkaya, S., Basaraner, M., and Burghardt, D. (2015). Proximity-based grouping of buildings in urban blocks: a comparison of four algorithms. Geocarto International, 30(6):618–632. 152 Goldfarb, D. and Yin, W. (2009). Parametric maximum flow algorithms for fast total variation minimization. SIAM Journal on Scientific Computing, 31(5):3712–3743. 150 Jaromczyk, J. W. and Toussaint, G. T. (1992). Relative neighborhood graphs and their relatives. Proceedings of the IEEE, 80(9):1502–1517. 152 Keating, W. D. and Krumholz, N. (2000). Neighborhood planning. Journal of Planning Education and Research, 20(1):111–114. 151
157
BIBLIOGRAPHY
158
Appendix B
Appendix of Chapter 2 Proof of proposition 3 and 4 Proposition 3. For x⋆ ∈ Rn we have the following equivalence: � � ⋆ x = arg min Φ(z) ⇔ (x⋆ = proxΦ (x⋆ )) z∈Rn
Proof. (⇒) If x⋆ = arg minz∈Rn Φ(z) then by definition: Φ(x) ≥ Φ(x⋆ ) Φ(x) +
1 1 kx − x⋆ k2 ≥ Φ(x⋆ ) + kx⋆ − x⋆ k2 2 2 x⋆ = proxΦ (x⋆ )
(⇐) If x⋆ = proxΦ (x⋆ ) then by definition x⋆ = arg min{Φ(x) + 21 kx − x⋆ k2 }. Using Proposition 1 we have that: 0 ∈ ∂Φ(x⋆ ) + (x⋆ − x⋆ ) and finally x⋆ = arg minz∈Rn Φ(z). Proposition 4. x⋆ is a fixed point of (2.7) if and only if it is a minimizer of f + Φ. Proof. x⋆ minimizer of f + Φ ⇔
0 ∈ ∂Φ(x⋆ ) + ∇f (x⋆ )
⇔
0 ∈ λ∂Φ(x⋆ ) − x⋆ + x⋆ + λ∇f (x⋆ )
⇔
(I − λ∇f )(x⋆ ) ∈ (I + λ∂Φ)(x⋆ )
Consequently t = (I − λ∇f )(x⋆ ) is such that 0 ∈ x⋆ − t + ∂Φ(x⋆ ) and hence x⋆ is a minimizer of 12 kx − tk2 + Φ(x), ie x⋆ = proxλΦ (t) = proxλΦ (x⋆ − λ∇f (x⋆ )).
159
B. APPENDIX OF CHAPTER 2
Equivalency between Douglas-Rachford and ADMM schemes The following calculation shows how one can obtain the Douglas-Rachford iterates from ADMM. In the ADMM framework, a splitting is operated on the variables of the two functions: minx∈Rn f (x) + Φ(x) is equivalent to solve minx,z∈Rn f (x) + Φ(y) s.t x = y. We write the augmented Lagrangian (Eckstein and Yao, 2012) corresponding to the constrained optimization with dual variable z and parameter ρ > 0: L(x, y, z) = (x) + Φ(y) + z ⊺ (x − y) +
ρ kx − zk2 2
The ADMM update to minimize this augmented Lagrangian is the following: t+1 = arg min L(x, y t , z t ) x x y t+1 = arg miny L(xt+1 , y, z t ) � t+1 z = z t + ρ xt+1 − y t+1 , which can rewritten as:
t+1 = arg min f (x) + z ⊺ x + ρ x − y t 2 x x 2
2 y t+1 = arg miny Φ(y) − z ⊺ y + ρ2 y − xt+1 � t+1 z = z t + ρ xt+1 − y t+1 .
The first line of the update can be rewritten as a proximal operation:
2 ρ xt+1 = arg min f (x) + z ⊺ x + x − y t 2 x
2
1 ρ t t t+1 x−y +z z x = arg min f (x) +
2 ρ x
2
1 1 1 t+1 t t x = arg min f (x) + x − (y − z ) ,
ρ 2 ρ x
and with w = ρ1 z and λ =
1 ρ
we obtain:
xt+1 = arg min λf (x) + x
x
t+1
= proxλf y t − wt ,
1
x − (y t − wt ) 2 2
which is identical to the first line of Douglas-Rachford updates. The second and third lines can similarily be rewritten with the same change of variable
160
Bibliography Eckstein, J. and Yao, W. (2012). Augmented Lagrangian and alternating direction methods for convex optimization: A tutorial and some illustrative computational results. RUTCOR Research Reports, 32. 160
161
BIBLIOGRAPHY
162
Appendix C
Appendix of Chapter 4 The total variation as an atomic gauge It is well known that the total variation is the Lovász extension of the submodular function F : B 7→ w(B, B c ) (see Bach, 2013, chap. 6.2). The base polytope associated . with F P is the set BF = {s ∈ Rn | s(B) ≤ F (B), B ⊂ V, s(V ) = F (V )}, where . s(B) = i∈B si . For any submodular function F such that F (∅) = F (V ) = 0, which is true in particular for all symmetric submodular functions, the Lovász extension γF is a gauge function which is the support function 1 of BF : γF (x) = maxs∈BF hs, xi and its polar gauge is the gauge of BF (Bach, 2011). The total variation is thus a gauge function and its polar gauge is TV◦ with s(B) max if s(V ) = 0 ◦ TV (s) = ∅(B(V w(B, B c ) +∞ else.
Chandrasekaran et al. (2012) have recently introduced the concept of atomic gauge. Given a closed set A ⊂ Rn whose elements are called atoms, the associated atomic . gauge is the gauge γA of the convex hull CA of A ∪ {0}, i.e. γA (x) = inf{t | x ∈ t CA }. ◦ (s) = sup The polar gauge is the support function of A ∪ {0}, that is γA a∈A∪{0} ha, si. n Given that A ⊂ R , using Caratheodory’s theorem, we have that �P P γA (x) = inf a∈A ca a = x . a∈A ca | ∀a ∈ A, ca ≥ 0, Regularizing with an atomic gauge thus favors solutions that are sparse combinations of atoms, which motivated the use of algorithms that exploit the sparsity of the solution computationally (Jaggi, 2013; Rao et al., 2015). It is clear from previous definitions that Lovász extensions are atomic gauges. In �particular the total variation is the atomic gauge associated with the set of atoms A = w(B, B c )−1 1B + µ1V B ∈{∅,V / }, µ∈R �1 ′ c −1 ′ c . Expressing or equivalently the set A = 2 w(B, B ) (1B − 1B ) + µ 1V B ∈{∅,V / }, µ′ ∈R 1
See Rockafellar (1970) for definitions of gauge, polar gauge and support function of a set.
163
C. APPENDIX OF CHAPTER 4
solutions to problem regularized with the total variation as combinations of set indicators or cuts as we propose to do in this paper is thus very natural from this perspective. For the total variation, the Frank-Wolfe direction associated to s = −∇f (x) such that hs, 1V i = 0 is 1 hs, 1B i, c 1B :B ∈{∅,V / } w(B, B )
arg max hs, ξi = arg max ξ:TV(ξ)≤1
(C.1)
since the maximizer is necessarily an extreme point of the set {ξ | TV(ξ) ≤ 1} and therefore among the atoms.
Proof of proposition 1 Proposition 1. For x ∈ Rn , if we set S = S(x) then Q′ (x, 1B ) = h∇QS (x), 1B i+λwS c (B, B c ). Moreover if h∇f (x), 1V i = 0 then Q′ (x, uB ) = (γB + γB c ) Q′ (x, 1B ). Proof. For B ⊂ V we have that Q′ (x, 1B ) = h∇QS (x), 1B i + supǫ∈∂TV|Sc(x) hǫ, 1B i. This can be shown using the chain rule for subgradients that we have: ∂ TV|S c (x) =
�1
2D
⊺
δ | δS = 0, kδS c k∞ ≤ 1, ∀(i, j) ∈ E, δij = −δji ,
with D ∈ R2m×n the matrix whose only non-zero entries are D(i,j),i = wij and D(i,j),j = −wij for all (i, j) ∈ E, and with the notations δS ∈ R2m and δS c ∈ R2m for the vectors whose entries are equal to those of δ respectively on S and S c and equal to zero otherwise. Therefore if ǫ = 21 D⊺ δS c then hǫ, 1B i = h 12 δS c , D1B i =
1 X δij wij ([1B ]i − [1B ]j ) 2 c (i,j)∈S
so that
hǫ, 1B i = wS c (B, B c ). For the second statement, we have that
sup ǫ∈∂ TV|S c(x)
Q′ (x, uB ) = h∇QS (x), uB i +
sup
hǫ, uB i.
ǫ∈∂TV|S c(x)
Letting g = QS (x), and since h∇f, 1i = 0 we have h∇g, 1i = 0 for g = ∇QS (x). Consequently hg, 1B c i = hg, 1 − 1B i = −hg, 1B i, we have hg, uB i = γB hg, 1B i − γB c hg, 1B c i = (γB +γB c )hg, 1B i. Similarly, hǫ, uB i = h 21 δS c , DuB i = 21 γB hδS c , D1B i− 12 γB c hδS c , D1B c i = 21 (γB+γB c )hδS c , D1B i because D1B = −D1B c . Taking the supremum over ǫ then proves the result.
164
Proof of proposition 3 Proposition 3. We have x = arg minz∈Rn Q(z) if and only if minB⊂V Q′ (x, 1B ) = 0 and Q′ (x, 1V ) = 0. Proof. (⇒) If x is the solution of problem (1), the directional derivative of Q along any direction must be nonnegative, which implies that Q′ (x, 1B ) ≥ 0 for all B. But minB⊂V Q′ (x, 1B ) ≤ Q′ (x, 1∅ ) = 0, which proves the first part. Then since w(V, ∅) = 0 we have Q′ (x, 1V ) = h∇QS (x), 1V i, and, in fact, since all elements of the subgradient of TV|S c are orthogonal to 1V we also have Q′ (x, −1V ) = −h∇QS (x), 1V i. So 0 ≤ Q′ (x, −1V ) = −Q′ (x, 1V ) ≤ 0. (⇐) Conversely we assume that minB⊂V Q′ (x, 1B ) = 0 and Q′ (x, 1V ) = 0. Since Q′ (x, 1V ) = 0 and since wS c (V, ∅) = 0 we have h∇QS (x), 1V i = 0. Now, . for any set A which is a maximal connected component of G|S c = (V, S c ), we also have wS c (A, Ac ) = 0 so that 0 ≤ Q′ (x, 1A ) = h∇QS (x), 1A i but the same holds for the complement Ac and h∇QS (x), 1A i + h∇QS (x), 1Ac i = h∇QS (x), 1V i = 0 so that h∇QS (x), 1A i = 0. As a consequence the capacities of the graph Gf low defined in (3) of the article are such that, for any set A which is a maximal connected component of G|S c , we have X X csi = cit . (C.2) i∈∇− ∩A
i∈∇+ ∩A
Then since Q′ (x, 1∅ ) = 0 and since minB⊂V Q′ (x, 1B ) = 0 it is a minimizing argument. The characterization of the steepest partition as a minimal cut then guarantees that there exists a minimal cut in Gf low which does not cut any edge in S c and isolates the source or the sink from the rest of the graph. Given equality (C.2), the set of minimal cuts are the cuts that remove indifferently for each maximal connected component A either all edges {(s, i)}i∈A or the edges {(i, t)}i∈A . A consequence of the max-flow/min-cut duality is that to this cut corresponds a maximal flow e ∈ R2m in Gf low . This flow is such that it is saturated at the minimal cut, and we thus have esi = csi for all i ∈ ∇+ and eit = cit for all i ∈ ∇− , again because of equation (C.2). Writing flow conservation yields ( P ∀i ∈ ∇+ esi + j∈Ni (eji − eij ) = 0 (C.3) P ∀i ∈ ∇− , −eit + j∈Ni (eji − eij ) = 0
with Ni = {j|(i, j) ∈ S c }. By replacing esi and eit by their value, the flow conservation (C.3) at node i rewrites X λwij δij = 0 ∇i QS (x) + j∈Ni
1 X ∇i QS (x) + λwij (δij − δji ) = 0, 2 j∈Ni
165
(C.4)
C. APPENDIX OF CHAPTER 4
e −e
with δij = jiλwijij for (i, j) ∈ S c (x) and δij = δji = 0 for all edges (i, j) ∈ S(x). The flow e must respect the capacity at all edges and hence 0 ≤ eij ≤ cij = λwij for all edges in S c (x). Since the flow is maximal, only one of eij or eji is non zero. Hence δ we naturally have δij = −δji , and |δij | ≤ 1. But we can rewrite (C.4) as ∇QS (x) = 12 λD⊺ δ with δS = 0 and kδS c k ≤ 1 with D as in the characterization of the subgradient of TV|S c which shows that − λ1 ∇QS (x) ∈ ∂ TV|S c (x) thus that 0 ∈ ∂Q(x), and finally that x minimizes Q. Remark: We proved Proposition 3 using directly the flow formulation and the simplest possible arguments. It is also possible to prove the result more directly using more abstract results. We actually used the fact that x is a minimum of Q if and only if, for S = S(x), − λ1 ∇QS (x) ∈ ∂ TV|S c (x). But it is possible to give another representation of ∂ TV|S c (x) using that the subgradient of a gauge γ at x is ∂γ(x) = {s | hx, si = γ(x), γ ◦ (s) ≤ 1}. Indeed, for γ = TV, the set {γ ◦ (s) ≤ 1} is simply the submodular polytope PF of F : B 7→ w(B, B c ). As a result ∂ TV|S c (x) = {s ∈ Rn | hs, xi = 1, ∀B, s(B) ≤ wS c (B, B)}. But having that minB⊂V h∇QS (x), 1B i + λwS c (B, B c ) = 0 is equivalent to having − λ1 ∇QS (x) ∈ {s ∈ Rn | ∀B, s(B) ≤ wS c (B, B)}. There thus just remains to show that h∇QS (x), xi = TV(x). Let ΠS denotePthe set of maximal connected components of G|S c = (V, S c ), so that we have x = A∈ΠS cA 1A . Since wS c (V, ∅) = 0, we have 0 = Q′ (x, 1V ) = h∇QS (x), 1V i. Similarly for A ∈ ΠS , we have wS c (A, Ac ) = 0, which entails that h∇QS (x), 1A i ≥ 0. But then −h∇QS (x), 1A i = c h∇Q P S (x), 1A i ≥ 0 also, which proves h∇QS (x), 1A i = 0. Finally by linearity h∇QS (x), xi = A∈ΠS cA h∇QS (x), 1A i = 0 = TV|S c (x) which proves the result.
Computation of the Frank-Wolfe direction The computation of the Frank-Wolfe direction defined in (C.1) requires to optimize a ratio of combinatorial functions. More precisely, it requires to solve N (B) B ∈{∅,V / } D(B) max
. with N (B) = −h∇f (x), 1B i,
. and D(B) = w(B, B c ).
(B) But B 7→ N D(B) it is the ratio of a supermodular function (in fact a modular function) and a nonnegative submodular function, which, as we explain in this appendix, can thus be minimized using a natural extension to combinatorial functions of the algorithm proposed by Dinkelbach (1967) to minimize the ratio of a convex function to a positive concave function. We first consider the case where D is a positive function (which is not the case for the cut function since D(∅) = D(V ) = 0). We then have:
. Lemma. Let N : 2V → R and D : 2V → R+ \ {0}. We have that λ0 = (A) maxA⊂V N D(A)
N (A0 ) D(A0 )
if and only if N (A0 ) − λ0 D(A0 ) = maxA⊂V N (A) − λ0 D(A) = 0.
166
=
. (A) N (A0 ) Proof. Let us define A0 = arg minA⊂V N D(A) and λ0 = D(A0 ) . Since D is positive, we have ( N (A) − λ0 D(A) ≤ 0, for all A ⊂ V, N (A0 ) − λ0 D(A0 ) = 0. We conclude that A0 is a maximizer of N (A) − λ0 D(A). Conversely, let A0 be such that N (A0 ) − λ0 D(A0 ) = arg maxA⊂V N (A) − λ0 D(A) = N (A0 ) (A) 0, and so, for all A ⊂ V we have that N D(A) ≤ λ0 = D(A0 ) . This lemma from Dinkelbach (1967), shows that, up to the determination of λ0 , the original maximization problem is equivalent to the maximization of Gλ0 for Gλ : A 7→ N (A) − λD(A). Moreover it is immediate that λ 7→ maxA Gλ (A) is a nondecreasing function which is equal to 0 for λ0 , it is therefore easy to find λ0 with a bisection algorithm. The problem maxA⊂V Gλ (A) is easy to solve if Gλ is a supermodular function (Dinkelbach’s paper considers the case of functions of real vectors and focusses on the case in which G is convex). But Gλ is supermodular for all λ ∈ R if and only if N is supermodular and D is submodular. In that case, the algorithm proposed by Dinkelbach is immediately applicable to our setting and we have the following result: Proposition 7. If N and D are respectively supermodular and submodular and if D is (A) positive them Algorithm 6 is finitely convergent and converges to arg maxA⊂V N D(A) . Proof. The proof of this proposition follows the same arguments as the ones of Dinkelbach (1967). Algorithm 6: Dinkelbach’s algorithm Initialization: λ0 = 1, λ−1 = 0, t = 0 while λt 6= λt−1 do At ← arg maxA⊂V N (A) − λt D(A) (At ) λt+1 ← N D(At ) t←t+1 return At Proposition 8. If N : 2V → R, D : 2V → R+ and if there exists a set Z ⊂ 2V . N (A) such that Z = {A | D(A) = 0} = {A | N (A) = 0}, if then M = Arg maxA∈Z / D(A) , ⋆ . (A ) M ⋆ = Arg maxA∈M N (A), and A⋆ ∈ M ⋆ , if N D(A⋆ ) > 0 then M ⋆ = arg max A
N (A) D(A) + η
∀η s.t. 0 < η
0, ui,j00 0
is not empty. �S We now consider k1 = min i∈Ii (k +1)
k0 , we can deduce that ui0 ,j1 0
0 ,j0 ,k0
� Ki,j0 ,k0 , associated with i1 . Since k1 + 1
0, so that we must have that t6=i0 ,i1 Πi0 t uktj10 < 0.
171
D. APPENDIX OF CHAPTER 6
This implies that we can find i2 6= i0 , i1 such that uki21j0 < 0. But since k1 < k0 the sequence ui2 ,j0 must have once before taken a strictly positive value, which contradicts the definition of k1 . Finally, we can conclude that the set Ω is empty, which proves the lemma. We are now ready to prove lemma 1. Lemma 1. For Π a square matrix, [exp (l Π)]i,j ≥ 0 ∀l ∈ R+ and ∀i, j if and only if Πi,j ≥ 0 for all i 6= j. Similarly, [exp (l Π)]i,j > 0 for all i, j and ∀l ∈ R∗+ , if and only � � (k) if the sequences defined as ui,j = Πk i,j is such that its first non-zero value exists and is strictly positive, for all i 6= j . Proof. We first prove the lemma for the non-strict inequalities, i.e. that if we have Πi,j ≥ 0 for i 6= j then ∀(i, j) ∈ K2 , ∀l ∈ R+ ,
[exp (l Π)]i,j ≥ 0.
We define the continuous functions fi,j : l 7→ [exp (l Π)]i,j , ∀ (i, j) ∈ K2 , and introduce the sequences of derivatives of fi,j at zero : (k) ui,j
∂ k fi,j (0) h k i = = Π . ∂lk i,j
Since for i 6= j , (k+1) ui,j
=
K X
(k)
(k)
Πi,t · ut,j ≥ Πi,i · ui,j
t=1
(1)
(k)
and ui,j ≥ 0, it appears that either ui,j is identically zero or its first non-null value must be strictly positive. On the diagonal, ∀i ∈ K, fi,i (0) = 1 and since fii (l) is continuous there exists an ηi > 0 such that ∀s ∈ R, |s| ≤ ηi ⇒ fii (s) ≥ 0. Outside of the diagonal, ∀i, j ∈ K2 , fi,i (0) = 0. If the sequence ui,j is identically (k) P∞ lk ui,j and we set equal to zero then fi,j (0) = 0 for all l ∈ R since fi,j (l) = k=0 k! ηi,j = 1. Otherwise, the first non zero derivative of fi,j at zero must exist and be strictly positive, implying that we can find ηi,j > 0 such that ∀s ∈ R, |s| ≤ ηi,j ⇒ fij (s) ≥ 0. With � � η = min (ηi )i∈K , (ηi,j )i,j∈K2 , � we have that ∀l ∈ R, ∃n ∈ N such as nl ≤ η and then, ∀i, j ∈ K2 , fij nl ≥ 0.
172
� The properties of the matrix exponential gives us that [fij (l)] = fij � of matrix exponentiation, and since fij nl ≥ 0 ∀i, j ∈ K2 , we also have �
l n
��n
in term
� ��n l fij ≥ 0, ∀i, j ∈ K2 n
which proves that all the fi,j are non negative for i 6= j. The proof for the strict inequality is similar because the first non zero derivatives are strictly positive, implying that the fi,j must be strictly positive for t > 0.
We now go on to prove that conversly, if [exp (l Π)]i,j ≥ 0 ∀l ∈ R+ and ∀i, j then necessarily Πi,j ≥ 0 for i 6= j. For all fi,j with i 6= j to be non negative the sequence of their derivatives at zero must either have their first non-zero value positive, or be identically zero, which implies that Πi,j ≥ 0. For the strict inequality, since we have that [exp (tΠ)]i,j > 0 the sequences (k)
of ui,j cannot be identically zero. This shows that the sequences of derivatives at zero of the functions fi,j must have their first non-zero value and and that it must necessarily be strictly positive, which proves the lemma.
Proof of proposition 6 Proposition 6. For x and y elementary vectors of size K, for wich the only nonzero value is set to one we have ∇Π [x⊺ exp (dΠ) y] = ψd,Π (xy ⊺ ) , with ψd,Π (X) = P ⊺ ((P XP ⊺ ) ⊙ Γd ) P and
[Γd ]i,j
exp (l σi ) − exp (d σj ) σi − σj = d exp(d σj )
if σi 6= σj if σi = σj ,
with Π = P diag(σ)P the eigenvalue decomposition of Π. ⊺
Proof. In the remainder of the proof, we will use the matrix max-norm defined for a matrix M ∈ P RK×K by kM kmax = maxk,k′ |Mk,k′ |, and the matrix operator norm kM k∞ = maxk ′k |Mk,k′ |. We first compute the differential. For ǫ a K × K matrix such that kǫkmax ≤ 1, we have:
173
D. APPENDIX OF CHAPTER 6
x⊺ (exp (d (Π + ǫ))) y − x⊺ (exp (d Π)) y ! ∞ � X dk � k ⊺ k = x (Π + ǫ) − Π y k! k=0 !! k−1 ∞ k X X d Πt ǫΠk−1−t + r (ǫ, k) y = x⊺ k! =
k=1 k−1 ∞ X X dk k=1 t=0
= Tr ǫ
k!
t=0
�
Tr ǫΠ
k−1−t
k−1 k ∞ X X d k=1 t=0
k!
t
⊺
yx Π ⊺
Π xy Π
t
�
+x
k−1−t
⊺
∞ X dk k=1
!⊺ !
k!
+ x⊺
r (ǫ, k) y
∞ X dk k=1
k!
r (ǫ, k) y,
Where we have r (ǫ, k) are the terms of second order and more in the� expansion of � P∞ dk (Π + ǫ)k . To prove that we do have the differential we must prove that x⊺ k=1 k! r (ǫ, k) y is bound by an term which is O(ǫ2 ).
! ∞ X dk r (ǫ, k) y ≤ kr (ǫ, k)kmax k! k! k=1 k=1
� � ∞ X
dk ǫ 2
≤ kǫkmax r , k
k! kǫkmax max k=1
� � k−1 ∞ k
k X X ǫ d ǫ
Πk−1−t − Πk − ≤ kǫk2max Πt
Π+
k! kǫkmax kǫkmax t=0 k=1 max
�
�k ∞
k X d ǫ
+ Πk ≤ kǫk2max
Π+
k! kǫkmax max k=1 max
k−1
!
X
ǫ
Πk−1−t . + Πt
kǫkmax t=0
We have the immediate result: Πk max ≤ K k kΠk∞ , and the less immediate one:
k−1
X
ǫ
Πt Πk−1−t ≤ kK k kΠkk−1
max .
kǫkmax ⊺ x
∞ X dk
t=0
Injecting those expressions in the main inequality we have that: ⊺ x
! ∞ X dk 2 r (ǫ, k) y ≤ kǫkmax k! k!
∞ X dk k=1
≤
!
k
ǫ k k−1 k k
+ K kΠk K max + kK kΠkmax
Π + kǫk max ∞
k=1 2 kǫkmax (exp (dK
174
k
kΠkmax + 1) + (dK + 1) exp (dK kΠkmax ))
This proves that: ∇Π [x⊺ exp (l Π) y] =
∞ X k−1 k X d k=1 t=0
k!
Πt xy ⊺ Πk−1−t .
Since t
⊺
k−1−t
Π xy Π
⊺ t
⊺
⊺ k−1−t
= P σ P xy P σ
P =P
and k−1 X
σat σbk−1−t = [γk ]i,j
we have ∇Π [x exp (s Π) y] = P
⊺
k−1 k � ∞ X X d k=1 t=0
= P⊺
�
⊺
k!
⊺
⊺
k!
= P ⊺ ((P xy ⊺ P ⊺ ) ⊙ Γd ) P.
σat σbk−1−t
i
a,b
�
P
if σi = σj ,
∞ X dk k=1
h
if σi 6= σj
(P xy P ) ⊙
(P xy ⊺ P ⊺ ) ⊙
175
⊺
(P xy P ) ⊙
k k σi − σj = σi − σ j kσ k−1 i
t=0
⊺
⊺
γk
h
!
σa−t σbk−1−t
i
a,b
�
P
P (D.1)
D. APPENDIX OF CHAPTER 6
176
Abstract
Résumé
Modeling complex processes often involve a high number of variables with an intricate correlation structure. For example, many spatially-localized processes display spatial regularity, as variables corresponding to neighboring regions are more correlated than distant ones. The formalism of weighted graphs allows us to capture relationships between interacting variables in a compact manner, permitting the mathematical formulation of many spatial analysis tasks. The first part of this manuscript focuses on optimization problems with graph-structured regularizers, such as the total variation or the total boundary size. We first present the convex formulation and its resolution with proximal splitting algorithms. We introduce a new preconditioning scheme for the existing generalized forward-backward proximal splitting algorithm, specifically designed for graphs with high variability in neighbourhood configurations and edge weights. We then introduce a new algorithm, cut pursuit, which used the links between graph cuts and total variation in a working set scheme. We also present a variation of this algorithm which solved the problem regularized by the non convex total boundary length penalty. We show that our proposed approaches reach or outperform state-of-the-art for geostatistical aggregation as well as image recovery problems. The second part focuses on the development of a new model, expanding continuous-time Markov chain models to general undirected weighted graphs. This allows us to take into account the interactions between neighbouring nodes in structured classification, as demonstrated for a supervised land-use classification task from cadastral data.
La modélisation de processus complexes peut impliquer un grand nombre de variables ayant entre elles une structure de corrélation compliquée. Par exemple, les phénomènes spatiaux possèdent souvent une forte régularité spatiale, se traduisant par une corrélation entre variables d’autant plus forte que les régions correspondantes sont proches. Le formalisme des graphes pondérés permet de capturer de manière compacte ces relations entre variables, autorisant la formalisation mathématique de nombreux problèmes d’analyse de données spatiales. La première partie du manuscrit se concentre sur la résolution efficace de problèmes de régularisation spatiale, mettant en jeu des pénalités telle que la variation totale ou la longueur totale des contours. Nous présentons une stratégie de préconditionnement pour l’algorithme generalized forward-backward, spécifiquement adaptée à la résolution de problèmes structurés par des graphes pondérés présentant une grande variabilité de configurations et de poids. Nous présentons ensuite un nouvel algorithme appelé cut pursuit, qui exploite les relations entre les algorithmes de flots et la variation totale au travers d’une stratégie de working set. Ces algorithmes présentent des performances supérieures à l’état de l’art pour des tâches d’agrégations de données geostatistiques. La seconde partie de ce document se concentre sur le développement d’un nouveau modèle qui étend les chaînes de Markov à temps continu au cas des graphes pondérés non orientés généraux. Ce modèle autorise la prise en compte plus fine des interactions entre nœuds voisins pour la prédiction structurée, comme illustré pour la classification supervisée de tissus urbains.
Keywords
Mots Clés
machine learning, structured optimization, graphical mod- Apprentissage machine, optimisation structurée, modèles graphiques, variation totale, Mumford-Shah, analyse de els, total variation, Mumford-Shah, spatial data données spatiales analysis