May 5, 2010 - In Chapter 4 we sketch an evaluation framework for topic models. .... The general idea of topic models in the probabilistic context, is that documents are mixtures of ...... (Webb, 2002), a special kind of artificial neural network.
T OPIC M ODELS WITH S TRUCTURED F EATURES
A LTA DE WAAL
T OPIC M ODELS WITH S TRUCTURED F EATURES By
Alta de Waal Submitted in partial fulfilment of the requirements for the degree
Philosophiae Doctor (Engineering Science) in the Faculty of Engineering at the NORTH WEST UNIVERSITY
Advisor: Professor E. Barnard May 5, 2010
T OPIC M ODELS WITH S TRUCTURED F EATURES
The need to efficiently analyse and understand key information in large sets of digital text collections such as e-mails, reports and news articles increases as these sources become more widely accessible. Addressing this problem prompts the use of information retrieval techniques such as text classification, filtering and information extraction. Topic models explain a collection of documents with a small set of distributions over terms. These distributions over terms defines the topics. Topic models are unsupervised techniques, making them useful for document collections in which documents are not labelled. Topic models ignore the structure of documents and use a bag-of-words approach which relies solely on the frequency of words in the corpus. We challenge the bag-of-word assumption and propose a method to structure single words into concepts. In this way, the inherent meaning of the feature space is enriched by more descriptive concepts rather than single words. We turn to the field of natural language processing to find processes to structure words into concepts. In order to compare the performance of structured features with the bag-of-words approach, we sketch an evaluation framework that accommodates different feature dimension sizes. This is in contrast with existing methods such as perplexity, which depend on the size of the vocabulary modelled and can therefore not be used to compare models which use different input feature sets. We use a stability-based validation index to measure a model’s ability to replicate similar solutions of independent data sets generated from the same probabilistic source. Stability-based validation acts more consistently across feature dimensions than perplexity or information-theoretic measures. Topic model algorithms can be a valuable component for text mining applications, for the purpose of suggesting themes that are prevalent within a corpus and associate related documents with each other. We apply topic models to the field of digital forensics and thereby provide a novel analysis technique for this research field. Keywords: topic models, latent semantic analysis, latent Dirichlet allocation, bag-of-words, evaluation framework, perplexity, structured features, digital forensics, evidence mining.
O NDERWERPMODELLE MET G ESTRUKTUREERDE K ENMERKE
Daar is ’n toenemende behoefte om sleutelinligting in groot stelle digitale teksversamelings soos e-posse, verslae en nuusberigte doeltreffend te ontleed en te verstaan omdat hierdie tipe bronne toenemend algemeen beskikbaar raak. In die aanspreek van hierdie probleem ontstaan die behoefte vir inligtingherwinningstegnieke soos teksklassifisering, filterprosesse en die onttrekking van inligting. Onderwerpmodelle verskaf inligting oor ’n versameling dokumente met ’n klein stel verspreidings van terme wat die onderwerpe definieer. Omdat onderwerpmodelle van ongekontroleerde tegnieke gebruik maak, is hierdie modelle uiters nuttig vir dokumentversamelings waarin die dokumente nie geetiketteer is nie. In onderwerpmodelle word die struktuur van dokumente geignoreer en word die sak-met-woorde benadering gebruik, wat slegs afhanklik is van die frekwensie waarteen woorde in die korpus voorkom. Die aannames in die sak-met-woorde benadering word bevraagteken en ’n metode word voorgestel waarin enkelwoorde tot konsepte gestruktureer word. Met hierdie metode word die inherente betekenis van die kenmerkruimte verryk deur meer beskrywende konsepte as enkelwoorde. Strategie¨e uit die veld van natuurlike taalverwerking word gebruik om woorde na konsepte te struktureer. Ten einde die toepassing van gestruktureerde kenmerke met die sak-met-woorde benadering te vergelyk, word ’n evalueringsraamwerk voorgestel wat verskillende kenmerk dimensiegroottes bevat. Dit is in teenstelling met bestaande metodes soos perpleksiteit wat afhanklik is van die grootte van die woordeskat wat gemodelleer word. Perpleksiteit kan gevolglik nie gebruik word om modelle wat verskillende stelle invoerkenmerke gebruik, te vergelyk nie. ’n Stabiliteitsgebaseerde toetsindeks word gebruik om die model se vermo¨e te meet om soortgelyke oplossings te genereer vanuit onafhanklike datastelle wat vanuit dieselfde waarskynlikheidsbron genereer is. So ’n stabiliteisgebaseerde toets maak dit moontlik om beskrywings met verskillende kenmerkdimensies te vergelyk, in teenstelling met perpleksiteit of inligtingsteoretiese maatstawwe. Algoritmes wat onderwerpmodelle vind kan ’n waardevolle hulpmiddel vir toepassings in teksontginning wees, met die doel om temas te identifiseer wat oorheersend in die korpus voorkom asook om verwante dokumente met mekaar in verband te bring. In hierdie ondersoek word onderwerpmodelle in die veld van digitale forensiese ondersoeke toegepas. Dit voorsien nuwe en
vindingryke ontledingstegnieke in hierdie navorsingsveld. Sleutelterme: onderwerpmodelle, latente semantiese analise, latente Dirichlet allokering, sakmet-woorde, evalueringsraamwerk, perpleksiteit, gestrukureerde kenmerke, digitale forensiese ondersoeke, bewysontginning.
ACKNOWLEDGEMENTS Foremost, I thank my supervisor, Etienne Barnard. I appreciate his outstanding guidance and mentorship in shaping my research career. I also thank Marelie Davel who gave me the opportunity and appointed me in the Human Language Technology Research group. I am really proud to be associated with this team of superb researchers. Many colleagues contributed to this work. Cobus Venter co-explored the idea of evidence mining and the application of topic modelling on digital forensics. Christiaan van der Walt and Ewalt van Dyk provided constructive discussions and assistance, especially with applying SVMs in the evaluation framework. Jaco Badenhorst, Charl van Heerden, Daniel van Niekerk, and Gerhard van Huyssteen contributed to different perspectives on this research. I thank all my family and friends for believing in me and supporting me in so many ways: from delightful distractions to babysitting. A special thanks to my parents Gerrit and Hettie van Wyk who have given me love, support and countless opportunities. My children, Emile and Anina, made this endeavor worthwhile - you inspire me! Finally, I thank Danie. Your love, support and believe in me make anything possible.
TABLE OF C ONTENTS
CHAPTER ONE - I NTRODUCTION
2
1.1
Topic Models . . . . . . . . . . . . . . . . . . . . . . . . . . . . . . . . . . . . . .
2
1.2
Bag-of-words Approach . . . . . . . . . . . . . . . . . . . . . . . . . . . . . . . .
4
1.3
Overview of the Thesis . . . . . . . . . . . . . . . . . . . . . . . . . . . . . . . . .
4
CHAPTER TWO - T OPIC M ODELS
6
2.1
Introduction . . . . . . . . . . . . . . . . . . . . . . . . . . . . . . . . . . . . . . .
6
2.2
Background . . . . . . . . . . . . . . . . . . . . . . . . . . . . . . . . . . . . . . .
7
2.2.1
Tf-idf Weighting Scheme . . . . . . . . . . . . . . . . . . . . . . . . . . . .
7
2.2.2
Latent Semantic Analysis . . . . . . . . . . . . . . . . . . . . . . . . . . .
8
2.2.3
Probabilistic Latent Semantic Analysis . . . . . . . . . . . . . . . . . . . .
8
2.2.4
Non-negative Matrix Factorisation . . . . . . . . . . . . . . . . . . . . . . .
9
2.2.5
Latent Dirichlet Allocation . . . . . . . . . . . . . . . . . . . . . . . . . . .
9
2.2.6
Discrete Principal Component Analysis . . . . . . . . . . . . . . . . . . . .
9
Models . . . . . . . . . . . . . . . . . . . . . . . . . . . . . . . . . . . . . . . . .
10
2.3.1
Terminology and Notation . . . . . . . . . . . . . . . . . . . . . . . . . . .
10
2.3.2
Methods to Interpret Topic Models . . . . . . . . . . . . . . . . . . . . . . .
11
2.3.2.1
Generative Processes . . . . . . . . . . . . . . . . . . . . . . . .
11
2.3.2.2
Graphical Models . . . . . . . . . . . . . . . . . . . . . . . . . .
11
2.3.2.3
Matrix Factorisation . . . . . . . . . . . . . . . . . . . . . . . . .
13
2.3.2.4
Document Likelihood . . . . . . . . . . . . . . . . . . . . . . . .
13
2.3.3
Multinomial Mixture . . . . . . . . . . . . . . . . . . . . . . . . . . . . . .
13
2.3.4
Latent Dirichlet Allocation . . . . . . . . . . . . . . . . . . . . . . . . . . .
14
2.3
i
2.3.5 2.4
Gamma-Poisson . . . . . . . . . . . . . . . . . . . . . . . . . . . . . . . .
15
Conclusion . . . . . . . . . . . . . . . . . . . . . . . . . . . . . . . . . . . . . . .
17
CHAPTER THREE - L EARNING
20
3.1
Introduction . . . . . . . . . . . . . . . . . . . . . . . . . . . . . . . . . . . . . . .
20
3.1.1
Maximum Likelihood Learning . . . . . . . . . . . . . . . . . . . . . . . .
20
3.1.2
Bayesian Learning . . . . . . . . . . . . . . . . . . . . . . . . . . . . . . .
21
The Expectation-Maximisation Algorithm . . . . . . . . . . . . . . . . . . . . . . .
22
3.2.1
Multinomial Mixture . . . . . . . . . . . . . . . . . . . . . . . . . . . . . .
22
3.2.2
GaP . . . . . . . . . . . . . . . . . . . . . . . . . . . . . . . . . . . . . . .
23
Variational Methods for Bayesian learning . . . . . . . . . . . . . . . . . . . . . . .
23
3.3.1
Latent Dirichlet Allocation . . . . . . . . . . . . . . . . . . . . . . . . . . .
25
3.4
Gibbs Sampling . . . . . . . . . . . . . . . . . . . . . . . . . . . . . . . . . . . . .
27
3.5
Determining the Number of Topics . . . . . . . . . . . . . . . . . . . . . . . . . . .
27
3.6
Interpretation of Topic Model Outputs . . . . . . . . . . . . . . . . . . . . . . . . .
28
3.6.1
Topics . . . . . . . . . . . . . . . . . . . . . . . . . . . . . . . . . . . . . .
28
3.6.2
2-D Document Map . . . . . . . . . . . . . . . . . . . . . . . . . . . . . .
28
3.7
Experiments . . . . . . . . . . . . . . . . . . . . . . . . . . . . . . . . . . . . . . .
30
3.8
Conclusion . . . . . . . . . . . . . . . . . . . . . . . . . . . . . . . . . . . . . . .
30
3.2
3.3
CHAPTER FOUR - A N E VALUATION F RAMEWORK FOR T OPIC M ODELS
34
4.1
Introduction . . . . . . . . . . . . . . . . . . . . . . . . . . . . . . . . . . . . . . .
34
4.2
Perplexity . . . . . . . . . . . . . . . . . . . . . . . . . . . . . . . . . . . . . . . .
36
4.3
Stability-based Validation . . . . . . . . . . . . . . . . . . . . . . . . . . . . . . . .
38
4.3.1
Transfer by means of a Classifier . . . . . . . . . . . . . . . . . . . . . . . .
38
4.3.2
Cluster Alignment . . . . . . . . . . . . . . . . . . . . . . . . . . . . . . .
40
4.3.3
Stability Measure . . . . . . . . . . . . . . . . . . . . . . . . . . . . . . . .
43
Initialisation as Perturbation . . . . . . . . . . . . . . . . . . . . . . . . . . . . . .
43
4.4.1
Experimental Evaluation . . . . . . . . . . . . . . . . . . . . . . . . . . . .
44
Transfer Through Probability Density Estimators . . . . . . . . . . . . . . . . . . .
46
4.4
4.5
ii
4.5.1
Probability Density Estimators . . . . . . . . . . . . . . . . . . . . . . . . .
46
4.5.1.1
Naive Bayesian Classifier . . . . . . . . . . . . . . . . . . . . . .
49
4.5.1.2
Support Vector Machines . . . . . . . . . . . . . . . . . . . . . .
50
Experimental Evaluation . . . . . . . . . . . . . . . . . . . . . . . . . . . .
50
4.5.2.1
NB Probability Density Estimator . . . . . . . . . . . . . . . . . .
52
4.5.2.2
SVM Probability Density Estimator . . . . . . . . . . . . . . . . .
52
4.5.2.3
Stability Indices across Vocabulary Dimension . . . . . . . . . . .
57
4.5.2.4
Stability Indices across Number of Topics . . . . . . . . . . . . .
57
Information-theoretic Indicators . . . . . . . . . . . . . . . . . . . . . . . . . . . .
59
4.6.1
Entropy . . . . . . . . . . . . . . . . . . . . . . . . . . . . . . . . . . . . .
59
4.6.2
Mutual Information . . . . . . . . . . . . . . . . . . . . . . . . . . . . . . .
61
4.6.3
Variation of Information . . . . . . . . . . . . . . . . . . . . . . . . . . . .
61
4.6.4
Experimental Evaluation . . . . . . . . . . . . . . . . . . . . . . . . . . . .
61
4.7
Evaluation Framework . . . . . . . . . . . . . . . . . . . . . . . . . . . . . . . . .
62
4.8
Conclusion . . . . . . . . . . . . . . . . . . . . . . . . . . . . . . . . . . . . . . .
67
4.5.2
4.6
CHAPTER FIVE - S TRUCTURING F EATURES
69
5.1
Introduction . . . . . . . . . . . . . . . . . . . . . . . . . . . . . . . . . . . . . . .
69
5.2
Related Work . . . . . . . . . . . . . . . . . . . . . . . . . . . . . . . . . . . . . .
71
5.3
Data Preprocessing . . . . . . . . . . . . . . . . . . . . . . . . . . . . . . . . . . .
72
5.3.1
Stemming . . . . . . . . . . . . . . . . . . . . . . . . . . . . . . . . . . . .
73
5.3.2
Lemmatisation . . . . . . . . . . . . . . . . . . . . . . . . . . . . . . . . .
73
Structuring Features with Word Statistics . . . . . . . . . . . . . . . . . . . . . . .
74
5.4.1
Experimental Evaluation . . . . . . . . . . . . . . . . . . . . . . . . . . . .
75
5.4.2
Discussion . . . . . . . . . . . . . . . . . . . . . . . . . . . . . . . . . . .
76
Structuring Features with Chunking . . . . . . . . . . . . . . . . . . . . . . . . . .
78
5.5.1
Tagging . . . . . . . . . . . . . . . . . . . . . . . . . . . . . . . . . . . . .
79
5.5.2
Segmentation . . . . . . . . . . . . . . . . . . . . . . . . . . . . . . . . . .
79
5.5.2.1
A Note on Regular Expression Notation . . . . . . . . . . . . . .
81
5.5.2.2
Data Preparation . . . . . . . . . . . . . . . . . . . . . . . . . . .
81
Chunking Processes for Topic Models . . . . . . . . . . . . . . . . . . . . .
82
5.4
5.5
5.5.3
iii
5.5.3.1
Noun Phrases . . . . . . . . . . . . . . . . . . . . . . . . . . . .
82
5.5.3.2
Noun and Verb Phrases . . . . . . . . . . . . . . . . . . . . . . .
82
5.5.3.3
Verb and Noun with Adjectives Phrases . . . . . . . . . . . . . . .
82
5.5.4
Chunking Process
. . . . . . . . . . . . . . . . . . . . . . . . . . . . . . .
82
5.5.5
Including Significant Chunks in the Data Set . . . . . . . . . . . . . . . . .
83
5.6
Experimental Evaluation . . . . . . . . . . . . . . . . . . . . . . . . . . . . . . . .
87
5.7
Conclusions . . . . . . . . . . . . . . . . . . . . . . . . . . . . . . . . . . . . . . .
87
CHAPTER SIX - T OPIC M ODELS A PPLIED TO D IGITAL F ORENSICS
94
6.1
Introduction . . . . . . . . . . . . . . . . . . . . . . . . . . . . . . . . . . . . . . .
94
6.2
The CRISP-EM Process for Evidence Mining . . . . . . . . . . . . . . . . . . . . .
97
6.3
Topic Modelling Applied to Forensic Data . . . . . . . . . . . . . . . . . . . . . . .
98
6.3.1
Topic Modelling Process . . . . . . . . . . . . . . . . . . . . . . . . . . . .
98
6.3.2
Data Set . . . . . . . . . . . . . . . . . . . . . . . . . . . . . . . . . . . . .
98
6.3.3
Chunking Processes for Forensic Data . . . . . . . . . . . . . . . . . . . . . 100
6.3.4
Data Preprocessing . . . . . . . . . . . . . . . . . . . . . . . . . . . . . . . 100 6.3.4.1
Bag-of-words . . . . . . . . . . . . . . . . . . . . . . . . . . . . 100
6.3.4.2
Chunking . . . . . . . . . . . . . . . . . . . . . . . . . . . . . . 101
6.3.5
Experimental Evaluation . . . . . . . . . . . . . . . . . . . . . . . . . . . . 101
6.3.6
Visual Representation of Topics . . . . . . . . . . . . . . . . . . . . . . . . 102
6.3.7
Visual Representation of the Document Space . . . . . . . . . . . . . . . . . 104
6.4
Forensic Benefit of the Results . . . . . . . . . . . . . . . . . . . . . . . . . . . . . 105
6.5
Lessons Learned . . . . . . . . . . . . . . . . . . . . . . . . . . . . . . . . . . . . 106
6.6
Conclusions . . . . . . . . . . . . . . . . . . . . . . . . . . . . . . . . . . . . . . . 108
CHAPTER SEVEN - C ONCLUSION
110
7.1
Introduction . . . . . . . . . . . . . . . . . . . . . . . . . . . . . . . . . . . . . . . 110
7.2
Summary of Contribution . . . . . . . . . . . . . . . . . . . . . . . . . . . . . . . . 110
7.3
Further Applications and Future Work . . . . . . . . . . . . . . . . . . . . . . . . . 111
7.4
Conclusion . . . . . . . . . . . . . . . . . . . . . . . . . . . . . . . . . . . . . . . 112
iv
L IST OF F IGURES 2.1
Document × Word Matrix . . . . . . . . . . . . . . . . . . . . . . . . . . . . . . .
12
2.2
Graphical model of the de Finetti theorem . . . . . . . . . . . . . . . . . . . . . . .
12
2.3
Matrix factorisation of the topic model . . . . . . . . . . . . . . . . . . . . . . . . .
16
2.4
Multinomial Mixture graphical model . . . . . . . . . . . . . . . . . . . . . . . . .
16
2.5
LDA graphical model . . . . . . . . . . . . . . . . . . . . . . . . . . . . . . . . . .
16
2.6
Matrix factorisation of GaP . . . . . . . . . . . . . . . . . . . . . . . . . . . . . . .
17
2.7
GaP graphical model . . . . . . . . . . . . . . . . . . . . . . . . . . . . . . . . . .
17
3.1
2-D document map . . . . . . . . . . . . . . . . . . . . . . . . . . . . . . . . . . .
31
3.2
Perplexity results for CRAN data . . . . . . . . . . . . . . . . . . . . . . . . . . . .
31
3.3
Perplexity results for Reuters data . . . . . . . . . . . . . . . . . . . . . . . . . . .
32
4.1
Perplexity vs Feature Dimensionality (CRAN corpus) . . . . . . . . . . . . . . . . .
39
4.2
Perplexity vs Feature Dimensionality (Reuters corpus) . . . . . . . . . . . . . . . .
39
4.3
Transfer by prediction . . . . . . . . . . . . . . . . . . . . . . . . . . . . . . . . . .
42
4.4
Bipartite graph . . . . . . . . . . . . . . . . . . . . . . . . . . . . . . . . . . . . .
42
4.5
Example of two unaligned (left) and aligned (right). The x-axis represents the various documents and the y-axis represents the probability of each document belonging to the selected topic. . . . . . . . . . . . . . . . . . . . . . . . . . . . . . . . . . . . .
45
4.6
Document correlation matrix for 2 LDA topic solutions - CRAN corpus . . . . . . .
47
4.7
Separating hyperplane with margins. Taken from Wikipedia . . . . . . . . . . . . .
51
4.8
Document correlation over vocabulary size using SVM as classifier - CRAN corpus .
54
4.9
Contour graph of document correlation over vocabulary size and number of topics using SVM as classifier - CRAN corpus. . . . . . . . . . . . . . . . . . . . . . . . .
54
4.10 Example of a topic distribution over test documents: Topic model prediction (top graph) and SVM model prediction (bottom graph) . . . . . . . . . . . . . . . . . . . v
56
4.11 Percentage of topics excluded from original topic set . . . . . . . . . . . . . . . . .
58
4.12 Stability indices at 20 topics: CRAN corpus . . . . . . . . . . . . . . . . . . . . . .
58
4.13 Stability indices at 40 topics: CRAN corpus . . . . . . . . . . . . . . . . . . . . . .
58
4.14 Stability index across number of topics: CRAN corpus . . . . . . . . . . . . . . . .
60
4.15 Information-theoretic indicators of two clusterings (Meila, 2002) . . . . . . . . . . .
60
5.1
Document × word matrix . . . . . . . . . . . . . . . . . . . . . . . . . . . . . . . .
77
5.2
Document × concept matrix . . . . . . . . . . . . . . . . . . . . . . . . . . . . . .
77
5.3
Segmentation (blocks) and labelling at word and chunk levels . . . . . . . . . . . . .
80
5.4
Ratio of documents containing one or more occurrences of feature (ordered) . . . . .
85
5.5
Illustration of document × chunk matrix . . . . . . . . . . . . . . . . . . . . . . . .
85
5.6
Illustration of four strategies to normalise the variance of the feature probability across documents. . . . . . . . . . . . . . . . . . . . . . . . . . . . . . . . . . . . . . . .
86
5.7
Stability index; CRAN corpus - + . . . . . . . . . . . . . . . . . . . . . .
88
5.8
Stability index; CRAN corpus - ++ . . . . . . . . . . . . . . . . .
88
5.9
Stability index; CRAN corpus - *+, + . . . . . . . . . . .
89
6.1
The main tasks of the CRISP-EM process. . . . . . . . . . . . . . . . . . . . . . . .
96
6.2
Detailed data preparation level. . . . . . . . . . . . . . . . . . . . . . . . . . . . . .
97
6.3
Topic modelling output and interpretation scheme for forensic data . . . . . . . . . .
99
6.4
Visualisation of documents in a 2D map . . . . . . . . . . . . . . . . . . . . . . . . 105
6.5
Visualisation of topics in a 2D map . . . . . . . . . . . . . . . . . . . . . . . . . . . 106
vi
L IST OF TABLES 3.1
Two topics from AP data set . . . . . . . . . . . . . . . . . . . . . . . . . . . . . .
29
4.1
Document correlation on the training and test set - Multinomial mixture, CRAN corpus 47
4.2
Document correlation on the training and test set - LDA, CRAN corpus . . . . . . .
4.3
Document correlation on the training and test set - Multinomial mixture, Reuters corpus 48
4.4
Document correlation on the training and test set - LDA, Reuters corpus . . . . . . .
48
4.5
Document correlation using Naive Bayes as classifier - CRAN corpus . . . . . . . .
53
4.6
Stability indices using Naive Bayes as classifier - Reuters corpus . . . . . . . . . . .
53
4.7
Stability indices using SVM as classifier - CRAN corpus . . . . . . . . . . . . . . . .
53
4.8
Stability indices of vocabulary dimension 40% and 70% for 80 topics . . . . . . . .
59
4.9
Variation of information (VI) on the training and test set - Multinomial mixture, CRAN
48
corpus . . . . . . . . . . . . . . . . . . . . . . . . . . . . . . . . . . . . . . . . . .
63
4.10 Variation of information (VI) on the training and test set - LDA, CRAN corpus . . . .
63
4.11 Variation of information (VI) on the training and test set - Multinomial mixture, Reuters corpus . . . . . . . . . . . . . . . . . . . . . . . . . . . . . . . . . . . . .
64
4.12 Variation of information (VI) on the training and test set - LDA, Reuters corpus . . .
64
4.13 Mutual Information (MI) on the training and test set - Multinomial mixture, CRAN corpus . . . . . . . . . . . . . . . . . . . . . . . . . . . . . . . . . . . . . . . . . .
65
4.14 Mutual information (MI) on the training and test set - LDA, CRAN corpus . . . . . .
65
4.15 Mutual information (MI) on the training and test set - Multinomial mixture, Reuters corpus . . . . . . . . . . . . . . . . . . . . . . . . . . . . . . . . . . . . . . . . . .
66
4.16 Mutual information (MI) on the training and test set - LDA, Reuters corpus . . . . .
66
5.1
Vocabulary reduction using stemming and lemmatisation . . . . . . . . . . . . . . .
74
5.2
Results of word-to-concept experiment - CRAN corpus . . . . . . . . . . . . . . . .
76
vii
5.3
Comparison of topics: Bag-of-words (top) and word-to-concept (bottom) approach CRAN corpus . . . . . . . . . . . . . . . . . . . . . . . . . . . . . . . . . . . . . .
77
5.4
Penn Treebank tagset . . . . . . . . . . . . . . . . . . . . . . . . . . . . . . . . . .
80
5.5
Regular expressions notation . . . . . . . . . . . . . . . . . . . . . . . . . . . . . .
81
5.6
Average stability index - CRAN corpus
. . . . . . . . . . . . . . . . . . . . . . . .
89
5.7
P-value results for comparing bag-of-words with chunking strategies - CRAN corpus
89
5.8
Average stability index - Reuters corpus . . . . . . . . . . . . . . . . . . . . . . . .
90
5.9
P-value results for comparing bag-of-words with chunking strategies - Reuters corpus
90
5.10 Some interesting topics: CRAN corpus, + . . . . . . . . . . . . . . . . . .
90
5.11 Some interesting topics: CRAN corpus, ++
. . . . . . . . . . . .
90
5.12 Some interesting topics: CRAN corpus, *+, + . . . . . . .
91
5.13 Some interesting topics: Reuters corpus, +
. . . . . . . . . . . . . . . . .
91
5.14 Some interesting topics: Reuters corpus, ++ . . . . . . . . . . . .
91
5.15 Some interesting topics: Reuters corpus, *+, +
93
. . . . . .
6.1
Forensic corpus - feature sizes of different chunking strategies . . . . . . . . . . . . 101
6.2
Forensic corpus - stability index for different chunking strategies . . . . . . . . . . . 101
6.3
Interesting topics: Forensic corpus, bag-of-words . . . . . . . . . . . . . . . . . . . 102
6.4
Interesting topics: Forensic corpus, ++ . . . . . . . . . . . . . . . 102
6.5
Interesting topics: Forensic corpus, + . . . . . . . . . . . . . . . . . . . . 103
6.6
Interesting topics: Forensic corpus, +
6.7
Interesting topics: Forensic corpus, *+, + . . . . . . . . . 104
viii
. . . . . . . . . . . . . . . . . . . . 103
L IST OF A LGORITHMS
1
Multinomial Mixture EM algorithm . . . . . . . . . . . . . . . . . . . . . . . . .
24
2
GaP EM algorithm . . . . . . . . . . . . . . . . . . . . . . . . . . . . . . . . . .
24
3
LDA variational EM algorithm . . . . . . . . . . . . . . . . . . . . . . . . . . . .
29
4
Algorithm for stability measure using initialisation as perturbation method . . . .
45
5
Algorithm for stability measure using two data sets as perturbation method . . . .
51
6
Adjusted algorithm for stability measure using two data sets as perturbation method
56
1
C HAPTER O NE
I NTRODUCTION
‘But do you know that, although I have kept the dairy for months past, it never once struck me how I was going to find any particular part of it in case I wanted to look it up?’ - Dr Seward, Bram Stoker’s Dracula, 1897
1.1 TOPIC MODELS Vast amounts of electronic data are available, including news articles, scientific articles, newsgroup entries, emails and social network artifacts. The size of these data sets grow every day, making it increasingly difficult to make sense, and extract useful information from such information sources. The data sets are typically unstructured, unlabelled and dynamic in nature. This has stimulated the development of novel processing techniques in order to extract, summarise and understand the information contained therein. The objective of these techniques is to transform large amounts of text data into understandable and navigable information. In many text mining applications, no or little prior knowledge is available about the content of the text data (Newman et al., 2006) which calls for unsupervised techniques with the goal of structuring and associating related text sources. When we think of a text corpus as a collection of documents, it makes sense that each document 2
C HAPTER O NE
I NTRODUCTION
has an underlying semantic context. This semantic context develops as the document is generated and refers to the intended meaning of the document. For example, a newspaper article may have the purpose of reporting on a news event and as we read the article, we become aware of the intended message the author is hoping to communicate. Coherent text can be thought of as text (such as documents) with similar semantic context. Although the semantic context is hidden, it is represented in the words of a document. Topic modelling is a technique for the unsupervised analysis of large document collections. The fundamental assumption of topic models is that the semantic context of a document is a mixture of topics (Griffiths et al., 2007). The topics are shared across the corpus by various documents and a topic is defined as a distribution over the vocabulary set of the document collection. Topic models infer document-topic associations, or clusters. These clusters are probabilistic in nature each document exhibits a probability of being assigned to a topic. The most successful topic models are generative models, using the assumption that documents are generated from a mixture of latent topics. Generative models consider documents as a mixture of topics and can handle unseen (new) documents by predicting their similarity to other documents. In other words, these models predict where a new document fits into the existing corpus of documents (Blei et al., 2003). A variety of topic models with different generative assumptions about how the documents are generated have been proposed. While the models make different generative assumptions, the typical latent space created by topic models can be described as a collection of topics for the corpus and a collection of topic probabilities for each document in the corpus (Chang et al., 2009). The quality of the latent topic space is important for two reasons: Firstly, it associates unseen documents with existing documents and predicts latent similarities, thereby exhibiting its predictive abilities. Secondly, it summarises the corpus with a set of topics, thereby exhibiting its exploratory abilities. When measuring the predictive abilities of a topic model, perplexity is an appropriate measure. It provides an indication of the model’s ability to generalise by measuring the exponent of the mean log-likelihood of words in a held-out test set of the corpus. The exploratory abilities of the latent topic space are generally measured by means of human interpretation. This is done by examining the top-n words in a topic and (rather subjectively) assigning a label to the topic. For example, a topic with ‘movie’, ‘director’, ‘actor’ and ‘film’ as the top-4 words can be labelled as ‘movie industry’. The more descriptive the words with high probabilities in the topic, the easier it is to understand the gist of the topic. S CHOOL OF E LECTRICAL , E LECTRONIC AND C OMPUTER E NGINEERING
3
C HAPTER O NE
1.2
I NTRODUCTION
BAG-OF-WORDS APPROACH
A bag-of-words approach is commonly adopted for topic models which means that documents are treated as a collection of words, ignoring the structure of the document. The core of the bag-ofwords approach is a word × document frequency matrix where cellij represents the frequency of wordi in documentj . For the application of topic models to text corpora, documents represent samples and the vocabulary items (unique words) represent the features of the model. The result is a high dimensional, data sparse feature space which poses inference challenges to the topic model. Furthermore, the visualisation of single words in the top-n terms of a topic can be difficult to interpret. As an alternative, more complicated models that include n-grams have been considered, but then the statistical simplicity and computational advantage of bag-of-words topic models are lost (Blei and Lafferty, 2009). In this thesis, we follow a bottom-up approach in improving the quality of the latent space inferred by a topic model. Instead of complicating the topic model by adding more variables, we argue that meaningful structuring of words, or features into concepts increases the quality of the latent topic space inferred by topic models. We investigate different methods to structure features, focusing on the field of Natural Language Processing (NLP) to guide these structure designs. Structuring of features changes the dimension size of the input vector to the model, thus disabling traditional performance measures such as perplexity. We therefore propose an evaluation framework with alternative measures that act more consistently across parameter dimension size to compare the quality of the modified latent topic space with the traditional single term output of topic models. At the core of the evaluation framework is stability-based validation - a technique that evaluates the model’s ability to replicate similar clustering solutions.
1.3
OVERVIEW OF THE THESIS
The research question defining the study is two-fold: • Can the performance of topic models be improved by relaxing the bag-of-word assumption using a feature-clustering technique? • How can multiple aspects of performance of topic models be measured consistently across parameter dimension size and topic model algorithms? S CHOOL OF E LECTRICAL , E LECTRONIC AND C OMPUTER E NGINEERING
4
C HAPTER O NE
I NTRODUCTION
The thesis is structured as follows: • In Chapter 2 we provide an overview of topic models by means of four methods to illustrate and facilitate the comparison between them. We focus in detail on three topic models, namely Latent Dirichlet Allocation (LDA), Multinomial Mixture (MM) and GammaPoisson (GaP). • In Chapter 3 we describe the machine learning algorithms used to infer the latent space from generative assumptions made by topic models. • In Chapter 4 we sketch an evaluation framework for topic models. This evaluation framework is robust to changes in parameter dimension size of the input data. • In Chapter 5 we introduce processes to structure words into concepts that serve as alternative features in the input data set to topic models. • Experimenting with topic models in novel application areas such as digital forensics provide valuable analysis tools not yet explored in these environments. Chapter 6 illustrates and discusses the benefits of such applications. • In Chapter 7 we summarise the contribution of this thesis and discuss further applications and future work.
S CHOOL OF E LECTRICAL , E LECTRONIC AND C OMPUTER E NGINEERING
5
C HAPTER T WO
T OPIC M ODELS
2.1
INTRODUCTION
A common objective of models is to use trends or regularities in observed data to construct an appropriate representation which can be used with confidence to make predictions about future events. We may argue that the observed data is merely an effect (or symptomatic) of other processes and therefore we aim to approximate these processes to understand how the data was generated. In a model, parameters may represent the underlying processes and the model makes assumptions through these parameters in order to explain how the data was generated. The aim is to find the values for these parameters that best explain the observed data. The model may include hidden (latent) variables that interact through the parameters to generate the data (Beal, 2003). Topic models include latent variables in the form of semantics that interact with parameters to generate documents (data) (Blei et al., 2003). In this chapter we introduce topic models and compare the differences in generative assumptions between three topic models namely, Mixture of Multinomial, Latent Dirichlet Allocation (LDA) and Gamma-Poisson (GaP). Machine learning methods to find the values for parameters and latent variables for topic models are addressed in Chapter 3 as well as preliminary experimental results for illustration purposes.
6
C HAPTER T WO
T OPIC M ODELS
For the purpose of topic modelling, a large matrix is constructed from a text corpus made up from a number of distinct documents, with rows representing the documents and a column for each word in the corpus vocabulary (see figure 2.1). With this method, a document is represented as a high-dimensional vector which is typically sparsely populated with the counts of each word in the document. This representation of a text corpus is widely used with a number of clustering techniques, where documents are associated based on their semantic or ‘thematic’ similarity (Rigouste et al., 2007). ‘Thematic’ similarity or meaning is extracted by applying statistical computations on the large document × word matrix (Landauer and Dumais, 1997). Many approaches to text clustering exist (see Hofmann (1999); Blei et al. (2003); Landauer et al. (2007); Rigouste et al. (2007) and Buntine and Jakulin (2005)) and each one of them has a different set of assumptions of how the documents in a text corpus were generated. We focus on probabilistic approaches that result in probabilistic topic-document association (Rigouste et al., 2007) by assuming a probabilistic generative process for documents. In this thesis, we focus on discrete text data. However, a much wider field of applications benefits from these approaches, such as collaborative filtering (Blei et al., 2003; Marlin and Zemel, 2004), genotype inference (Pritchard et al., 2000), various fields within the social sciences (Landauer et al., 2007) and content-based image retrieval (Blei et al., 2003).
2.2 2.2.1
BACKGROUND TF-IDF WEIGHTING SCHEME
The objective of information retrieval (IR) methods is to search text for relevant information and then rank documents according to user information queries (Rigouste et al., 2007). The tf-idf (term frequency-inverse document frequency) weight is often used in IR schemes and evaluates how important a word is to a document in a corpus (Salton and McGill, 1983), or the other way around how relevant a document is to a query. If we are presented with a word or query, the term frequency (tf) is simply the number of times the term occurs in each document of the corpus. This number is normalised suitably to prevent a bias towards larger documents. The inverse document frequency (idf) is obtained by dividing the number of all documents by the number of documents containing the term (on a log scale and normalised). Multiplying the two terms results in a document × term matrix where each cell is calculated as: (tf − idf )ij = tfi,j × idfi for term i and document j. S CHOOL OF E LECTRICAL , E LECTRONIC AND C OMPUTER E NGINEERING
7
C HAPTER T WO
T OPIC M ODELS
The tf-idf score identifies words that are discriminative for documents in a corpus. It can also be used together with cosine similarity to determine the similarity between two documents. It does not reduce the dimensionality of the feature space and offers limited information about interdocument statistical structure (Blei, 2004). 2.2.2
LATENT SEMANTIC ANALYSIS
Latent semantic analysis (LSA) compensates for these shortcomings by identifying a linear subspace in the space of tf-idf features that captures most of the variance in the corpus (Blei, 2004). It performs a singular value decomposition (SVD) on the document × term matrix (Landauer et al., 1998). The main idea of LSA is to reduce the feature space dimensionality to a non-sparse vector. This implies that document associations can be inferred even if they have no terms in common by mapping terms with common meaning to the same direction in the latent space (Hofmann, 1999). The limitations of LSA is that it uses the Frobenius norm as the objective function to determine the optimal decomposition, which corresponds to an implicit additive Gaussian noise assumption on the word counts (Hofmann, 1999). This is problematic if the word counts are small, as is the case with a typical document × term representation of text corpora. Furthermore, LSA is a dimensionality reduction algorithm and does not have a clear probabilistic interpretation (Hofmann, 1999; Blei, 2004). In fact, the approximation matrices may include negative numbers. 2.2.3 PROBABILISTIC LATENT SEMANTIC ANALYSIS With the probabilistic latent semantic analysis approach (pLSA), Hofmann (1999) developed a generative probabilistic alternative to LSA where entries in the approximation matrices are interpreted as probabilities. The pLSA models each word as a sample from a multinomial mixture of topics that results in words sampled from different topics in a single document (Blei, 2004). This differs from the multinomial mixture model that assumes that all words from a single document are drawn from a single topic. Although the pLSA accommodates the possibility that a document could be a mixture of topics, these topic distributions are only defined on the documents in the training set. Subsequently a large number of individual parameters linked to the training set only, are generated. This assumption creates two problems. Firstly, it makes it difficult to assign probabilities to unseen documents (Blei, 2004). Furthermore, there is a linear growth in parameter size
S CHOOL OF E LECTRICAL , E LECTRONIC AND C OMPUTER E NGINEERING
8
C HAPTER T WO
T OPIC M ODELS
with the growth in corpus size which leads to overfitting problems. 2.2.4
NON-NEGATIVE MATRIX FACTORISATION
Non-negative matrix factorisation (NMF) is an alternative dimensionality reduction technique that puts a non-negative constraint on the approximation matrices. NMF is a technique that approximates the word × document matrix into a product of non-negative factors (Lee and Seung, 2000). Gaussier and Goutte (2005) exhibit the relation between pLSA and NMF and showed that pLSA solves NMF with Kullback-Leibler (KL) divergence. The similarity between the two models is confirmed in Buntine and Jakulin (2005), where it is shown that NMF and pLSA are both instances of a unifying framework, namely discrete principal component analysis. The updating rules for NMF approximation are essentially an EM algorithm, which makes it prone to typical EM-associated problems such as convergence to local minima. Furthermore, the entries in the approximation matrices cannot be interpreted as probabilities. NMF is a precursor to the GammaPoisson (GaP) model that is discussed in detail in the next section. The GaP model computes a non-negative matrix factorisation for the document × word matrix. 2.2.5
LATENT DIRICHLET ALLOCATION
As discussed in the previous subsection, there are strong similarities between pLSA and NMF, which implies that NMF makes the same assumptions about topic distributions being defined over the documents in the training set only. The pLSA makes no assumption about the topic mixture weights for each document, and treats it as a distinct parameter for each training document (Blei, 2004). The Latent Dirichlet Allocation (LDA) model overcomes this problem by defining the topic mixture weights as a hidden random variable with T parameters where T is the number of topics. The prior on the topic mixture weights is a Dirichlet distribution. 2.2.6 DISCRETE PRINCIPAL COMPONENT ANALYSIS Buntine and Jakulin (2005) defined a unifying framework for methods that approximates large matrices by a product of smaller matrices. Topic models find a low-dimensional representation for the content of a corpus (expressed as a document × word matrix) and can therefore be defined as principal component analysis (PCA) methods with the goal of approximating a large matrix by
S CHOOL OF E LECTRICAL , E LECTRONIC AND C OMPUTER E NGINEERING
9
C HAPTER T WO
T OPIC M ODELS
a product of smaller matrices. However, the application of PCA to large sparse discrete matrices is difficult to interpret, because negative values are typically introduced in the topic × document matrix. Buntine and Jakulin (2005) defined Discrete PCA (DPCA) - a collection of topic models that places constraints on approximation matrices so that they are non-negative and avoids Gaussian modelling of the data. The models, pLSA, NMF, GaP and LDA can be described using the DPCA framework.
2.3
MODELS
In this section we address three particular topic models that approach the generative process for documents with different statistical assumptions. We express each one with four interpretation methods that highlight the differences between them. 2.3.1
TERMINOLOGY AND NOTATION
We define the following terms and their associated notations: • A corpus is a collection of M documents denoted by C = { w1 , w2 , . . . , wM }. • A word w is the basic unit of discrete data. • A document is a sequence or passage of N words denoted by wd = { w1 , w2 , . . . , wN }. • A vocabulary is subset of unique words (denoted by wl ) in the text corpus and indexed by {1, . . . ,V}. The second dimension of the document × word matrix is of size V. • We define T latent semantic components or topics to approximate the document × word matrix with and T ¿ V. • The bag-of-words representation of a document neglects word order and only stores the word count of the document. • The quantity Cwi d refers to the word count of word wi in document d. When relating this terminology to machine learning theory, a word is a feature, a bag is a data vector and a document is a sample, or data vector (Buntine and Jakulin, 2005).
S CHOOL OF E LECTRICAL , E LECTRONIC AND C OMPUTER E NGINEERING
10
C HAPTER T WO
2.3.2
T OPIC M ODELS
METHODS TO INTERPRET TOPIC MODELS
In order to interpret and subsequently distinguish between topic models, we will express them in four ways, namely generative processes, graphical models, matrix factorisation and document likelihood. Each one of these methods elucidates a different aspect of latent variable, or topic models. In this subsection, we briefly introduce the four methods to interpret topic models. 2.3.2.1
GENERATIVE PROCESSES
The general idea of topic models in the probabilistic context, is that documents are mixtures of topics and a topic is a probability distribution over words (Griffiths and Steyvers, 2007). Topic models result in two outputs, namely a topic × document matrix and a word × topic matrix. Topic models are generative models for documents which means that generative assumptions about documents are made and then inferred in order to produce the above-mentioned two matrices. More specifically, generative models are based on sampling rules that describe the generation of words in documents (observable data), based on their interaction with topics (latent variables) (Griffiths and Steyvers, 2007). The generative process defines the document likelihood for all the observed data and latent variables. 2.3.2.2
GRAPHICAL MODELS
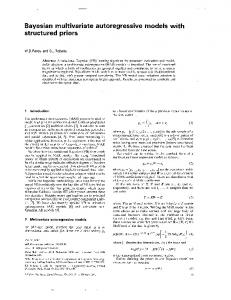
Generative models can be described graphically using directed graphs, or graphical models. In a graphical model, variables are represented by nodes, dependencies between variables by edges and replication by plates (Blei, 2004). Plates may be nested within other plates. In our representation, observable nodes are shaded and latent variables are shown in white. Graphical models are useful in describing latent variable models, such as topic models, because they make the interaction between observable and latent variable models visible. For example, Figure 2.2 is the graphical model representation of the de Finetti theorem (Jordan, 2004). The variables ZN are conditionally independent and identically distributed given the (hidden) variable θ. The plate indicates N repetitions.
S CHOOL OF E LECTRICAL , E LECTRONIC AND C OMPUTER E NGINEERING
11
C HAPTER T WO
T OPIC M ODELS
Figure 2.1: Document × Word Matrix
Figure 2.2: Graphical model of the de Finetti theorem
S CHOOL OF E LECTRICAL , E LECTRONIC AND C OMPUTER E NGINEERING
12
C HAPTER T WO
2.3.2.3
T OPIC M ODELS
MATRIX FACTORISATION
A topic model can be interpreted as a factor model: The document × word matrix is split into a topic × document matrix and a word × topic matrix (Griffiths and Steyvers, 2007). Figure 2.3 represents the matrix factorisation interpretation of topic models. The two matrices on the right hand side of the equation are probability distributions across columns. The first matrix captures the global corpus topic information and the second matrix captures the topic weights for each document. 2.3.2.4
DOCUMENT LIKELIHOOD
As mentioned earlier, the generative process, or model of the data defines a probability distribution over the data, or documents, p(w|θ). When latent variables are introduced in the generative model, as is the case with topic models, then the probability of a document becomes p(w|θ) =
X
p(w, z|θ) =
X
z
p(z|θ)p(w|z, θ),
(2.1)
z
where θ represents the model parameters and z the latent variables. The quantity in 2.1 is referred to as the incomplete-data likelihood because when latent variables are introduced in the model, the observed data is an incomplete account of the model (Beal, 2003). The corpus likelihood L(θ) is the product over all document likelihoods and the logarithm of this quantity is important for a number of reasons that will become clear in chapter 3.
L(θ) =
M Y
p(w|θ)
(2.2)
log p(w|θ)
(2.3)
d=1
log L(θ) =
M X d=1
2.3.3
MULTINOMIAL MIXTURE
In the multinomial mixture model, we assume that the distribution of words in the document depends on the value of a single topic associated with the document (Rigouste et al., 2007). Each document is generated by first choosing a topic from a mixture of multinomial distributions and
S CHOOL OF E LECTRICAL , E LECTRONIC AND C OMPUTER E NGINEERING
13
C HAPTER T WO
T OPIC M ODELS
then generating words independently from the multinomial distribution associated with that topic (Blei, 2004). Therefore, each document exhibits exactly one topic. The multinomial mixture assumes the following generative process for documents in the corpus C (Rigouste et al., 2007): For each document w = 1, . . . ,M 1. Choose a topic zd ∼ Multinomial(α) 2. Choose N words ∼ Multinomial(βzd ) The likelihood of a document is (Rigouste et al., 2007):
p(w|α, β) =
T X k=1
αk
V Y
Cw
βlk l .
(2.4)
l=1
In figure 2.4, the N-plate represents the document length (number of words) for each document and the T-plate represents the number of topics. We set independent noninformative Dirichlet priors on α and the columns βk . The parameter α represents the corpus topic mixture. The Dirichlet prior is chosen because of its conjugacy to the multinomial distribution, a property which is instrumental in simplifying the statistical inference problem (Rigouste et al., 2007). The mixture weight matrix θ is created by calculating the posterior probability that a topic k was observed in document d. This will be addressed in chapter 3. 2.3.4 LATENT DIRICHLET ALLOCATION The basic idea of LDA is that a document is represented as a random mixture over latent topics and a topic is a distribution over words in the vocabulary. LDA assumes that the mixture of topics for a document originates from a Dirichlet distribution and assigns a Dirichlet prior to the mixture of topics for a document. As with the multinomial mixture model, the Dirichlet prior is a mathematically convenient choice (Blei et al., 2003). LDA assumes the following generative process for documents in a corpus C (Blei, 2004): For each document w = 1, . . . ,M 1. Choose θ ∼ Dirichlet(α), θ and α are of dimension T. 2. For each word wi in the document, (a) Choose a topic zi ∼ Multinomial(θ). S CHOOL OF E LECTRICAL , E LECTRONIC AND C OMPUTER E NGINEERING
14
C HAPTER T WO
T OPIC M ODELS
(b) Choose a word wi ∼ Multinomial(βzi ). β is a V × T matrix. The document likelihood for LDA is: !Ã N T V ! P Z ÃY T YXY Γ( k αk ) αk −1 C w p(w|α, β) = Q θk (θk βlk ) l dθ k Γ(αk ) k=1
(2.5)
i=1 k=1 l=1
In figure 2.5 the plate surrounding θ indicates that θ is a document level variable (with M replications) and the plate surrounding z and w indicates that they are word-level variables (with N replications). The plate surrounding β indicates that one topic must be chosen from T topics. The parameter β indicates which words are important for which topic and θ indicates which topics are important for a particular document (Griffiths and Steyvers, 2007). 2.3.5 GAMMA-POISSON Canny (2004) introduces the Gamma-Poisson model (GaP) that uses a combination of Gamma and Poisson distributions to infer latent topics. It presents an approximate factorisation of the document × word matrix with matrices β and X (see figure 2.6). The word × topic matrix β represents the global topic information of the corpus C and each column βk can be thought of as a probability distribution over the corpus vocabulary for a specific theme k. Each column xd in the topic × document matrix X represents the topic weights for the document d. The Gamma distribution generates the topic weights vector xd in each document independently. The Poisson distribution generates the vector of observed word counts n from expected counts y. The relation between xd and y is a linear matrix y = βxd . The topic weights xd represent the topic content for each document and encodes the total length of passages about topic k in the document. GaP contrasts with LDA in the sense that LDA choose topics independently per word in a document, according to the Dirichlet distribution (Canny, 2004). GaP assumes the following generative process: For each document wd = 1, . . . , M 1. Choose xd ∼ Gamma(a,b) 2. For each word wi = 1, . . . , N • Generate nwi ∼ Poisson(βxd )
S CHOOL OF E LECTRICAL , E LECTRONIC AND C OMPUTER E NGINEERING
15
C HAPTER T WO
T OPIC M ODELS
Figure 2.3: Matrix factorisation of the topic model
Figure 2.4: Multinomial Mixture graphical model
Figure 2.5: LDA graphical model
S CHOOL OF E LECTRICAL , E LECTRONIC AND C OMPUTER E NGINEERING
16
C HAPTER T WO
T OPIC M ODELS
Figure 2.6: Matrix factorisation of GaP
Figure 2.7: GaP graphical model
The Gamma distribution has two parameters: The first parameter a is called the shape parameter and the second parameter b is called the scale parameter. The mean value of xk is ck = ak bk (Canny, 2004). When substituting bk with ck /ak , the likelihood of a document is:
p(w|X, β) =
T V Y yl Cwl exp(−yl ) Y xk ak −1 ak ak exp(−xk ak /ck ) Cwl ! ck ak Γ(ak ) l=1
(2.6)
k=1
The plates in figure 2.7 further illustrates topics as passages of text in a document, as the xd parameter does not lie within the N-plate.
2.4 CONCLUSION In this chapter we described and utilised four methods to illustrate topic models and facilitate the comparison between them. We then expressed three topic models, multinomial mixture, LDA and GaP, each with different generative assumptions. The most salient differences between the models are generative assumptions on document level and topic independence in or across documents: • The multinomial mixture does not have a generative process for documents and therefore, each document exhibits exactly one topic, which could penalise large document collections. LDA and GaP both have a generative process on document level which is clear in their respective graphical models that contains θ and X parameters in the document plate (figures 2.4 and 2.5). • LDA samples each word in a document individually from a topic whereas GaP samples
S CHOOL OF E LECTRICAL , E LECTRONIC AND C OMPUTER E NGINEERING
17
C HAPTER T WO
T OPIC M ODELS
passages of text in a document from a topic. GaP normalises topic weights over all documents whereas LDA normalizes over all topics per document (Nallapati et al., 2007). GaP makes the assumption that topics in a document are independent of one another, which is not a realistic assumption to make. Because of the independence assumption implicit in the Dirichlet distribution, LDA is unable to capture correlations between different topics. LDA is modular and can therefore easily be extended to capture additional information in the data. Models that capture topic correlation include the correlated topic model (CTM) (Blei and Lafferty, 2006a) and the pachinko allocation model (PAM) (emulating the Japanese pachinko gambling game) (Li and McCallum, 2006). The CTM calculates correlation between underlying topics inferred from a text corpus. In Blei and Lafferty (2006a), topics are inferred from the online scholarly journal JSTOR. If a research article falls into a certain topic, knowledge about other topics highly correlated to this topic will certainly come in handy. It could lead to the discovery of other relevant research articles that would otherwise not have been associated with the current article. The CTM captures the correlation between pairs of topics, whereas the PAM has a more flexible structure to capture correlation between multiple topics. The topic models discussed so far treat the number of topics as a fixed number, rather than a random variable. Non-parametric variations on topic models treat the number of topics as a random variable and estimate this value by including it in the generative process. The hierarchical Dirichlet process model automatically discovers the number of topics in text collections (Teh et al., 2006). Temporal information in corpora has been included in the following topic models: Topics over Time (ToT) (Wang and McCallum, 2006), Dynamic Topic Models and Multiscale Topic Tomography. Dynamic Topic Models (DTM) infer sequential topic models from text, modelling the evolution of topic content and topic occurrence. For example, the topic ‘atom physics’ was dominated by words such as ‘force’, ‘energy’, ‘motion’ and ‘light’ in 1881 whereas words like ‘state’, ‘electron’, ‘magnet’ and ‘quantum’ describe the topic in the year 2000 (Blei and Lafferty, 2006b). DTM uses a logistic-normal prior on the topic multinomial probability distribution, whereas Multiscale Topic Tomography (MTTM) (Nallapati et al., 2007) uses a Poisson prior to model word counts. In the remainder of this thesis, we will not be considering the temporal dimension explicitly, though our techniques could certainly be used for such applications as well.
S CHOOL OF E LECTRICAL , E LECTRONIC AND C OMPUTER E NGINEERING
18
C HAPTER T WO
T OPIC M ODELS
In the next chapter, we investigate appropriate learning algorithms for extracting topics from text corpora for multinomial mixture, LDA and GaP.
S CHOOL OF E LECTRICAL , E LECTRONIC AND C OMPUTER E NGINEERING
19
C HAPTER T HREE
L EARNING
3.1
INTRODUCTION
In chapter 2, we compared three topic models that each results in a probability distribution over documents. The variables of interest for each one of these models are the word × topic (β) and topic × document (θ or X) distributions and the main task in topic modelling is that of estimating these variables. The process of estimating variables and finding parameter settings from observed data is termed learning a model. In this chapter three machine learning methods suited for topic models are addressed. We illustrate the main computational detail for each one of them, by means of one or more of the topic models discussed in chapter 2. In this section we briefly introduce maximum likelihood and Bayesian learning methods in order to give some perspective on the approximation techniques incorporated in the machine learning algorithms. 3.1.1 MAXIMUM LIKELIHOOD LEARNING Given the probability distribution p(w|θ), the maximum likelihood approach to fitting the parameters θ is to find the settings for them that maximises the likelihood, which is the probability of the observed data given the model. When latent variables z are introduced into the model, the
20
C HAPTER T HREE
L EARNING
likelihood becomes p(w|θ) =
X
p(z|θ)p(w|z, θ)
(3.1)
z
Using Bayes’ rule, the conditional distribution of the latent variables, given the observed data becomes
p(z|w, θ) =
p(z|θ)p(w|z, θ) p(w|θ)
(3.2)
In order to maximise the likelihood, the Expectation-Maximisation (EM) algorithm is used to iteratively calculate the posterior distribution over the latent variables (3.2), given a specific setting of the model parameters (θ) and then again re-estimating θ with settings that maximises the likelihood (Russell and Norvig, 2003). The output of the EM algorithm is a point estimate for θ and a probability distribution over the latent variables. 3.1.2 BAYESIAN LEARNING Following the Bayesian approach to learning, the model parameters are treated as random variables. In this case we calculate a posterior probability distribution for the parameters after assuming a prior distribution that governs their likely values in the absence of data. In this approach, distributions must be specified for the parameters, and these distributions must have parameters themselves, called hyper parameters (Blei, 2004). An alternative to the full Bayesian approach is the empirical Bayesian approach where a prior distribution over the model parameters is specified, but a point estimate of the model parameters is obtained by means of the EM algorithm. The difference between maximum likelihood and full Bayesian methods is that Bayesian methods attempt to integrate over all possible settings of all unknown quantities in the model, rather than to optimise them (Beal, 2003). This is needed in order to obtain the posterior distribution rather than a point estimate. So, instead of working with the conditional probability distribution (3.1), we need to integrate out the hidden variables as well the parameters in order to obtain the marginal likelihood for the data: Z p(w) =
dθp(θ)
X
p(z|θ)p(w|z, θ)
(3.3)
z
Unfortunately, the marginal likelihood is rarely tractable and needs to be approximated.
S CHOOL OF E LECTRICAL , E LECTRONIC AND C OMPUTER E NGINEERING
21
C HAPTER T HREE
L EARNING
Laplace approximation is an example of the numerical approximation of (3.3). Stochastic approximation methods are based on sampling from the posterior distribution of (3.3) (Gelman et al., 2003). Another method of approximation is variational Bayes, which calculates the lower bound on the marginal likelihood (for Bayesian learning) or likelihood (for point estimation) and optimises the bound in an EM fashion (Mackay, 2002; Beal, 2003).
3.2
THE EXPECTATION-MAXIMISATION ALGORITHM
This section illustrates the application of the EM algorithm to the multinomial mixture and GaP topic models. 3.2.1
MULTINOMIAL MIXTURE
Rigouste et al. (2007) examined the EM algorithm as a maximum likelihood inference tool for the multinomial mixture and found that it is prone to high performance variability. Furthermore, the performance depends greatly on initialisation of variables and vocabulary size. For estimating θ and β for the multinomial mixture model, the EM algorithm has the following update equations (Rigouste et al., 2007): E-step:
QN
ni i=1 βik QN ni i=1 βik k=1 αk
(3.4)
P (Tj = k|C, α, β)
(3.5)
ni P (Tj = k|C, α, β)
(3.6)
θk
P (Tj = k|C, α, β) = PT M-step:
αk
∝ λα − 1 +
M X j=1
βik
∝ λβ − 1 +
M X j=1
The normalising factors are found from the constraints
PT
k=1 αk
= 1 and
PV
i=1 βik
=
1 for k in 1, . . . , T . Equation (3.4) calculates the probability of a topic in a document and forms the rows of the topic × document matrix, θ (see figure 2.3 in chapter 2) and we will refer to the quantity in equation (3.4) as θd . The parameters λα − 1 and λβ − 1 are smoothing parameters. Rigouste et al. (2007) indicated that the tuning of the smoothing parameters is not a major influence on S CHOOL OF E LECTRICAL , E LECTRONIC AND C OMPUTER E NGINEERING
22
C HAPTER T HREE
L EARNING
the performance of the model and set them to 0 and 0.1, respectively. They further argue that initialising the parameter values α and β requires realistic values for a large number of parameters and suggests initialising the EM iterations from the M-step. The EM scheme for the multinomial mixture model is summarised in algorithm 1. 3.2.2 GAP Canny proposes an EM algorithm to estimate X and β with the following update equations (Canny, 2004): E-step: Xkj = Xkj
µX N i=1
M-step: βlk = βlk
Fij ak − 1 βik + Yij Xkj µX M j=1
Fij Xkj Yij
¶Áµ X V l=1
¶Áµ X M
ak βlk + ck
¶ (3.7)
¶ Xkj
(3.8)
j=1
The numerator of equation 3.7 only sums over the terms in a document, whereas the denominator of the same equation sums over the terms of the corpus vocabulary. Canny proposes setting the Gamma shape parameter a to 1.1 as this promotes independence between the factor components xk , which supports the assumption that topics in a document occur independently (Canny, 2004). Nallapati et al. (2007) points out that the EM algorithm scheme developed by Canny optimizes the complete-data likelihood and not the incomplete-data likelihood (observed data only), as should be the case with a pure generative model. This can be seen in the M-step of the EM algorithm that contains the hidden variable X. The GaP EM algorithm is illustrated in algorithm 2.
3.3 VARIATIONAL METHODS FOR BAYESIAN LEARNING We now revisit the scenario of fitting parameters θ to observed variables w, interacting with hidden variables Z. Following a fully Bayesian approach to learning, we treat the parameters as random variables and the log-likelihood of data w, assuming a model m, is:
L ≡ ln p(w|m) = log
Z X
p(θ, w, z|m).
(3.9)
z
Treating the parameters as unknown quantities induces dependencies between the parameters
S CHOOL OF E LECTRICAL , E LECTRONIC AND C OMPUTER E NGINEERING
23
C HAPTER T HREE
1 2 3 4 5 6 7 8
L EARNING
Input: document × word matrix Output: α, β, θ Initialise θj for each document; Calculate α and β from equations (3.5) and (3.6); for each document j do calculate θj from equation (3.4); P Q cntwi calculate document log-likelihood log( Tk αk N ); i=1 βi end Update α and β and normalise appropriately; Report on corpus log-likelihood and repeat, starting at step 3; Algorithm 1: Multinomial Mixture EM algorithm
1 2 3 4 5 6 7 8 9 10
Input: document × word matrix, a (fixed) Output: X, β Initialise Xj for each document and normalise over document length; Initialise β randomly; Calculate denominator of equation (3.7); for each document j do calculate Xj from equation (3.7) and normalise over document length; calculate bracket term in numerator of (3.8) ; calculate document log-likelihood from (2.6); end Update β from (3.8); Report on corpus log-likelihood and repeat, starting at step 4; Algorithm 2: GaP EM algorithm
S CHOOL OF E LECTRICAL , E LECTRONIC AND C OMPUTER E NGINEERING
24
C HAPTER T HREE
L EARNING
and hidden variables which makes maximising (3.9) difficult. The integral in (3.9) is intractable for many interesting models. Variational methods use an auxiliary distribution over both hidden variables and parameters to maximise the likelihood. Any probability distribution q(z, θ) over the hidden variables and parameters gives rise to a lower bound on the likelihood, using Jensen’s inequality (Beal, 2003). Jensen’s inequality states that if f is a convex function and x is a random variable then: E[f (x)] ≥ f (E[x]). where E denotes expectation. If f is a concave function (as is the case with the log function), then the direction of the inequality is reversed (Mackay, 2002) and is used to bound the log likelihood in (3.9) as follows (Blei et al., 2003):
L = log
Z X
p(θ, w, z|m)dθ
(3.10)
z
Z X p(θ, w, z|m)q(θ, z) dθ = log q(θ, z) z Z X Z X q(θ, z) log q(θ, z)dθ q(θ, z) log p(θ, w, z|m) − ≥
(3.11) (3.12)
z
z
= E[log p(θ, w, z|m)] − E[log q(θ, z)]
(3.13)
Maximising this lower bound with respect to the free distribution q(θ, z) results in q(θ, z) = p(θ, z|, w, m). For the posterior distribution p(θ, z|, w, m) to be evaluated, its normalisation constant needs to be known, which does not simplify the problem (Blei et al., 2003). Approximating the posterior with its factorised version q(θ, z) ≈ q(θ)q(z) provides a simpler solution. In order for q(θ)q(z) to be helpful in maximising L, it must be restricted to a parametric family such that optimising the bound (3.13) is tractable (Blei and Jordan, 2004). In the case of mean field variational methods, each q(z) is fully factorised over the hidden variables (Beal, 2003). 3.3.1
LATENT DIRICHLET ALLOCATION
The graphical model representation of LDA in figure 2.5 clearly indicates the dependency between the parameters θ and β. Introducing free variational parameters γ and φ for the parameter θ and hidden variables z, the variational distribution on the latent variables becomes (Blei et al., 2003):
q(θ, z|γ, φ) = q(θ|γ)
N Y
q(zn |φ)
(3.14)
n=1
S CHOOL OF E LECTRICAL , E LECTRONIC AND C OMPUTER E NGINEERING
25
C HAPTER T HREE
L EARNING
and the update equations for γ and φ in order to maximise the lower bound in (3.13) is (Blei et al., 2003):
φlk γk
1 βlk exp{Eq [log(θk )|γ]} Zl V X = αk + φlk ∝
(3.15) (3.16)
l=1
µX ¶ T Eq [log(θk )|γ] = Ψ(γk ) − Ψ γk Zl
=
X
(3.17)
k=1
βlk exp{Eq [log(θk )|γ]}
(3.18)
k
In order to estimate the parameters α and β, Blei et al. (2003) suggest an empirical Bayes method. The summand in the log likelihood of the data (equation 2.5) is not tractable, but the lower bound as used in the variational inference procedure is tractable. This enables us to find approximate empirical Bayes estimates for the LDA model as follows (Blei et al., 2003): 1. For each document, find the values for γ and φ that maximise the lower bound of the loglikelihood. 2. For fixed values of γ and φ, maximise the lower bound with respect to α and β. This corresponds to finding maximum likelihood estimates by accumulating expected sufficient statistics for each document d: φni wi . The two steps described above form an iterative process until convergence on the lower bound is reached and can be described as an alternating variational EM process (Blei et al., 2003). The update equations for the E-step are (3.15) and (3.16). The update equation for the M-step for the parameter β is:
β∝
M X V X
φlk(d) Cwl (d) ,
(3.19)
d=1 l=1
as is proved by Blei et al. (2003). The Dirichlet parameter α can be updated using the NewtonRaphson method as described by Blei et al. (2003) and Gelman et al. (2003). The variational EM algorithm for the LDA is illustrated in algorithm 3. S CHOOL OF E LECTRICAL , E LECTRONIC AND C OMPUTER E NGINEERING
26
C HAPTER T HREE
3.4
L EARNING
GIBBS SAMPLING
The variational EM algorithm for the LDA topic model is an empirical Bayes approach that finds maximum a posteriori (MAP) estimates for the model parameters α and β. A fully Bayesian approach seeks to find a posterior distribution (with hyperparameters) for the model parameters. One approach is to directly estimate the posterior distribution over the hidden variable z, given the observed words w. The model parameters α and β need to be marginalised out of the posterior distribution (Griffiths and Steyvers, 2007). A special form of the Gibbs sampler algorithm, the Rao-Blackwellised Gibbs sampling, was implemented by Griffiths and Steyvers (2007) to extract topics from a text corpus (with LDA assumptions). The basic Gibbs sampler for LDA is described in Blei et al. (2003) and Rigouste et al. (2007) and for discrete component analysis in Buntine and Jakulin (2005). The Gibbs sampler is reported to converge more slowly than variational methods and it is difficult to assess wether the chain did actually converge, whereas variational methods have a clear convergence criterion given by the bound in (3.13) (Blei et al., 2003; Blei and Jordan, 2004).
3.5
DETERMINING THE NUMBER OF TOPICS
The decision on the number of topics depends on the objective of the topic modelling exercise. In some situations, the end user of the topic model may insist on a desired number of topics to be inferred from the text corpus. The approximation matrices of the document × word matrix are often used as input features in classification tasks. For example, the document × topic matrix is used as the feature matrix to classify the documents of a labelled corpus using a classifier such as a support vector machine (SVM). The topic model is thus measured in terms of the quality of features that it produces. The performance of the classifier can then be used to determine the optimal number of topics. In exploratory investigations, topic models are utilised to infer topics from an unknown corpus. In this situation no prior knowledge exists about the ‘natural’ number of topics contained in the corpus. In this case perplexity can be calculated on held-out documents in the corpus. Perplexity calculates the per-word average likelihood of held-out documents. Comparing perplexity for different numbers of topics can assist to decide on the optimal number of topics. However, perplexity gives an indication of the model’s ability to generalise and predict unseen documents. S CHOOL OF E LECTRICAL , E LECTRONIC AND C OMPUTER E NGINEERING
27
C HAPTER T HREE
L EARNING
It will not measure other notions like topic quality or topic similarity. Bayesian non-parametric methods can be used to infer the number of topics as a variable during the modelling process. Even though this eliminates the need to choose a fixed number of topics, hyper parameters still need to be chosen which will also affect the results (Blei, 2009).
3.6
INTERPRETATION OF TOPIC MODEL OUTPUTS
The two output matrices on the right hand side of the equation in figure 2.3 provide information to interpret the topics extracted from the text corpus. The first matrix provides information about the topics themselves, and the second matrix provides information about the document clusters. 3.6.1
TOPICS
The mixture components matrix β assigns probabilities to each word-topic combination. The words with high probabilities assigned to them for a particular topic give a good description of the topic. Table 3.1 is an example of two topics, displaying the top-10 words of each topic. These topics were inferred from the Associated Press (AP) corpus (Harman, 1992) using a 100-topic LDA model. 3.6.2 2-D DOCUMENT MAP The mixture weights matrix, θ, assigns probabilities to each topic-document combination. Documents with similar mixture weights are closely related in terms of semantic context. This ‘relatedness’ of documents can be visualized in a 2D map. For each document pair, the symmetrised Kullback-Leibler divergence between topic distributions is calculated. (The Kullback-Leibler divergence is a measure of difference between two probability distributions (Mackay, 2002).) Classical multidimensional scaling is used to visualize the distances between documents in a 2D map. Figure 3.1 illustrates the 2D visualisation of a document collection where each square represents a document. The graph can be interpreted as follows: document A (indicated by square A in Figure 3.1) are closely related to document B in terms of their respective mixture of topics (semantic context). Documents A and C differ significantly in terms of semantic context.
S CHOOL OF E LECTRICAL , E LECTRONIC AND C OMPUTER E NGINEERING
28
C HAPTER T HREE
1 2 3 4 5 6 7 8 9 10 11 12 13 14 15 16
L EARNING
Input: document × word matrix Output: α, β,γ initialise α randomly and normalise ; for each document d = 1 : M do initialise γk0 = 1/T for all k; repeat for each unique word l = 1 : V do for each topic k = 1 : T do P 1 φt+1 lk = Zl βlk exp(Ψ(γk ) − Ψ( k γk )) end normalise γkt+1 end P γ t+1 = α + l φlk Cwl until convergence ; end P PV update β ∝ M d=1 l=1 φlk(d) Cwl (d) ; update α with Newton-Raphson method ; Report on corpus log-likelihood and repeat, starting at step 3; Algorithm 3: LDA variational EM algorithm
Table 3.1: Two topics from AP data set Topic 4 late dollar new york london yen gold bid friday market
Topic 14 water miles saudi two area base ship gulf launch arabia
S CHOOL OF E LECTRICAL , E LECTRONIC AND C OMPUTER E NGINEERING
29
C HAPTER T HREE
3.7
L EARNING
EXPERIMENTS
We studied the performance of the multinomial mixture and LDA on two text corpora. Preprocessing was performed on the data sets to remove a list of stop words (Salton (1999)) and words occurring only once in the corpus. Section 5.3 gives an overview of standard data preprocessing tasks. The Cranfield collection (CRAN) of aerodynamic abstracts has 1397 documents and a vocabulary of size 4437. A subset of the Reuters-21578, distribution 1.0 newswire articles (Reuters) contains 6600 documents with 15822 unique terms. The model parameters were fitted on 80% of the data and we tested the performance with perplexity on a 20% held-out test set. We created 10 folds of training and test sets for 10 topic dimensions. For each fold, the initial conditions of the topic model were reset. The perplexity results for the CRAN and Reuters corpora are illustrated as box plots in figures 3.2 and 3.3. (A lower perplexity indicates better performance.) These results indicate that LDA outperforms multinomial mixture on all folds, especially at higher topic dimensions. An interesting observation is that the perplexity achieved with the multinomial mixture remains fairly constant over the number of topics modelled. This may be due to the fact that multinomial mixture behaves as a deterministic ‘clusterer’ for documents: After only a few iterations, deterministic values of ‘0’ and ‘1’ are assigned to the posterior distribution θd and the log-likelihood converges very quickly. Hence, additional topics do not give much additional modelling power to the mixture model. This phenomenon was also reported in Rigouste et al. (2007). All algorithms were implemented from first principles in Matlab.
3.8
CONCLUSION
In this chapter we addressed the process of extracting topics from document collections for three topic models: multinomial mixture, LDA and GaP. Two suitable machine learning approaches for topic modelling are maximum likelihood and Bayesian learning methods. Latent variables in topic models sometimes introduce coupling between parameters which could be a problem when maximising the data likelihood. In this case approximation methods provide a solution, either by introducing auxiliary variables (as is the case with variational methods), or sampling directly from the posterior distribution (with Markov Chain Monte Carlo methods Gelman et al. (2003)). The standard EM algorithm is only suitable for the multinomial mixture model, but the latent S CHOOL OF E LECTRICAL , E LECTRONIC AND C OMPUTER E NGINEERING
30
C HAPTER T HREE
L EARNING
A B
C
Figure 3.1: 2-D document map
1300
mult mixture
1200
perplexity
1100 1000 900 800 700
lda 600 500 10
20
30
40
50 60 70 number of topics
80
90
100
Figure 3.2: Perplexity results for CRAN data
S CHOOL OF E LECTRICAL , E LECTRONIC AND C OMPUTER E NGINEERING
31
C HAPTER T HREE
L EARNING
2200
2000
mult mixture
perplexity
1800
1600
1400
1200
LDA
1000
800
10
20
30
40
50 60 70 number of topics
80
90
100
Figure 3.3: Perplexity results for Reuters data variables in LDA and GaP are coupled and the only way to apply a standard EM is to include the hidden variables in the likelihood (Buntine and Jakulin, 2005). This was done for GaP in Canny (2004) and Canny further suggested to fix one of the parameters, a in order to achieve a desirable outcome. Variational EM algorithms have been developed for the exponential family (of which LDA and GaP are part) (Blei et al., 2003; Buntine, 2002). Algorithm 3 illustrates a variational EM procedure for LDA. Other inference methods for topic models not addressed in this chapter are annealed maximum likelihood (Hofmann, 1999) and expectation propagation (Minka and Lafferty, 2002). Of all the combinations of models and learning algorithms, the variational EM algorithm for LDA produces the most desirable outcomes: it converges quickly and the perplexity results are good (only Rao-Blackwellised Gibbs learning produces slightly better perplexity results (Buntine and Jakulin, 2005)) and less variable than those of the multinomial mixture. Given the fact that GaP optimises the complete-data likelihood rather than the incomplete-data likelihood does not make it suitable for further experimentation. The GaP EM updating equations
S CHOOL OF E LECTRICAL , E LECTRONIC AND C OMPUTER E NGINEERING
32
C HAPTER T HREE
L EARNING
behave in an unstable fashion and are highly dependent on the initialisation conditions. For the purpose of the research reported in this thesis, we compare the performance of LDA and multinomial mixture. These two models have completely different assumptions. The multinomial mixture makes the assumption that the words in a document are drawn from one topic only, whereas LDA makes the assumption that each word in a document is drawn from a topic.
S CHOOL OF E LECTRICAL , E LECTRONIC AND C OMPUTER E NGINEERING
33
C HAPTER F OUR
A N E VALUATION F RAMEWORK FOR T OPIC M ODELS
4.1
INTRODUCTION
The evaluation of topic models is a challenge because (a) topic models are often applied to unlabelled data, so that a ground truth does not exist and (b) “soft” (probabilistic) document clusters are created by state-of-the-art topic models, which complicates comparisons even when ground truth labels are available. Hence, indirect measures of generalization, such as perplexity, are commonly employed as performance measures for topic models. Perplexity comes in handy for model selection purposes and can measure the relative performance between different topic models and the number of topics. The main focus of this thesis is not model selection, but rather the effect of structuring input features on the performance of topic models. For this purpose, current measures suffer from a number of shortcomings: Perplexity, for example, depends on the size of the vocabulary modelled – it can therefore not be used to compare models that use different input feature sets or across different languages. Classification of documents is another way to test the performance of topic models (Blei et al., 2003; Buntine and Jakulin, 2005): the document × topic matrix is used as the feature matrix to classify the documents of a labelled corpus using a classifier such 34
C HAPTER F OUR
A N E VALUATION F RAMEWORK FOR T OPIC M ODELS
as a support vector machine (SVM). The topic model is thus measured in terms of the quality of features that it produces. This method is only feasible if a labelled data set is available in order to train the classifier. We turn to cluster validity techniques in the data clustering field to search for alternative performance metrics for topic models. Clustering algorithms aim to extract the natural grouping structure in data (Lange et al., 2004). Data clustering algorithms include k-means (MacQueen, 1967), k-nearest neighbour (Dasarathy, 1990) and self-organising feature - or Kohonen - maps (Webb, 2002), a special kind of artificial neural network. Cluster validity needs to consider various issues related to clustering algorithms. A cluster algorithm will cluster data, even when no natural clusters in the data exist. Different cluster algorithms may produce different clusters, which raises the question whether the resulting clusters are a true reflection of the data or imposed by the particular algorithm (Webb, 2002). A perturbation measure of some sort is usually implemented in a cluster validation scheme in order to validate the clustering solutions (Webb, 2002) and should evaluate the output of a clustering algorithm quantitatively and objectively. Furthermore, the validation scheme should be applicable to all clustering algorithms - it should not rely on assumptions about specific group structures in the data that is not captured by the clustering algorithm itself (Lange et al., 2004). Stability-based validation of clustering solutions (Lange et al., 2004) offers such a general principle, requiring that cluster solutions for two mutually exclusive data sets - generated from the same probabilistic source - should be similar. This approach assesses the replicability of clustering solutions and builds on the idea of Breckenridge (1989) to measure the similarity of two clustering solutions, one generated by a clustering algorithm and the other generated by a classifier trained using a second (clustered) data set (Lange et al., 2004). At the core of this approach is the transfer of the solution of the first data set to the second, using a classifier. The perturbation factor in this case stems from the two mutual exclusive data sets. This approach is essentially model free, and does therefore not rely on assumptions on the type of group structure. This approach is in contrast with model-based approaches such as the Dirichlet process mixture model, which assumes that the number of clusters, or groups are unknown and determined by a generative model. In this case, the number of clusters is a random variable and a posterior distribution is induced by the data for this number (Blei, 2004). This process can be extended to derive hierarchical clusters of documents as described in Teh et al. (2006). S CHOOL OF E LECTRICAL , E LECTRONIC AND C OMPUTER E NGINEERING
35
C HAPTER F OUR
A N E VALUATION F RAMEWORK FOR T OPIC M ODELS
We find the stability-based validation promising to evaluate topic model performance across feature dimensions, but are faced with the discrepancy that this approach is based on “hard” clusters whereas topic models result in “soft” clusters, implying that a probability density estimator must be trained on the second data set, rather than a classifier as proposed by Breckenridge (1989) and Lange et al. (2004). Alternatively, the probabilistic ruling could be converted to a hard ruling before directly applying stability-based validation. Before considering a “soft” alternative to stability-based validation as proposed by Lange et al. (2004), it is worthwhile to consider other perturbation methods such as different initialisation conditions for topic models. Different configurations of perturbation through initialisation have been documented in Griffiths and Steyvers (2007) and De Waal and Barnard (2008). A second class of topic model evaluation techniques that we consider is information-theoretic indicators. They respond well to the unsupervised characteristics of topic models (Slonim and Tishby, 2000; Dhillon et al., 2003), and we investigate a method that calculates variation of information (Meila, 2002; Heinrich et al., 2005) and mutual information from the document × word matrix. In this chapter, we investigate different perturbation factors under the stability-based validation approach. We extend the approach from hard clustering solutions to soft clustering solutions (topic models in particular) and experiment with different probability density estimators. We show that stability-based validation has significant potential to evaluate topic models. One of the key attributes of a useful topic model is that it should model corpus contents in a stable fashion. That is, useful topics are those that persist despite changes in input representation, model parametrization, etc. We investigate the behaviour of information-theoretic methods on topic models. Finally we compare these methods on various topic models and formulate an evaluation framework for topic models.
4.2
PERPLEXITY
Perplexity is a standard performance measure used in text applications. It measures the model’s ability to generalise and predict new documents: the perplexity is an indication of the number of equally likely words that can occur at an arbitrary position in a document. A lower perplexity therefore indicates better generalisation. We calculate perplexity on the test corpus C ∗ with M ∗
S CHOOL OF E LECTRICAL , E LECTRONIC AND C OMPUTER E NGINEERING
36
C HAPTER F OUR
A N E VALUATION F RAMEWORK FOR T OPIC M ODELS
(
documents as follows: p(C ∗ ) = exp
PM ∗
d=1 log p(wd ) PM ∗ d=1 Nd
−
) (4.1)
where log p(wd ) is the log-likelihood of a document. For LDA, the log-likelihood of a single document in C ∗ can be expressed as a function of the multinomial parameters (compare with equation (2.5) for more clarity on notation):
p(wd |α, β) =
NC ∗ T YX
p(wn = t|zn = k)p(zn = k|w)
n=1 k=1
=
V µX T Y l=1
log(p(wd |α, β)) =
V X
(4.2)
¶Cw
l
θk βlk
k=1
Cwl log
(4.3)
µX T
¶ θk βlk
(4.4)
k=1
l=1
where Cwl is the number of times term l has been observed in document w. βlk is derived using the training corpus, but θk needs to be derived for the test corpus, C ∗ , by querying the model (Heinrich, 2008). The log-likelihood of a single document for the multinomial mixture model is similar to that of LDA: log(p(wd |α, β)) = log
µX T
αk
l=1
=
V X l=1
Cwl log
V Y
¶ βlk
l=1
µX T
(4.5) 
αk βlk
(4.6)
k=1
Perplexity is therefore the exponential of the mean log-likelihood of words in the test corpus. Consequently, it exhibits a similar behaviour to log-likelihood: a reduction in feature dimensionality (in our case, vocabulary) reduces the perplexity, regardless of whether an improved fit to the data has been achieved (Rigouste et al., 2007). To demonstrate this behaviour, we measure perplexity against feature dimensionality. Using the CRAN and Reuters-21578 corpora, we gradually reduce the vocabulary by randomly removing columns from the document × word matrix. Thus, the number of vocabulary words is systematically reduced from 100% to 30%, keeping the number of documents the same. The experiment was repeated 10 times for every dimensionality reduction point with intervals of 10%. Words were removed randomly from the corpus for each repetition S CHOOL OF E LECTRICAL , E LECTRONIC AND C OMPUTER E NGINEERING
37
C HAPTER F OUR
A N E VALUATION F RAMEWORK FOR T OPIC M ODELS
of the experiment. For both corpora, the number of topics was fixed at 100, based on the results displayed in figures 3.2 and 3.3, which indicated that LDA achieves its lowest perplexity for 100 topics. The complete data set was split into a 80% training and 20% test set. LDA and multinomial mixture models were trained on the training set and the perplexity was calculated on the test set. Figures 4.1 and 4.2 display the results by means of box plots, representing the perplexity scores on the y-axis against the vocabulary dimension on the x-axis. The perplexity scores decrease (i.e. improve) every time the dimensionality is reduced, even though there is no reason to believe that the random deletion of words will improve the topic model. Perplexity is appropriate to use when comparing topic models with exactly the same feature dimensionality in the input matrix (as in figure 3.2 in chapter 3). However, in subsequent chapters we propose the structuring of features (or words) to improve the performance of topic models. This inevitably varies the feature dimensionality and perplexity becomes meaningless as a performance measure. In the remainder of this chapter we investigate alternative performance measures for topic models that prove to be more consistent across different feature dimensionalities.
4.3
STABILITY-BASED VALIDATION
The objective of cluster validation is to evaluate the output of a clustering algorithm quantitatively as well as objectively. Lange et al. (2004) propose stability as an evaluation metric for cluster solutions. In this section we discuss the three major steps in this method, namely • transfer by means of a classifier, • alignment of clustering solutions, • calculation of the stability index. We also suggest ways to adapt the method in each of the three steps for topic models by means of alternative perturbation methods or the use of probability density estimators rather than classifiers. 4.3.1
TRANSFER BY MEANS OF A CLASSIFIER
The basic idea of stability-based validation is to compare clustering solutions for two different data sets generated from the same probabilistic source. This assesses the replicability of the clustering solution. Because the two data sets are mutually exclusive, the derived clustering solutions are not S CHOOL OF E LECTRICAL , E LECTRONIC AND C OMPUTER E NGINEERING
38
C HAPTER F OUR
A N E VALUATION F RAMEWORK FOR T OPIC M ODELS
1200 1100 1000
mult mixture
Perplexity
900 800 700 600 500
lda
400 300 100%
90%
80%
70% 60% 50% Vocabulary dimension
40%
30%
Figure 4.1: Perplexity vs Feature Dimensionality (CRAN corpus)
2200 2000 1800
mult mixture
Perplexity
1600 1400 1200 1000 800
lda
600 400 100%
90%
80%
70% 60% 50% Vocabulary dimension
40%
30%
Figure 4.2: Perplexity vs Feature Dimensionality (Reuters corpus)
S CHOOL OF E LECTRICAL , E LECTRONIC AND C OMPUTER E NGINEERING
39
C HAPTER F OUR
A N E VALUATION F RAMEWORK FOR T OPIC M ODELS
directly comparable and the clustering solution of the first data set needs to be transferred to the clustering solution of the second data set by means of a classifier. 0 ) be finite data sets. A clustering algorithm Let X = (X1 , . . . , Xn ) and X0 = (X10 , . . . , Xm
A constructs a solution Y := A(X) where each sample Xi is associated with a label Yi . Lange et al. (2004) proposed the following mechanism to make a direct comparison between solutions possible: The data set X together with its clustering solution Y := A(X) can be considered as a training set used to infer a classifier, φ. The classifier φ is now used to predict a label φ(X 0 ) for a new data point X 0 in a test set X0 - the second data set. The predicted labels φ(X0 ) are subsequently compared with the labels generated from the clustering solution on the second data set: Y := A(X0 ). In this way, the solution of the first data set is transferred to the solution of the second data set, using the classifier φ (Lange et al., 2004). This process is illustrated in figure 4.3: In the first step, obtain a topic solution A(X) on data set X and use these as a data set to train a classifier. Predict the labels on the second data set X0 , i.e. use X0 as a test set on classifier φ. Also obtain the topic model output A(X0 ) on data set X0 . Compare the classifier output, φ(X0 ), and topic model output A(X0 ). 4.3.2
CLUSTER ALIGNMENT
Before the classifier output, φ(X0 ), and topic model output A(X0 ) can be compared, the two solutions need to be aligned first. Because of the unsupervised nature of clustering algorithms, the two clustering solutions are not naturally aligned. This misalignment is due to the fact that no label information exists for the clusters (Lange et al., 2004). Therefore, topic 1 of φ(X0 ) is not necessarily topic 1 in A(X0 ). When the numbers of topics in the two solutions are the same, the Hungarian method (also known as Kuhn’s method) (Kuhn, 1955; Frank, 2004) can be used to align the topics in the respective solutions. Consider the bipartite graph in figure 4.4 where each set represents a clustering solution, say φ(X0 ) and A(X0 ) (from distinct data sets or independent algorithmic runs) and each node represents a topic. More particularly, each node represents the topic distribution over all documents. The Hungarian method is an algorithm for determining a complete weighted bipartite matching that minimises the distance between the two sets in the graph (Frank, 2004; Rosenbaum, 1989). First, a weight matrix must be set up to indicate the similarities of all pairs resulting from different runs; the algorithm then calculates the optimal overall matching between the two runs. S CHOOL OF E LECTRICAL , E LECTRONIC AND C OMPUTER E NGINEERING
40
C HAPTER F OUR
A N E VALUATION F RAMEWORK FOR T OPIC M ODELS
Once a weight matrix is calculated for the graph, the best matched pairs can be calculated using the Hungarian method. The Hungarian method solves assignment problems in polynomial time. Greedy matching is an alternative assignment method, but it does not guarantee optimal matching (Rosenbaum, 1989). Lange et al. (2004) proposes using the normalised Hamming distance between clustering solutions φ(X0 ) and A(X0 ) to calculate the weight matrix. The Hamming distance between two vectors of equal length is the number of positions in which the two vectors differ (Mackay, 2002). The Hamming distance between all permutations of clusters in the two solutions forms the weight matrix used in the Hungarian method. The normalised Hamming distance between φ(X0 ) and Y0 is defined as follows (Lange et al., 2004): n
d(φ(X0 ), Y0 ) :=
1X 1{π(φ(Xi0 )) 6= Yi0 }, n
(4.7)
i=1
where 1{φ(Xi0 ) 6= Yi0 }, if φ(Xi0 ) 6= Yi0 and zero otherwise. The output of the Hungarian method is the unique pairs between the two solutions that minimise the Hamming distance: n
1X d(φ(X ), Y ) := min 1{π(φ(Xi0 )) 6= Yi0 }, π∈Π n 0
0
(4.8)
i=1
where the set of all permutations is represented by Π and π represents a single permutation. In the case of topic models, the Hamming distance is not an appropriate measure to construct the weight matrix because of the probabilistic nature of the clustering solutions. We propose document correlation as weights, and modify the Hungarian method to find the unique topic pairs between the two solutions that maximise the document correlation. Figure 4.5 illustrates examples of two unaligned (left) and aligned (right) topics where the Hungarian method (with document correlation as weights) was used to perform the topic alignment. The x-axis represents documents and the y-axis represents the probability of each document belonging to the specific topic. . An alternative alignment method for topic solutions is non-unique matching between the two sets in the bipartite graph. In this case topics in the first set are aligned with topics in the second set that results in maximum document correlation. This could mean that one topic in set one matches more than one topic in set two, or the other way around. We call this the maximum correlation alignment method.
S CHOOL OF E LECTRICAL , E LECTRONIC AND C OMPUTER E NGINEERING
41
C HAPTER F OUR
A N E VALUATION F RAMEWORK FOR T OPIC M ODELS
Figure 4.3: Transfer by prediction
Figure 4.4: Bipartite graph
S CHOOL OF E LECTRICAL , E LECTRONIC AND C OMPUTER E NGINEERING
42
C HAPTER F OUR
4.3.3
A N E VALUATION F RAMEWORK FOR T OPIC M ODELS
STABILITY MEASURE
Lange et al. (2004) propose the normalised Hamming distance to quantify the fraction of labelled entities φ(X0 ) that were misclassified (not matching the labels of A(X0 ) - see step 4 in figure 4.3). This gives a good indication of the match between the cluster solutions of the two data sets in an intuitive way. It is called the stability or dissimilarity measure and is the average distance between solutions for two data sets X and X0 , S(A) := EX,X0 d(φ(X0 ), Y0 )
(4.9)
where S is called the stability index (Lange et al., 2004). This approach to derive a stability index is optimised for hard clustering solutions, i.e. the clustering solution Y := A(X) is used as labelling information for the data set X in order to create a training set. Furthermore, the use of the Hamming distance as dissimilarity measure calls for a one-one-one comparison of the predicted label and cluster solution. In the case of topic modelling we use the average document correlation of aligned topics in the two clustering solutions for data set X0 as the stability index, S(A) := EX,X0 [corr(θ, θ0 )]
(4.10)
Lange et al. (2004) formalised stability-based validation using independent data sets for clustering solutions as discussed in this section so far. This approach is optimised for hard clusters, meaning a sample (or document in our case) gets assigned to one cluster only. Topic models produce soft, probabilistic clusters and therefore Lange’s method is not directly applicable. In the next sections, we discuss two ways to adapt Lange’s method to suit the probabilistic nature of topic-document clusters.
4.4 INITIALISATION AS PERTURBATION For probabilistic topic models, a natural perturbation method presents itself: since these models rely on the iterative optimization of a likelihood function from a random initial condition, they invariably converge to different local solutions from different starting points. This perturbation method is more straightforward, due to the fact that the same data set is used for both clustering S CHOOL OF E LECTRICAL , E LECTRONIC AND C OMPUTER E NGINEERING
43
C HAPTER F OUR
A N E VALUATION F RAMEWORK FOR T OPIC M ODELS
solutions. There is no need to transfer one solution to the other in order to compare them. The concept of stability proposed in this case is based on assessing the average dissimilarity of topic solutions computed for two independent runs. Topic models can be interpreted as factor models where the original document × word matrix is split into a topic × document matrix and a word × topic matrix (Griffiths and Steyvers, 2007) as illustrated in figure 2.3 in chapter 2. We are particulary interested in the topic × document matrix, θ. This matrix contains topic-document probabilities, implying that each document is assigned to a topic with a certain probability. Let X = (X1 , . . . , XM ) be M documents in a corpus C. A topic model A is said to infer the matrix θ so that θi := A(Xi ) is the probability distribution over topics for document i. θ is then defined as the clustering solution and we construct two clustering solutions θ and θ0 from the data set X. Before comparing θ and θ0 , they need to be aligned using the Hungarian method. Once the topics of the two solutions have been aligned, we calculate the stability index. Algorithm 4 illustrates the process to calculate the stability index when using initialisation as perturbation method. 4.4.1
EXPERIMENTAL EVALUATION
We study the behaviour of the stability index S(A) when “initialisation as perturbation” is used. We are particulary interested in the behaviour under different feature dimensions. As with the perplexity experiments, the dimensionalities on the CRAN and Reuters-21578 corpora were reduced from 100% to 30%, repeating the experiment 10 times at each 10% interval. The vocabulary was randomly reduced for each repetition of the experiment. The complete data set was split into 80% training and 20% testing samples. The LDA and multinomial mixture models were trained on the training set and a stability index was calculated on both the train and test set. In this experiment, two independent runs on the same topic model served as the perturbation method. The document × topic distributions, θ and θ0 , of the two runs were aligned and figure 4.6 is a graphical representation of the stability index for all possible topic combinations of the two LDA solutions trained on the CRAN data set. The dark diagonal line indicates that the aligned topics generally have a much higher document correlation than any other arbitrary combination of topics. Tables 4.1 - 4.3 give the average document correlations, variances and p-values on the training S CHOOL OF E LECTRICAL , E LECTRONIC AND C OMPUTER E NGINEERING
44
C HAPTER F OUR
A N E VALUATION F RAMEWORK FOR T OPIC M ODELS
0.25
0.05
0.2
0.04
0.15
0.03
0.1
0.02
0.05
0.01
0
0
200
400
600
800
1000
1200
1400
0
0.2
0.04
0.15
0.03
0.1
0.02
0.05
0.01
0
0
200
400
600
800
1000
1200
1400
0
0
200
400
600
800
1000
1200
1400
0
200
400
600
800
1000
1200
1400
Figure 4.5: Example of two unaligned (left) and aligned (right). The x-axis represents the various documents and the y-axis represents the probability of each document belonging to the selected topic.
1 2
3 4
Input: document × word matrix Output: S(A) Run topic model twice on complete data set X; Calculate T×T weight matrix with document correlation for all combinations of topics in the two solutions; Align topics with Hungarian method; S(A) := EX,X0 [corr(θ, θ0 )] - the average document correlation of aligned topics
Algorithm 4: Algorithm for stability measure using initialisation as perturbation method
S CHOOL OF E LECTRICAL , E LECTRONIC AND C OMPUTER E NGINEERING
45
C HAPTER F OUR
A N E VALUATION F RAMEWORK FOR T OPIC M ODELS
and test sets of the CRAN and Reuters corpus for multinomial mixture and LDA respectively. The document correlation on the training and test set exhibits no significant trend or changes across vocabulary dimensions as indicated by the p-values reported in each table (which were computed using an Anova test), with the exception of the MM training set on the Reuters corpus. We return to this exception in section 4.5.2.2. It is important to note that a property of the multinomial mixture model is that it tends to behave like a deterministic clustering algorithm by assigning probabilities of 1 (or very close to it) that a document belongs to a topic (Rigouste et al., 2007). In fact, the EM algorithm converges very quickly to this deterministic topic-document associations. Therefore, document correlation tends to be biased towards LDA results and discriminates against the multinomial mixture because of its deterministic nature. This perturbation method is therefore not recommended for use in the case of the multinomial mixture model.
4.5
TRANSFER THROUGH PROBABILITY DENSITY ESTIMATORS
Another way to adapt stability-based validation for topic models is to use an appropriate method to transfer soft clustering solutions from one data set to another. In this way independent data sets are used as perturbation method as described in Lange et al. (2004). In order to create two independent data sets from the word × document matrix, we randomly split it up into two matrices X and X0 . The process of transferring the solution of the first data set X to the second data set X0 is similar to that in figure 4.3. In algorithm 5, the process is explained in more detail with topic model terminology and notation. 4.5.1 PROBABILITY DENSITY ESTIMATORS The biggest challenge in using two independent data sets as perturbation method for soft clustering algorithms, is to transfer the solutions of the first data set to the solution of the second data set. This is due to the fact that the solution space for each sample is in the form of a probability vector: the sample is assigned to multiple clusters with different probabilities. This complicates the choice of a classifier as it uses a probability vector rather than a cluster label in the training set to train the classifier. Furthermore, Lange et al. (2004) states the “predictor should match the grouping” principle, because a poor choice can increase the discrepancy between two solutions.
S CHOOL OF E LECTRICAL , E LECTRONIC AND C OMPUTER E NGINEERING
46
C HAPTER F OUR
A N E VALUATION F RAMEWORK FOR T OPIC M ODELS
2
0.9
4
0.8 0.7
topics (run 2)
6
0.6
8
0.5 10 0.4 12
0.3
14
0.2
16
0.1
18
0
20
−0.1 2
4
6
8
10 12 topics (run 1)
14
16
18
20
Figure 4.6: Document correlation matrix for 2 LDA topic solutions - CRAN corpus
Table 4.1: Document correlation on the training and test set - Multinomial mixture, CRAN corpus Dimensionality p-value 100% 90% 80% 70% 60% 50% 40% 30%
Multinomial Mixture Train Test 0.19 0.2 Average Variance Average Variance 0.132 0.00047 0.256 0.00052 0.114 0.00027 0.239 0.00063 0.134 0.00020 0.264 0.00060 0.141 0.00021 0.260 0.00055 0.126 0.00043 0.254 0.00090 0.141 0.00050 0.263 0.00063 0.148 0.00045 0.284 0.00084 0.118 0.00014 0.24 0.00039
S CHOOL OF E LECTRICAL , E LECTRONIC AND C OMPUTER E NGINEERING
47
C HAPTER F OUR
A N E VALUATION F RAMEWORK FOR T OPIC M ODELS
Table 4.2: Document correlation on the training and test set - LDA, CRAN corpus Dimensionality p-value 100% 90% 80% 70% 60% 50% 40% 30%
Latent Dirichlet Allocation Train Test 0.15 0.12 Average Variance Average Variance 0.504 0.00013 0.572 0.00011 0.494 0.00021 0.552 0.00010 0.509 0.00036 0.552 0.00032 0.528 0.00047 0.581 0.00018 0.533 0.00057 0.595 0.00038 0.545 0.00048 0.562 0.00018 0.501 0.00025 0.561 0.00023 0.498 0.00031 0.575 0.00026
Table 4.3: Document correlation on the training and test set - Multinomial mixture, Reuters corpus Dimensionality p-value 100% 90% 80% 70% 60% 50% 40% 30%
Multinomial Mixture Train Test 1.8×10⁻¹¹ 0.25 Average Variance Average Variance −05 0.145 1.7×10 0.30 0.00010 0.151 1.1×10−05 0.28 9.0×10−05 0.151 2.3×10−06 0.29 8.9×10−05 −06 0.154 6.5×10 0.30 9.4×10−05 −05 0.168 1.7×10 0.29 2.6×10−05 0.173 2.7×10−06 0.30 6.5×10−06 −05 0.184 5.2×10 0.30 8.4×10−05 −06 0.202 4.1×10 0.31 0.00012
Table 4.4: Document correlation on the training and test set - LDA, Reuters corpus Dimensionality p-value 100% 90% 80% 70% 60% 50% 40% 30%
Latent Dirichlet Allocation Train Test 0.94 0.88 Average Variance Average Variance 0.553 7.1×10−05 0.598 0.00011 −05 0.53 5.3×10 0.6 0.00011 0.538 8.7×10−05 0.59 2.1×10−05 0.553 3.1×10−05 0.623 3.3×10−05 −05 0.53 5.3×10 0.603 7.5×10−05 −05 0.538 8.7×10 0.59 2.1×10−05 0.545 0.00014 0.589 0.00049 0.0.542 9.4×10−05 0.59 9.2×10−05
S CHOOL OF E LECTRICAL , E LECTRONIC AND C OMPUTER E NGINEERING
48
C HAPTER F OUR
A N E VALUATION F RAMEWORK FOR T OPIC M ODELS
The objective of stability-based validation is to measure the stability of the topic model behaviour, and the additional noise generated by a classifiers should be minimized. The choice of an optimal classifier is difficult to attain analytically, but an intuitive choice for a classifier is one that mimics the clustering algorithm (Lange et al., 2004). We investigate two classifiers, namely a naive Bayesian (NB) classifier and a support vector machine (SVM) as suitable predictors for the respective topic model under investigation. Both of them are supervised techniques, but can accommodate probability vectors as input, rather than hard labels. 4.5.1.1
NAIVE BAYESIAN CLASSIFIER
The NB classifier is a probabilistic model for classification (McCallum and Nigam, 1998). It assumes independent contributions of features to the classification of samples. This assumption dramatically decreases the complexity of the model and the NB classifier performs well in high dimensional spaces. The NB classifier estimates the topic probabilities α and the word probabilities β for each document. It is a supervised method, meaning the documents in the training set are labelled. Given a corpus C and topics T , the log posterior distribution of the parameters α and β is: ¶ T µ N X X log p(α, β|C, T ) = (St + λα − 1) log αt + (Kwt + λβ − 1) log βwt t=1
(4.11)
w=1
where St is the number of training documents in topic t and Kwt is the number of occurrences of word w in topic t (Rigouste et al., 2007). The maximum a posteriori estimates, using Laplacian smoothing have the form: α ˆt = where Kt =
PN
w=1 Kwt
St + λα − 1 M + T (λα − 1)
Kwt + λβ − 1 βˆwt = Kt + N (λβ − 1)
(4.12)
is the total number of words in topic t (Lewis, 1998; McCallum and
Nigam, 1998). The decision rule for classifying unseen documents is selecting the topic that maximises ˆ =α P (Td = t|C, α ˆ , β) ˆt
N Y
Cwd βwt
(4.13)
w=1
S CHOOL OF E LECTRICAL , E LECTRONIC AND C OMPUTER E NGINEERING
49
C HAPTER F OUR
A N E VALUATION F RAMEWORK FOR T OPIC M ODELS
For the purpose of using the NB classifier to transfer a topic solution from one data set to another, the hard labels of each document in the training set are replaced with a probability vector over topics. This is the topic × document matrix, θ. The parameters St and Kwt are affected by this adjustment: St is now the summation of θ over documents and for each document d, the number of occurrences of word w is multiplied with the probability of topic t assigned to the specific document in order to create the word × topic matrix K:
St =
M X
θt
d=1
Kwt =
M X
Cwd θt
(4.14)
d=1
The update and maximisation equations (4.12, 4.13) do not change and Laplacian smoothing is still applied in both instances. 4.5.1.2
SUPPORT VECTOR MACHINES
Support Vector Machines (SVMs) are supervised methods for classification and regression. We investigate Support Vector Regression (SVR), which applies SVMs to the problem of regression rather than classification. SVMs are kernel methods and approach the classification problem by mapping data into a high dimensional feature space where linear regression is performed (Gunn, 1998; Smola and Sch¨olkopf, 1998). Hyperplanes are constructed on the margins of two data sets so that no points between the hyperplanes exist. This is possible if the data is linearly separable. The SVM constructs a hyperplane in this feature space that maximises the margin between two data classes. This is called the maximal margin hyperplane (Webb, 2002). Data samples on the respective margins of the two classes are called support vectors. Figure 4.7 illustrates the maximal margin hyperplanes and the data points that act as support vectors on the hyperplanes. Multiclass classifiers, as in the case of topic models, are constructed by combining several binary classifiers (Webb, 2002). We use SVR to predict probabilities for each label. Therefore, in practice each topic, or label is trained independently with its own SVR model. 4.5.2
EXPERIMENTAL EVALUATION
As with the previous experiments in this chapter, we are interested in the behaviour of the stability index S(A) across vocabulary dimensions. As before, the vocabulary dimensionalities of the CRAN and Reuters-21578 corpora were reduced from 100% to 30%, repeating the experiment ten S CHOOL OF E LECTRICAL , E LECTRONIC AND C OMPUTER E NGINEERING
50
C HAPTER F OUR
1 2 3 4 5
6 7
A N E VALUATION F RAMEWORK FOR T OPIC M ODELS
Input: document × word matrix Output: S(A) Split data set into two mutually exclusive sets X and X0 ; Train topic model on X0 to obtain A(X) and predict A(X0 ); Train a classifier φ on X as input and A(X) as output; Use φ in order to predict solutions φ(X0 ) for X0 ; Compare A(X0 ) and φ(X0 ): Calculate T×T weight matrix with document correlation for all combinations of topics; Align topics with Hungarian method; S(A) = average document correlation of aligned topics
Algorithm 5: Algorithm for stability measure using two data sets as perturbation method
Figure 4.7: Separating hyperplane with margins. Taken from Wikipedia
S CHOOL OF E LECTRICAL , E LECTRONIC AND C OMPUTER E NGINEERING
51
C HAPTER F OUR
A N E VALUATION F RAMEWORK FOR T OPIC M ODELS
times at each 10% interval. The complete data set was split into 80% training and 20% testing samples. The LDA and multinomial mixture models as well as the respective probability density estimators were trained on the training set and the stability index S(A) was calculated on the test set (see algorithm 5 for a detailed description). 4.5.2.1
NB PROBABILITY DENSITY ESTIMATOR
Tables 4.5 and 4.6 display the results obtained for the CRAN and Reuters corpora, using the NB probability density estimator to calculate the stability index S(A). The number of topics inferred in this experiment is T = 100. For both the LDA and multinomial mixture experiment on the CRAN corpus, the p-value is a good indication that the stability index has insignificant changes across vocabulary dimensions. On the Reuter corpus, the LDA and multinomial mixture do not perform consistently across vocabulary dimensions as indicated by the small p-values obtained by performing an Anova test. This gives an indication that the stability does depend on the number of words in the vocabulary for large corpora, but the dependency is weak. 4.5.2.2
SVM PROBABILITY DENSITY ESTIMATOR
Table 4.7 displays the stability index for the CRAN data set over 100 topics using the SVM as probability density estimator. It can be seen that the combination of multinomial mixture and the SVM density estimator does not perform well and this combination of use is not recommended. However, the use of the SVM as probability density estimator in combination with the LDA model resulted in interesting results. Figure 4.8 displays the results graphically which indicates that the stability index fluctuates significantly across vocabulary dimensions, increasingly so at lower dimensions. This behaviour was investigated in more detail. In figure 4.9 results are shown where the experiment was repeated for 20, 40, 60 and 80 topics, resulting in the more comprehensive contour graph. The color bar represents the stability index. This graph illustrates that at lower vocabulary dimensions the stability index improves. The effect is more pronounced at higher number of topics such as 80 and 100. This effect was also seen with the multinomial mixture experiments in section 4.4.1. On closer investigation the following becomes clear: As the vocabulary dimension lowers, the topic model finds some topics difficult to learn, leaving those document-topic distributions
S CHOOL OF E LECTRICAL , E LECTRONIC AND C OMPUTER E NGINEERING
52
C HAPTER F OUR
A N E VALUATION F RAMEWORK FOR T OPIC M ODELS
Table 4.5: Document correlation using Naive Bayes as classifier - CRAN corpus Dimensionality p-value 100% 90% 80% 70% 60% 50% 40% 30%
Latent Dirichlet Allocation 0.6 Average Variance 0.342 0.00011 0.346 0.00010 0.354 7.3×10−05 0.342 7.9×10−05 0.352 0.00019 0.358 0.00016 0.347 8.0×10−05 0.350 0.00022
Multinomial Mixture 0.32 Average Variance 0.341 0.00017 0.376 9.3×10−05 0.33 0.00019 0.348 0.00032 0.352 0.00017 0.353 7.0×10−05 0.342 5.4×10−05 0.348 0.00035
Table 4.6: Stability indices using Naive Bayes as classifier - Reuters corpus Dimensionality p-value 100% 90% 80% 70% 60% 50% 40% 30%
Latent Dirichlet Allocation 1.1×10⁻²⁵ Average Variance 0.343 6.3×10−05 0.337 7.7×10−05 0.333 0.00013 0.312 0.00011 0.296 7.3×10−05 0.277 5.7×10−05 0.283 4.2×10−05 0.242 3.4×10−05
Multinomial Mixture 8.1×10⁻¹⁰ Average Variance 0.27 7.6×10−05 0.253 1.2×10−05 0.27 6.9×10−06 0.274 0.00013 0.26 4.9×10−05 0.212 2.6×10−05 0.209 1.2×10−05 0.212 1.03×10−05
Table 4.7: Stability indices using SVM as classifier - CRAN corpus Dimensionality p-value 100% 90% 80% 70% 60% 50% 40% 30%
Latent Dirichlet Allocation 1.5×10−06 Average Variance 0.576 0.00018 0.565 4.3×10−05 0.528 0.00013 0.567 0.00062 0.774 0.0010 0.832 0.00049 0.880 0.00050 0.925 0.00012
Multinomial Mixture 1.3×10−45 Average Variance 0.216 6.7×10−06 0.221 4.4×10−05 0.228 3.5×10−05 0.228 2.07×10−05 0.230 4.1×10−05 0.239 3.0×10−05 0.238 7.9×10−05 0.247 9.0×10−05
S CHOOL OF E LECTRICAL , E LECTRONIC AND C OMPUTER E NGINEERING
53
C HAPTER F OUR
A N E VALUATION F RAMEWORK FOR T OPIC M ODELS
1 0.9
Document Correlation
0.8 0.7
lda
0.6 0.5 0.4
mult mixture
0.3 0.2 100%
90%
80%
70% 60% Vocabulary Size
50%
40%
30%
Figure 4.8: Document correlation over vocabulary size using SVM as classifier - CRAN corpus
30% 0.85
40%
Vocabulary dimension
0.8 50% 0.75 60% 0.7 70% 0.65 80% 0.6 90%
100% 20
0.55
40
60 Number of topics
80
100
Figure 4.9: Contour graph of document correlation over vocabulary size and number of topics using SVM as classifier - CRAN corpus.
S CHOOL OF E LECTRICAL , E LECTRONIC AND C OMPUTER E NGINEERING
54
C HAPTER F OUR
A N E VALUATION F RAMEWORK FOR T OPIC M ODELS
uniform. The SVM then subsequently learns a uniform distribution for that particular topic. In this case, the document correlation between the topic predicted by the SVM and the topic predicted by the topic model equals 1. As can be seen in figure 4.9, the average document correlation behaves in a more stable fashion across vocabulary dimensions at a lower number of topics (20, 40) than at a higher number of topics: the ‘bending’ of the contours is more pronounced from 60 topics and higher. Figure 4.10 is an example of both the SVM and topic model predicting a ‘meaningful’ topic distribution over test documents. The conclusion drawn from the above is that a topic model produces ‘meaningless’ topics in some instances, resulting in uniform topic × document distributions. Subsequently, this results in high, but meaningless stability indices. To rectify this, we exclude meaningless topics from the topic × document matrix before calculating the perplexity, training the SVM and calculating the stability. This is done by calculating the variance of each topic × document distribution and setting a lower threshold, σ, on the variance. All topics with a variance less than σ are then excluded from the set of topics. The process of calculating the stability index as described in algorithm 5 is then altered as described in algorithm 6. The aim of this alteration is to exclude meaningless topics from the set of topics, and by doing so, improve the consistency of the stability index across vocabulary dimensions. In practice, this means that if 30 topics were found to be meaningless in an original set of 100 topics, the 30 topics are removed from the topic set and only 70 topics are captured and analysed in the document × topic matrix. An experiment was done on the CRAN corpus across vocabulary dimensions 100% to 30% for 20, 40, 60, 80 and 100 topics where the topic × document distribution was predicted on the test set using the LDA topic model. The lower variance threshold was set to σ = 1 and all topic distributions with a variance less than this were defined as meaningless. Figure 4.11 indicates the average percentage of topics defined as meaningless and excluded from the original topic set across number of topics (x-axis) and vocabulary dimensions (y-axis). It can be seen that at 100 topics and 30% vocabulary dimension, more than 70% of the topics are identified as being meaningless and consequently removed from the topic set. There is a clear indication in figure 4.11 that the effect of meaningless topics is more pronounced at a higher number of topics and a low vocabulary dimension. By applying this adjustment - excluding meaningless topics from a topic set - the document correlation, or stability index S(A) becomes more stable across vocabulary S CHOOL OF E LECTRICAL , E LECTRONIC AND C OMPUTER E NGINEERING
55
C HAPTER F OUR
A N E VALUATION F RAMEWORK FOR T OPIC M ODELS
0.03
0.02
0.01
0
0
50
100
150
200
250
300
350
400
0
50
100
150
200
250
300
350
400
0.01 0.008 0.006 0.004 0.002 0
Figure 4.10: Example of a topic distribution over test documents: Topic model prediction (top graph) and SVM model prediction (bottom graph)
1 2 3
4
5 6
7 8
Input: document × word matrix Output: S(A) Split data set into two mutually exclusive sets X and X0 ; Train topic model on X to obtain document × topic matrix; Calculate variance σ on all topic distributions and exclude topics with σ lower than a chosen threshold; Train a classifier (SVM) φ on X (with ‘meaningless’ topics excluded) as input and A(X) as output; Use φ in order to predict solutions φ(X0 ) for X0 ; Compare A(X0 ) and φ(X0 ): Calculate T×T weight matrix with document correlation for all combinations of topics; Align topics with Hungarian method; S(A) = average document correlation of aligned topics
Algorithm 6: Adjusted algorithm for stability measure using two data sets as perturbation method
S CHOOL OF E LECTRICAL , E LECTRONIC AND C OMPUTER E NGINEERING
56
C HAPTER F OUR
A N E VALUATION F RAMEWORK FOR T OPIC M ODELS
dimensions. 4.5.2.3
STABILITY INDICES ACROSS VOCABULARY DIMENSION
To understand the behaviour of the stability index across vocabulary dimension with no interference from meaningless topics, it would be useful to investigate topic numbers under these conditions. For the CRAN corpus, no meaningless topics are inferred at 20 and 40 topics. Figure 4.12 illustrates the stability indices calculated for 20 topics on the CRAN corpus. The experiment was repeated 10 times at each vocabulary dimension from 100% to 30% and the results are displayed in box plots. A slight decrease in the stability index is noticeable with decrease in vocabulary dimension. Figure 4.13 illustrates the stability indices calculated for 40 topics on the CRAN corpus, which shows more consistency across vocabulary dimensions. As can be expected, the stability index is influenced by the response of the topic model to the combination of the number of topics and the vocabulary dimension. The fact that the stability index shows some variation as the dimensionality of the feature vector varies shows that this response is complex. For the purpose of this thesis, we view these fluctuations as a consequence of the probabilistic nature of topic models and do not attempt to normalise the stability index across vocabulary dimensions – the fact that this dependency is much weaker than for perplexity (see Figures 4.1 and 4.2) is sufficient reason to include the stability index in our investigations. 4.5.2.4
STABILITY INDICES ACROSS NUMBER OF TOPICS
Although the stability indices across vocabulary dimensions for a specific number of topics are fairly constant, the same can not be said for stability indices across number of topics: the stability indices are not normalised across number of topics. Figure 4.14 captures all the stability indices (for all vocabulary dimensions) across the number of topics. As long as meaningless topics are excluded, this poses no obstacle when comparing stability indices of different vocabulary dimensions - comparison is done for the same number of topics. We illustrate this effect with the following example: Compare vocabulary dimensions 40% and 70% of the CRAN corpus for 80 topics by following the process in algorithm 6. For the vocabulary dimension 40%, 40 topics were identified as being meaningless. For the vocabulary dimension 70%, 7 topics were identified as being meaningless. After realigning the number of
S CHOOL OF E LECTRICAL , E LECTRONIC AND C OMPUTER E NGINEERING
57
C HAPTER F OUR
A N E VALUATION F RAMEWORK FOR T OPIC M ODELS
100% 70 90% Vocabulary Dimension
60 80% 50 70% 40 60% 30 50% 20 40% 10 30% 20
40
60 Number of topics
80
100
Figure 4.11: Percentage of topics excluded from original topic set
0.84 0.83 0.74
0.82 0.72
0.8 Stability index
Stability index
0.81
0.79 0.78
0.7
0.68
0.77 0.76
0.66
0.75 0.64
0.74 100%
90%
80%
70% 60% Vocabulary dimension
50%
40%
30%
Figure 4.12: Stability indices at 20 topics: CRAN corpus
100%
90%
80%
70% 60% Vocabulary dimension
50%
40%
30%
Figure 4.13: Stability indices at 40 topics: CRAN corpus
S CHOOL OF E LECTRICAL , E LECTRONIC AND C OMPUTER E NGINEERING
58
C HAPTER F OUR
A N E VALUATION F RAMEWORK FOR T OPIC M ODELS
topics, we are in effect comparing 40% and 70% vocabulary dimensions at 40 topics. Table 4.8 gives the results on S(A) before and after meaningless topics were removed, respectively. Table 4.8: Stability indices of vocabulary dimension 40% and 70% for 80 topics
Original S(A) S(A) after removing meaningless topics
40% Average Variance 0.85 0.00030 0.69 7.4×10−05
70% Average Variance 0.56 0.00012 0.68 0.00011
The results of this example show an improvement in the consistency of S(A) across vocabulary dimensions when meaningless topics are removed from the topic solution.
4.6
INFORMATION-THEORETIC INDICATORS
Information-theoretic indicators are valuable measures of information content in topic solutions. They measure the information content in individual topic solutions as well as the information that one topic solution (or clustering) provides about another topic solution. Consider two topic solutions C and C 0 . Entropy is a measure of the information content of the individual topic solutions (indicated as the circles H(C) and H(C 0 ) in figure 4.15 and mutual information is a measure of the information that C provides about C 0 (indicated as the overlap of the two circles - I(C, C 0 ) in figure 4.15). 4.6.1 ENTROPY Assume we have documents d1 . . . dM which are clustered into T topics, using a probabilistic topic model. We call this clustering C. The topic model algorithm assigns a probability distribution PM p(t = r|di ) for k = 1, . . . , T to each document di . Then P (k) = i=1 p(t = k|di ) is the probability of a document to be assigned to cluster Ck . The entropy is a measure of the information content of an individual topic solution and is defined as (Meila, 2002)
H(C) = −
T X
P (k) log P (k)
(4.15)
k=1
Entropy is measured in bits and is always non-negative.
S CHOOL OF E LECTRICAL , E LECTRONIC AND C OMPUTER E NGINEERING
59
C HAPTER F OUR
A N E VALUATION F RAMEWORK FOR T OPIC M ODELS
0.85
0.8
Stability index
0.75
0.7
0.65
0.6
0.55
0.5 20
40
60 Number of topics
80
100
Figure 4.14: Stability index across number of topics: CRAN corpus
Figure 4.15: Information-theoretic indicators of two clusterings (Meila, 2002)
S CHOOL OF E LECTRICAL , E LECTRONIC AND C OMPUTER E NGINEERING
60
C HAPTER F OUR
4.6.2
A N E VALUATION F RAMEWORK FOR T OPIC M ODELS
MUTUAL INFORMATION
Mutual information is a measure of the mutual dependence between two topic solutions, or the information that one topic solution has about the other. The distribution P (k, k 0 ) is the probability that a document belongs to Ck in clustering C and Ck0 in clustering C 0 and can also be written as P 0 0 P (k) = M i=1 p(t = k|di )p(t = k |di ). Given this distribution, the mutual information between C and C 0 is
0
0
I(C, C ) =
T X T X k=1
P (k, k 0 ) log
k0 =1
P (k, k 0 ) P (k)P (k 0 )
(4.16)
The mutual information is always non-negative and symmetric: I(C, C 0 ) = I(C 0 , C) ≥ 0 4.6.3
(4.17)
VARIATION OF INFORMATION
Variation of Information (VI) is a measure of the distance between two clusterings by assessing the amount of information gained or lost when changing from one clustering to another (Meila, 2002). VI can be applied to hard and soft clusterings and different numbers of clusters in each clustering. VI uses the concepts of entropy and mutual information to express the relationship between two clusterings (Meila, 2002): V I(C, C 0 ) = H(C) + H(C 0 ) − 2I(C, C 0 )
(4.18)
The relation of VI to other quantities is explained in figure 4.15: The conditional entropy H(C|C 0 ) can also be written as H(C) − I(C, C 0 ) and it measures the amount of information lost about C 0 when going from clustering C to C 0 . Similarly, H(C 0 |C) = H(C 0 ) − I(C, C 0 ) measures the amount of information still to be gained about C 0 when going from C to C 0 (Meila, 2002). VI is always symmetric and non-negative. A lower VI value indicates a shorter distance between two topic solutions where V I(C, C 0 ) = 0 if C = C 0 . 4.6.4
EXPERIMENTAL EVALUATION
We compare the document × topic matrix θ for two independent topic solutions by calculating the mutual information (MI) and VI values both on training (80% of corpus) and test (20% of corpus) S CHOOL OF E LECTRICAL , E LECTRONIC AND C OMPUTER E NGINEERING
61
C HAPTER F OUR
A N E VALUATION F RAMEWORK FOR T OPIC M ODELS
sets of the CRAN and Reuters corpus for 100 topics. The experiment was repeated ten times across vocabulary dimensions 100% to 30% at intervals of 10%. The vocabulary dimension was reduced randomly for each run of the experiment. A lower VI measure indicates more similarity between the two topic solutions and a higher MI measure indicates more mutual information between the two topic solutions. Tables 4.9 - 4.16 illustrate these results. Information-theoretic performance indicators are flexible in the sense that they can be applied to soft clusters and handle different number of clusters in two cluster solutions. However, it is difficult to interpret the results. It is not clear what the differences in VI measures between the multinomial mixture and LDA models as reported in the results mean, and the differences between the training-set and test-set measures are equally hard to interpret. Thus, although the values generally change only weakly (though statistically significantly) with the dimensionality of the feature vector, the lack of a suitable framework for interpreting these results discourages us from using the information-theoretic measures for our main comparisons.
4.7
EVALUATION FRAMEWORK
In this chapter we have discussed stability-based validation as a measure to evaluate the performance of topic models across vocabulary dimensions. Stability-based validation acts in a more stable fashion across vocabulary dimensions than perplexity. The choice of perturbation method depends on the topic model being evaluated. For example, a NB classifier as probability density estimator to transfer a topic model solution from one data set to another is appropriate when evaluating the multinomial mixture model. Now that we have a suite of tools available, we propose the following evaluation framework for topic models: 1. To evaluate performance between different topic models, use perplexity 2. To evaluate performance across number of topics, use perplexity. 3. To evaluate performance across vocabulary dimension for the LDA topic model, use stability-based validation with one of the following perturbation methods: (a) Initialisation (b) Transfer through means of a SVM probability density estimator
S CHOOL OF E LECTRICAL , E LECTRONIC AND C OMPUTER E NGINEERING
62
C HAPTER F OUR
A N E VALUATION F RAMEWORK FOR T OPIC M ODELS
Table 4.9: Variation of information (VI) on the training and test set - Multinomial mixture, CRAN corpus Dimensionality p-value 100% 90% 80% 70% 60% 50% 40% 30%
Multinomial Mixture Train Test 4.7×10⁻²¹ 0.0009 Average Variance Average Variance −07 1.21 4.5×10 2.33 0.018 1.21 1.9×10−07 2.33 0.011 −07 1.2 9.3×10 2.34 0.052 1.21 5.8×10−07 2.3 0.052 1.21 1.2×10−06 2.37 0.021 −07 1.21 4.8×10 2.68 0.009 1.2 5.1×10−06 2.13 0.062 −06 1.2 7.4×10 2.69 0.005
Table 4.10: Variation of information (VI) on the training and test set - LDA, CRAN corpus Dimensionality p-value 100% 90% 80% 70% 60% 50% 40% 30%
Latent Dirichlet Allocation Train Test 7.6×10−53 3.6×10−08 Average Variance Average Variance 1.19 2.2×10−05 3.71 8.2×10−05 1.19 1×10−05 3.71 0.00028 −06 1.2 5.9×10 3.56 0.0030 1.21 1.8×10−05 3.38 0.031 −06 1.23 3.5×10 3.83 0.0027 1.25 8.4×10−07 3.78 0.0733 1.25 1.6×10−05 3.96 0.0036 −08 1.25 5.4×10 4.01 1.9×10−06
S CHOOL OF E LECTRICAL , E LECTRONIC AND C OMPUTER E NGINEERING
63
C HAPTER F OUR
A N E VALUATION F RAMEWORK FOR T OPIC M ODELS
Table 4.11: Variation of information (VI) on the training and test set - Multinomial mixture, Reuters corpus Dimensionality p-value 100% 90% 80% 70% 60% 50% 40% 30%
Multinomial Mixture Train Test 1.8×10−08 0.002 Average Variance Average Variance −21 0.32 7.8×10 1.02 4.0×10−05 −10 0.32 7.7×10 1.03 2.4×10−06 0.32 5.1×10⁻¹⁰ 1.03 7.6×10−06 −09 0.32 1.7×10 1.03 9.6×10−06 −09 0.32 2.6×10 1.03 1.5×10−05 0.32 4.5×10−09 1.04 6.0×10−06 −09 0.32 3.4×10 1.04 1.8×10−06 0.32 2.0×10−09 1.05 7.5×10−06
Table 4.12: Variation of information (VI) on the training and test set - LDA, Reuters corpus Dimensionality p-value 100% 90% 80% 70% 60% 50% 40% 30%
Latent Dirichlet Allocation Train Test 2.7×10−07 0.0042 Average Variance Average Variance 0.32 8.1×10−06 1.023 1.9×10−05 0.32 7.3×10−06 1.026 5×10−06 0.32 9.0 ×10−06 1.030 7.7×10−06 −09 0.319 5.3×10 1.029 1.2×10−05 0.319 6.9×10−09 1.026 4.1×10−05 −09 0.319 1.6×10 1.033 3.5×10−05 −09 0.319 5.3×10 1.041 8.6×10−06 0.319 5.1×10−09 1.047 5.7×10−05
S CHOOL OF E LECTRICAL , E LECTRONIC AND C OMPUTER E NGINEERING
64
C HAPTER F OUR
A N E VALUATION F RAMEWORK FOR T OPIC M ODELS
Table 4.13: Mutual Information (MI) on the training and test set - Multinomial mixture, CRAN corpus Dimensionality p-value 100% 90% 80% 70% 60% 50% 40% 30%
Multinomial Mixture Train Test 4.6×10⁻²⁰ 0.0009 Average Variance Average Variance −07 0.023 1.1×10 0.85 0.0046 0.022 5.2×10−08 0.84 0.0028 −07 0.022 2.4×10 0.84 0.013 0.022 1.4×10−07 0.86 0.013 0.024 3.0×10−07 0.82 0.0051 0.024 1.2×10−07 0.67 0.0023 0.027 1.3×10−06 0.94 0.015 −06 0.028 2.1×10 0.67 0.0013
Table 4.14: Mutual information (MI) on the training and test set - LDA, CRAN corpus Dimensionality p-value 100% 90% 80% 70% 60% 50% 40% 30%
Latent Dirichlet Allocation Train Test 7.5×10−53 3.0×10−08 Average Variance Average Variance 0.035 5.4×10−07 0156 2.1×10−05 0.033 2.5×10−06 0.160 7.6×10−05 0.028 1.5×10−06 0.241 0.0011 0.022 4.6×10−06 0.320 0.0076 −06 0.013 4.1×10 0.1 0.00067 0.0047 8.7×10−07 0.122 0.018 0.0022 2.1×10−07 0.031 0.00089 0.0012 1.6×10−08 0.007 3.0×10−07
S CHOOL OF E LECTRICAL , E LECTRONIC AND C OMPUTER E NGINEERING
65
C HAPTER F OUR
A N E VALUATION F RAMEWORK FOR T OPIC M ODELS
Table 4.15: Mutual information (MI) on the training and test set - Multinomial mixture, Reuters corpus Dimensionality p-value 100% 90% 80% 70% 60% 50% 40% 30%
Multinomial Mixture Train Test 2.7×10⁻¹¹ 0.002 Average Variance Average Variance −11 0.00073 7.8×10 0.031 1.0×10−05 −10 0.00079 1.2×10 0.031 5.8×10−07 0.00078 1.1×10⁻¹⁰ 0.028 2.1×10−06 −10 0.00082 1.9×10 0.033 2.8×10−06 −10 0.00088 14.4×10 0.031 4.3×10−06 0.00086 6.3×10⁻¹⁰ 0.03 1.7×10−06 −10 0.00095 5.5×10 0.027 4.3×10−07 0.001 5.2×10⁻¹⁰ 0.025 2.6×10−06
Table 4.16: Mutual information (MI) on the training and test set - LDA, Reuters corpus Dimensionality p-value 100% 90% 80% 70% 60% 50% 40% 30%
Latent Dirichlet Allocation Train Test 9.2×10−06 2.7×10⁻¹¹ Average Variance Average Variance 0.0027 7.9×10⁻¹⁰ 0.16 2.2×10−05 0.0026 3.1×10−09 0.16 6.6×10−05 0.0024 8.0×10⁻¹⁰ 0.30 0.0005 0.0027 7.8×10⁻¹⁰ 0.28 0.0094 −09 0.0026 3.1×10 0.15 0.001 0.0024 7.9×10⁻¹⁰ 0.09 0.001 0.0025 1.7×10−09 0.075 4.9×10−06 0.0024 6.9×10⁻¹⁰ 0.098 7.9×10−07
S CHOOL OF E LECTRICAL , E LECTRONIC AND C OMPUTER E NGINEERING
66
C HAPTER F OUR
A N E VALUATION F RAMEWORK FOR T OPIC M ODELS
4. To evaluate performance across vocabulary dimension for the multinomial mixture topic model, use stability-based validation with one of the following perturbation methods: (a) Initialisation (b) Transfer through means of a NB probability density estimator
4.8
CONCLUSION
The two biggest challenges when measuring the performance of a topic model, are the unsupervised nature of the data and the creation of probabilistic ‘soft’ document clusters, rather than ‘hard’ clusters. The most common measure used to evaluate topic models, i.e. perplexity, solves these problems by using a word-predictability criterion. However, perplexity values computed with different feature sets are not comparable. An alternative performance measure for cluster solutions is stability-based validation. In this chapter we have shown that a modified version of this technique is a useful alternative performance measure for topic models that does not suffer from the vocabulary dependency of perplexity. The three major steps of stability-based validation are cluster solution transfer from one data set to another, alignment of cluster solutions and the calculation of the stability index. The existing applications of stability-based validation are in the field of hard clusters and not directly applicable to the soft clustering solutions produced by topic models. We presented an adaptation of stability-based validation for topic models in each one of the three major steps of the method. Furthermore, we also investigated initialisation as an alternative perturbation method to topic solution transfer. At the core of transferring a topic solution from one data set to another is choosing an appropriate classifier, or in our case, probability density estimator. We investigated Naive Bayes classifiers and SVM regression techniques for this purpose. Using the SVM regression as a probability density estimator to evaluate LDA performance revealed interesting topic model behaviour at low vocabulary dimensions: the feature set is too sparse and consequently ‘meaningless’ topics are produced. The effect is more pronounced at a higher number of topics. We propose excluding the meaningless topics from the inferred topic set before evaluating the topic model performance. This results in more stable performance measures across vocabulary dimensions. The focus of topic model performance evaluation in this thesis is across vocabulary dimensions and although perplexity is suitable to evaluate performance between different topic models and S CHOOL OF E LECTRICAL , E LECTRONIC AND C OMPUTER E NGINEERING
67
C HAPTER F OUR
A N E VALUATION F RAMEWORK FOR T OPIC M ODELS
across different number of topics, our results have shown that stability-based validation acts in a more stable fashion across vocabulary dimensions than perplexity. However, no one method is suitable for all topic models and we propose an evaluation framework depending on the type of evaluation and topic model used. The performance measure, or stability index for stability-based validation is document correlation, which has an intuitive interpretation. Information-based measures, such as variation of information and mutual information do not provide consistent measures across different conditions, and are difficult to interpret.
S CHOOL OF E LECTRICAL , E LECTRONIC AND C OMPUTER E NGINEERING
68
C HAPTER F IVE
S TRUCTURING F EATURES
5.1
INTRODUCTION
The input data to topic models are contained in a document × word matrix and the output data in document × topic and topic × word matrices (see figure 2.3 in chapter 2). The topic × word matrix can be described as a probability vector over words for each topic, and words with high probabilities are then most representative of a particular topic. Table 3.1 in chapter 3 is an example of the top-10 words with the highest probabilities for two topics from the Associated Press (AP) corpus. The topic on the left has to do with finance as words like ‘dollar’ and ‘new’ ‘york’ are in the top-10 words. The topic on the right has to do with some event in Saudi Arabia as is apparent in the top-10 words. The bag-of-words representation is the standard representation used with topic models such as LDA and multinomial mixtures. The bag-of-words approach treats each word in the corpus vocabulary as a feature and makes the assumption that all words are independent of one another. The bag-of-words approach turns natural text in multiple documents into a word × document matrix where cellij represents the frequency of wordi in documentj . The advantage of the bagof-word approach is that it simplifies the computational process of the topic model significantly because of the independence assumption. The limitation of the bag-of-words approach is that 69
C HAPTER F IVE
S TRUCTURING F EATURES
significant phrases get lost in the use of single terms, because critical word order and phrases are not captured. Even if terms that form part of a phrase are listed in the top-n words of a topic, it is a fragmented representation and is often duplicated by means of plural or other inflectional forms. Examples of phrases that get lost in the bag-of-word approach are ‘New York’, ‘cold feet’, ‘fast food’ and ‘white house’. This leads to reduced intelligibility of topic models. Part of the data pre-processing for the bag-of-words approach is the removal of a list of stop words, which are common words such as function words, prepositions, conjunctions and articles. The idea is that by removing these words from the vocabulary, they will not end up in the top-n words of a topic. Even after they are removed, some non-descriptive words still end up as words with high probabilities and thereby hamper the interpretation of topics. For example, it is not clear in which way the word ‘two’ in the top-10 words in the right hand topic in table 3.1 contributes to the interpretation of the topic. In this chapter we investigate the structuring of words or features into concepts that maintain the most important advantages of the bag-of-words assumption, but also introduce other benefits that cannot be obtained with single terms. The input data to the topic model remains a document × ‘unit’ matrix where unit represents a concept of one or more words. In De Waal and Barnard (2007), we introduced the use of word co-occurrence statistics to structure words into concepts. This is different from the bigram approach, in the sense that we do not use sequential co-occurrence of words. At the core of this technique is the calculation of the correlation coefficient between word pairs in vocabulary based on co-occurrences in documents. The word pairs with correlation coefficient above a chosen threshold form the new concepts to be used in the concept × document matrix, rather than word × document matrix. The objective of this approach is to reduce the parameter dimensions, but still provide the topic model with sufficient information about the documents in order to discover ‘true’ latent topics. A second objective is to increase the intelligibility of the topic model output with two-word concepts, rather than single terms. We also turn to the field of natural language processing (NLP) with the aim of reducing feature space dimensionality. We study different syntactic strategies to group adjacent words into concepts. At the core of this approach is part-of-speech (POS) tagging of words in the corpus: A sequence of non-overlapping words are grouped based on their POS tags, forming a concept. In this chapter we investigate different feature structuring strategies and evaluate their implementation for topic models using the evaluation framework derived in chapter 4. Based on the S CHOOL OF E LECTRICAL , E LECTRONIC AND C OMPUTER E NGINEERING
70
C HAPTER F IVE
S TRUCTURING F EATURES
results obtained in chapters 3 and 4, we use the LDA model as the topic model in this chapter.
5.2
RELATED WORK
The vocabulary of a text corpus defines the parameter space of a topic model. The accurate representation of the corpus through topics (and therefore the value of topic models) is challenged by this high dimensional, data sparse parameter space (Rigouste et al., 2007). Strategies to address this issue have been developed, such as vocabulary reduction. In fact, Rigouste et al. (2007) have indicated a significant increase in performance of topic models when reducing the vocabulary size significantly (900 out of 40,000 words). Only frequent words were kept in the data set, discarding rare words. In the field of text categorization, feature selection criteria such as mutual information are often used to reduce the vocabulary size in order to increase model performance (Dumais, 1998). Slonim and Tishby (2000) used the information bottleneck method (Tishby et al., 1999) to extract words capturing most information about a document. The full vocabulary is then replaced with the word clusters. The information bottleneck method was then applied again on this compact representation of document information in order to create document clusters. In this way, the original high dimensional vocabulary space is reduced significantly, thereby increasing the performance of the algorithm. The information bottleneck method differs from probabilistic topic models in the sense that it makes no statistical assumption about the structure of the data (no hidden variables are defined). The relaxation of the bag-of-words assumption provides a wealth of opportunity for better interpretation of topic models. Word order is very important for lexical meaning (Wang et al., 2007). More specifically, collocation is a term for two or more words that stand next to one another, for example ‘fast food’ and ‘easy money’. In many contexts, the collocation can have a particular meaning – in addition to the two examples in the previous sentence, consider ‘white house’ in a political context. As Wang et al. (2007) pointed out, a phrase as a whole carries more information than the sum of its individual terms and it makes more sense to use phrases for topic models than individual words. Although n-gram approaches provide more contextual information, they come with a high price in computational complexity (Wallach, 2006; Wang et al., 2007). To address this problem,
S CHOOL OF E LECTRICAL , E LECTRONIC AND C OMPUTER E NGINEERING
71
C HAPTER F IVE
S TRUCTURING F EATURES
Wang et al. (2007) extends the bag-of-word assumption and introduces topical N-gram models: In the generative process, a topic is sampled for each word and then the words status as unigram or n-gram is determined based on context. The model then samples the word from a topic-specific unigram or n-gram distribution. The statistical simplicity of models based on the bag-of-words assumption is lost in this approach and although the n-gram output produces better interpretation of the topics, it is not clear whether or not it performs better than topic models based on the bag-of-word assumption such as LDA. In the bigram topic and topical n-gram models, the structured features are embedded in the parameter space of the topic model which complicates the inference process of the model. Probabilistic topic models with bag-of-words assumptions, such as LDA, have proven to be successful as well as computationally efficient (Rigouste et al., 2007; Griffiths and Steyvers, 2007; Wang and McCallum, 2006). Blei and Lafferty (2009) also aim to achieve better interpretability of topics while following a bag-of-words approach to topic modelling. Instead of structuring features as a data preprocessing task, a strategy was implemented in Blei and Lafferty (2009) that finds significant n-grams related to inferred topics as a post-processing task. Intuitively, the n-grams are more descriptive than unigrams to understand what a topic is about. The bag-of-word approach is used to fit a topic model to a corpus as usual. The posterior distribution is used to annotate each word occurrence in the corpus with its most probable topic. The annotated corpus is then used to extract the most significant n-grams for each topic, using statistical co-occurrence analysis. The n-grams are combined with the unigrams to provide a better description of topics. In this way, the statistical simplicity of LDA is preserved and as a post-processing task, the interpretability of the topics is enriched.
5.3
DATA PREPROCESSING
Data preprocessing is an essential task for topic modelling. It improves the performance of the topic model by removing features from the document × word matrix that hamper both the performance and interpretability of the model. The following data preprocessing tasks are performed routinely with topic modelling exercises. • Stop words (Salton, 1999) are removed from the corpus as these words are found to be common in all topics. S CHOOL OF E LECTRICAL , E LECTRONIC AND C OMPUTER E NGINEERING
72
C HAPTER F IVE
S TRUCTURING F EATURES
• Words occurring only once in the corpus are removed as these words have no statistical properties. • All entries in the corpus that are not natural language are removed. This includes special characters, symbols and numbers. 5.3.1
STEMMING
Stemming involves the process of mapping a word to its root or stem by stripping off the word ending (Jurafsky and Martin, 2000). For example, stemming the words ‘catnip’, ‘cats’ and ‘catlike’ will reduce all words to ‘cat’. The words ‘industrial’ and ‘industry’ will be reduced to ‘industri’. Stemming is a very effective data preprocessing task to reduce the feature space of the document × word matrix. It merges the occurrences of similar words and consequently reduces the dimensionality and sparseness of the feature space. For interpretation purposes, it is not necessary to distinguish between ‘cat’ and ‘cats’ and stemming these words has a positive effect on the modelling process. However, stemming can be too greedy and thereby hamper the interpretation of topic model output. This is especially true for non-homogeneous, poorly defined corpora where the user has no prior knowledge about the content of the data such as in the digital forensic application that will be discussed in chapter 6. The effect of stemming on forensic data and the interpretation thereof in a topic modelling context was shown to be problematic in De Waal et al. (2008). 5.3.2 LEMMATISATION Lemmatisation involves the process of mapping a word to its lemma. For example, the words ‘go’, ‘goes’, ‘going’ and ‘went’ are inflected forms of the lemma ‘go’, and ‘sung’, ‘sang’, ‘sing’ are inflected forms of the lemma ‘sing’. The mapped lemma often has an easier interpretation than the mapped stem of a word. Lemmatisation successfully reduces the feature dimension of the document × word matrix. Furthermore, it has the potential to increase the ‘variety’ in the top-n words of topics by removing the inflected forms of words. Table 5.1 gives a comparison of the feature space dimensions for all words in the vocabulary with stemming and lemmatisation. In the remainder of this thesis we use lemmatisation as a standard preprocessing task to map words to their lemmas.
S CHOOL OF E LECTRICAL , E LECTRONIC AND C OMPUTER E NGINEERING
73
C HAPTER F IVE
S TRUCTURING F EATURES
Table 5.1: Vocabulary reduction using stemming and lemmatisation Data set CRAN Reuters
All words 4437 15822
Stemming 4108 14392
Lemmatisation 4230 14881
So far in this section we have discussed data preprocessing tasks to reduce the feature dimension of the document × word matrix. One of the objectives of structuring features that we discuss in this chapter is to reduce the dimensionality of the feature space. It is, however, not the only objective. The main idea is to provide the topic model with features that have more inherent meaning than single terms and by doing so, assist the topic model in producing ‘better’ topics both in performance and interpretability. The performance is measured by the stability index and the interpretability is measured by the top-n words of a topic. The two approaches that we follow are structuring features by means of word statistics and natural language processing, respectively.
5.4
STRUCTURING FEATURES WITH WORD STATISTICS
In this section we introduce an alternative approach towards the relaxation of the bag-of-words assumption, namely the use of word co-occurrence statistics. We form 2-word concepts using word pairs with a high number of co-occurrences across documents in a corpus: From natural text, a document × word matrix is constructed where the cells represent the word frequencies in documents. This statistic is used to associate words that co-occur frequently by calculating the correlation coefficient between each word pair in the vocabulary of the corpus. Word pairs with a high correlation coefficient are then included in a new document × concept matrix. This is done by setting a lower threshold on the correlation coefficient of the word pairs. This approach aims to both reduce the parameter dimensionality and retain the maximum amount of information in the data; the data should reflect the way in which documents are generated. The approach can be described as follows: 1. Preprocess data by removing stop words and numbers and create the corpus vocabulary. 2. Create a document × word matrix 3. Calculate the correlation coefficient (ρ) between each word pair (represented as columns in S CHOOL OF E LECTRICAL , E LECTRONIC AND C OMPUTER E NGINEERING
74
C HAPTER F IVE
S TRUCTURING F EATURES
the document × word matrix) in the vocabulary of the corpus. The frequency of each word in each document serves as the observations. 4. Set a lower threshold for ρ. 5. Create an index for word pairs with ρ above the threshold. These word pairs form concepts. 6. To determine the frequency of the concept in each document, use the smallest frequency count of these two words in the document as the co-occurrence value. 7. Create a new concept × document matrix to be used as the input matrix for topic modelling. 8. Remove all concepts occurring only once in the corpus. 9. Remove all empty documents. We name this approach word-to-concept in order to distinguish it from the bag-of-words approach. Figure 5.1 illustrates an example of the document × word matrix used for the bag-ofwords approach and figure 5.2 illustrates an example of the document × concept matrix used for the word-to-concept approach. 5.4.1 EXPERIMENTAL EVALUATION We applied the word-to-concept approach to the CRAN corpus. The document × word matrix is of size 1161 × 4437 and the document × concept matrix is of size 1161 × 1568 for a lower threshold of ρ = 0.6, meaning that we only include word pairs with a correlation coefficient higher than 0.6. In the word-to-concept process, word pairs that occur only once are removed. This action leaves a certain percentage of documents empty. For the case ρ = 0.6, the word pairs constitute 35% of the original vocabulary size and 17% of documents are empty. We name the two sets of topics Tbow (to represent the topics inferred from the document × word matrix) and Tconcepts (to represent the topics inferred from the document × concept matrix). Tbow and Tconcepts were aligned using the Hungarian method as discussed in chapter 4 to compare topic outputs. Table 5.3 gives examples of a few aligned topics inferred from the CRAN corpus. The topics are represented by the top-10 words or concepts with the highest probabilities in the vocabulary. One interesting observation is that the word-to-concept approach picks up many 2-grams, for example ‘wind tunnel’ and ‘leading edge’. The 2-grams are not necessarily in the correct order. One S CHOOL OF E LECTRICAL , E LECTRONIC AND C OMPUTER E NGINEERING
75
C HAPTER F IVE
S TRUCTURING F EATURES
Table 5.2: Results of word-to-concept experiment - CRAN corpus Threshold
bag of words 0.3 0.4 0.5 0.6 0.7 0.8
% Feature dimension of original vocabulary 100% 165% 85% 48% 27% 17% 11%
% Empty documents
Stability S(A)
0% 0.8% 3% 9% 17% 27% 55%
0.5216 0.5062 0.3742 0.3510 0.3672 0.3528 0.4951
index
disadvantage of the word-to-concept approach is that word repetitions are picked up frequently in different combinations with other words. We investigate feature space dimension and the stability index at different correlation coefficient thresholds. We report the results on the CRAN corpus in table 5.2. The first line in the table contains the results for bag-of-words. For all thresholds levels, a lower stability index than bag-of-words is achieved, even though the feature dimensions are lower. 5.4.2
DISCUSSION
The aim of the word-to-concept method is to reduce feature space dimensionality and to preserve the way in which documents are generated, which is represented by the stability index. Furthermore, it should improve the intelligibility and interpretation of topics produced. We found a few shortcomings to the method: 1. Concepts are not rich in variety as can be seen in the high occurrence of word repetition, or slight deviations of word repetition. 2. The newly formed feature has a fixed size of two words. 3. Constructing the word × word correlation coefficient matrix is computationally expensive. 4. The stability index is lower than for the bag-of-word vocabulary dimension. 5. This approach results in a number of empty documents - which excludes the documents from topic × document cluster results.
S CHOOL OF E LECTRICAL , E LECTRONIC AND C OMPUTER E NGINEERING
76
C HAPTER F IVE
S TRUCTURING F EATURES
Figure 5.1: Document × word matrix
Figure 5.2: Document × concept matrix
Table 5.3: Comparison of topics: Bag-of-words (top) and word-to-concept (bottom) approach CRAN corpus Topic 5 layer boundary heat transfer wall temperature laminar surface flow number Topic 1 layer boundary number mach transfer heat reynolds number two dimensional leading edge attack angle wind tunnel skin friction oxygen shell
Topic 2 heat temperature field magnetic flow ion time thermal heating results Topic 2 water resistance orbits eccentricity propulsive exit products combustion perigee eccentricity scale full period eccentricity wind panel friction particle thermoelastic photo
Topic 31 flight pressure boom altitude shock number mach airplane intensity sonic Topic 16 number mach bomber altitude feet airplanes altitudes altitude bomber airplanes feet bomber booms altitude booms bomber fighter bomber fighter altitude
Topic 41 heat transfer cylinder rate stagnation number local rates point coefficients Topic 5 skin friction layer boundary ignition heated mechanism ignition mount engine reynolds number ignition flame nitric freezing oxide freezing oxide nitric
S CHOOL OF E LECTRICAL , E LECTRONIC AND C OMPUTER E NGINEERING
77
C HAPTER F IVE
S TRUCTURING F EATURES
On the other hand, we do find that the word-to-concept approach produces keywords that are more informative than those derived from bag-of-words features. We turn to the field of natural language processing (NLP) for an alternative approach to structure meaningful features for topic models, in the hope of achieving similar benefits without the disadvantages observed with the word-to-concept method.
5.5
STRUCTURING FEATURES WITH CHUNKING
One of the goals of NLP is to search for structure and meaning in streams of text. The most common methods to perform these tasks are segmentation and labelling. Segmentation comprises breaking up a stream of characters into ‘linguistically meaningful segments’, such as words or phrases. These segments are then labelled with their respective part-of-speech categories. The search for structure and meaning can be construed as a combination of segmentation and labelling. The most common segmentation of a stream of characters is words, but in many cases this is not the optimal segmentation. In the case of segmentation on word level, phrases such as collocations and other noun phrases (like ‘name + surname’) are not identified. When identifying pieces of syntactic structures, such as noun phrases, we need to identify the boundaries of a defined word sequence that constitute the specific noun phrase. In this section, we investigate the segmentation of multi-word sequences, rather than stand alone words for the purpose of creating concepts. The segmentation is based on a non-overlapping sequence of words that makes syntactic sense. These segments are named ‘chunks’. Figure 5.3 is an example of labelling and segmentation on word (smaller boxes) and chunking (large boxes) level. Two noun phrases are identified: ‘He’ and ‘the big dog’. The process of chunking starts with splitting streams of text into words, classifying the words (part-of-speech tagging) and then chunk sequences of part-of-speech tags based on typical phrase patterns. Chunking is also called partial parsing as it is akin to parsing. However, it does not segment streams of words into a strict hierarchy as is done in normal parsing. A key motivation for chunking is that it is robust and efficient as compared to parsing (Bird et al., 2009). In this section we explain the chunking procedure, starting with the labelling task. We furthermore discuss different segmentation strategies and the influence of this on structuring features for topic models.
S CHOOL OF E LECTRICAL , E LECTRONIC AND C OMPUTER E NGINEERING
78
C HAPTER F IVE
5.5.1
S TRUCTURING F EATURES
TAGGING
The first step in the chunking process is to label, or tag words. For the purpose of tagging, we assume words and punctuation markers to be the tokens in streams of text. Tagging is the assignment of part-of-speech labels to each token in the corpus. We use the Penn Treebank part-of-speech tagset (Marcus et al., 1993) (Table 5.4). We use a simple bigram tagger, trained on the Penn Treebank Corpus to classify the words into part-of-speech tags. A bigram tagger is a statistical tagger that assigns a tag that is most likely for the particular word, in its current context with the preceding word. The basic idea is that it chooses the tag that maximises P (word|tag)P (tag|previous word)
(5.1)
or in other words, the tag that is most likely to generate the word to be tagged, given the tag of the preceding word. We combine the bigram tagger with a unigram tagger as well as a default tagger as backoff algorithm if the bigram tagger fails to tag the word. The default tagger tags a word as a noun by default. This tagger combination achieves an accuracy of 88.56% on the Penn Treebank corpus. 5.5.2
SEGMENTATION
The next step in the chunking process is to segment the tagged words into meaningful, nonoverlapping phrases. Many different phrases can be defined to be chunked, such as verb phrases, noun phrases and even more specifically, proper noun phrases. For the purpose of structuring features for topic models, we are interested in noun and verb phrases and different patterns thereof. These patterns are defined according to a chunk grammar that consists of rules on how sentences should be chunked (Bird et al., 2009). Regular expressions are the ‘language’ of the chunk grammar, defining the rules to segment phrases in a stream of text. They are written in a standardised way that can be interpreted by a regular expression processor.
S CHOOL OF E LECTRICAL , E LECTRONIC AND C OMPUTER E NGINEERING
79
C HAPTER F IVE
S TRUCTURING F EATURES
Figure 5.3: Segmentation (blocks) and labelling at word and chunk levels
Table 5.4: Penn Treebank tagset CC CD DT EX FW IN JJ JJR JJS LS MD RP SYM TO UH VB VBD VBG VBN VBP VBZ WDT WP
Coord Conjunc Cardical number Determiner Existential there Foreign Word Preposition Adjective Adj., comparative Adj., superlative List item marker Modal Particle Symbol ‘to’ Interjection Verb, base form Verb, past tense Verb, gerund Verb, past part Verb, non-3sg, pres Verb, 3sg, pres Wh-determiner Wh-pronoun
and, but, or one, two the, some there mon dieu of, in, by big bigger biggest 1, One can, should up, off +,%,& to oh, oops eat ate eating eaten eat eats which, that what, who
NN NNS NNP NNPS PDT POS PRP PP$ RB RBR RBS WP$ WRB $ # “ ” ( ) , . :
Noun, sing or mass Noun, plural Proper Noun, sing. Proper noun, plural Predeterminer Possessive ending Personal pronoun Possessive pronoun Adverb Adverb, comparative Adverb, superlative Posessive-Wh Wh-adverb Dollar sign Pound sign left quote right quote Left paren Right paren Comma Sent-final punct Mid-sent punct
S CHOOL OF E LECTRICAL , E LECTRONIC AND C OMPUTER E NGINEERING
dog dogs London Londoners all, both ’s I, you, she my, one’s quickly faster fastest whose how, where $ # “ ” ( ) , .!? :;-...
80
C HAPTER F IVE
5.5.2.1
S TRUCTURING F EATURES
A NOTE ON REGULAR EXPRESSION NOTATION
Before we consider segmentation patterns using regular expressions, we list the most commonly used elements of regular expression notation in table 5.5. Table 5.5: Regular expressions notation . ? * + {n,m}
Angle brackets group contents into units Wildcard operator Zero or one repetitions of the preceding character Zero or more repetitions of the preceding character One or more repetitions of the preceding character n to m repetitions of the preceding character
Some examples of segmentation patterns using regular expressions are: • ‘+’ matches one or more repetitions of the tag NN. • ‘’ matches NN or JJ. • The period wildcard operator is constrained not to cross tag delimiters, so that ‘’ matches any single tag starting with N, e.g. NN, NNS. • The pattern ‘*+’ can be interpreted as follows: chunk all tags starting with ‘JJ’ followed by one or more repetitions of all tags starting with ‘NN’. • ‘
?*+’ will chunk any sequence of words starting with an optional determiner, followed by zero or more adjectives of any type, followed by one or more nouns of any type (Bird et al., 2009). 5.5.2.2
DATA PREPARATION
Before applying segmentation to a corpus, the corpus needs to be split into sentences, otherwise chunks will cross sentence boundaries, which does not make sense. Furthermore, we do not remove stopwords from the corpus, as this will interfere with the tagging process. Instead, we use the full corpus with all words, numbers and punctuation to be tagged and chunked. More than one tag pattern can be applied consecutively over the tagged sequence, allowing for a richer and more complex chunking strategy. Lastly, we perform lemmatization on the corpus. This procedure
S CHOOL OF E LECTRICAL , E LECTRONIC AND C OMPUTER E NGINEERING
81
C HAPTER F IVE
S TRUCTURING F EATURES
collapses the different inflectional forms of a lemma, thereby reducing the vocabulary size of the corpus to some extent. 5.5.3
CHUNKING PROCESSES FOR TOPIC MODELS
One of the objectives of chunking for topic modelling is to reduce the dimensionality of the feature space. Furthermore, it should improve the intelligibility of the topics. In a sense these two objectives cause ambivalence when designing a segmentation pattern. On the one hand, we want the chunk to be as exhaustive as possible (to improve intelligibility) but on the other hand the chunk should be as generic as possible in order to cover as many as possible occurrences over all documents and hence, reduce the dimensionality of the parameter space. 5.5.3.1
NOUN PHRASES
Our first chunking process is to include only noun phrases in the feature set with regular expression +. This will include any number of adjacent nouns of any kind (see table 5.4). 5.5.3.2
NOUN AND VERB PHRASES
This chunking process is made up with two patterns: The first pattern includes any number of adjacent nouns of any kind - +. The second pattern includes any number of adjacent verbs of any kind - +. 5.5.3.3
VERB AND NOUN WITH ADJECTIVES PHRASES
This chunking process is made up with two patterns: The first pattern includes any number of adjacent verbs of any kind - +. The second pattern is made up of zero or more adjectives, followed by one or more nouns - *+. 5.5.4
CHUNKING PROCESS
We describe the process of structuring features with chunking as follows: 1. Preprocess data to present full corpus with all words and punctuation to bigram tagger. 2. Tag corpus.
S CHOOL OF E LECTRICAL , E LECTRONIC AND C OMPUTER E NGINEERING
82
C HAPTER F IVE
S TRUCTURING F EATURES
3. Perform chunking algorithm of choice. 4. Use chunked phrases as features in the new document × chunk matrix. 5. Remove all concepts occurring only once in the corpus. 6. Remove all empty documents. 5.5.5
INCLUDING SIGNIFICANT CHUNKS IN THE DATA SET
As mentioned before, the bag-of-words assumption contributes to the statistical simplicity of topic models such as LDA. The features, or words, provide information to the topic model about the way in which documents were generated. Furthermore, it discriminates between documents and allocates documents to topics. Attributes of words that will do this effectively are the following: • A high variance in occurrence of the word across documents. This excludes words with a consistently high count, such as stop words, or a consistently low count across documents, such as foreign words. • At least two occurrences of the word in the corpus, otherwise it has no statistical properties. One measure of a high variance of words, or features across documents is the ratio of documents that contain one or more occurrences of the specific feature. Figure 5.4 illustrates the (sorted) ratio of documents (y axis) containing occurrences of the word, or features as represented on the x axis. A ratio of 0.5 means that 50% of documents in the corpus have at least one occurrence of the feature. The figure was generated for the CRAN corpus where the top graph represents bag-of-words features and the lower graph represents the feature set generated by the ‘+’ chunking strategy. The graphs indicate that both bag-of-words and chunking produce a small number of features with high representation in documents - most features have a small document occurrence ratio. A lower document occurrence ratio implies a higher variance in occurrence of the feature across documents. By inspection it is clear that the chunking feature set follows the same document occurrence pattern as the bag-of-words feature set. The mean document occurrence ratio is 0.0132 and 0.013 for the bag-of-words and chunking feature sets respectively. Although the structuring of chunks lowers the dimensionality of the feature space, it does not guarantee an improvement on the above mentioned attributes as can be seen both from figure 5.4 S CHOOL OF E LECTRICAL , E LECTRONIC AND C OMPUTER E NGINEERING
83
C HAPTER F IVE
S TRUCTURING F EATURES
and the mean document occurrence ratio also given in figure 5.4. In fact, the frequency of a chunk in a document is equal or lower than the lowest frequency word in the chunk. This implies that unfiltered use of the document × chunk matrix will not improve the performance of the topic model as the feature set resulting from the chunking strategy is not richer in variance across documents than the original bag-of-words feature set. In fact, some chunks could only occur once or twice in the data set. The chunk set needs to be filtered first in order to reflect the abovementioned attributes by including chunks that have a high variance across documents. Consider the document × chunk matrix in figure 5.5. We calculate a variance measure to order chunks as follows: For each document, we calculate the probability of each chunk. For each chunk, we then calculate the variance of the chunk probability across documents and experiment with different ways to normalise the variance. A new feature set only includes chunks with normalized variance above a certain threshold. The average document occurrence ratio of this feature set should be lower than that of the bag-of-words feature set. We experiment with the following strategies to normalise the variance: • No normalisation. • Normalise with the average chunk probability across documents. ± σ 2 (norm) = σ 2 (chunk) mean(p(chunk)) • Normalise with the document occurrence ratio. ± σ 2 (norm)) = σ 2 (chunk)) ratio(document occurrence) • Normalise the chunk probability across documents before calculating the variance. σ 2 (norm) = σ 2 (norm(p(chunk))) We ordered the features in ascending order of variance across documents and plotted the corresponding document occurrence ratio for different normalization strategies in figure 5.6. Once the chunk set is ordered using the normalized variance measure, the top n chunks in terms of variance are used as a new feature set to form a document × chunk matrix. All chunks on the right of the blue line are included in the new feature set. These chunks have a high variance across documents. The graphs display the document occurrence ratio of the chunks. The first graph (upper left quadrant) indicates that no normalization of the variance will select chunks with a high S CHOOL OF E LECTRICAL , E LECTRONIC AND C OMPUTER E NGINEERING
84
C HAPTER F IVE
S TRUCTURING F EATURES
bag−of−words 0.5
0.0132
0.4 0.3
document ratio
0.2 0.1 0 0
500
1000
1500
2000
2500
3000
3500
4000
chunking 0.5
0.013
0.4 0.3 0.2 0.1 0
0
500
1000
1500
2000
features
Figure 5.4: Ratio of documents containing one or more occurrences of feature (ordered)
Figure 5.5: Illustration of document × chunk matrix
S CHOOL OF E LECTRICAL , E LECTRONIC AND C OMPUTER E NGINEERING
85
C HAPTER F IVE
S TRUCTURING F EATURES
no normalisation
normalise − mean(p(word))
0.0173
0.35 0.3
0.3
0.25
0.25
0.2
0.2
0.15
0.15
0.1
0.1
0.05
0.05
0
0
500
0.0132
0.35
1000
1500
2000
0
0
500
normalise − doc occurrence ratio
0.0124
0.35
0.25
0.25
0.2
0.2
0.15
0.15
0.1
0.1
0.05
0.05 500
1000
1500
2000
2000
0.0012
0.35 0.3
0
1500
normalise p(word)
0.3
0
1000
0
0
500
1000
1500
2000
Figure 5.6: Illustration of four strategies to normalise the variance of the feature probability across documents. document occurrence ratio. The next two graphs represent a mixture of high and low document occurrence ratios included in the filtered chunks set and the last graph (lower right quadrant) represents inclusion of low document occurrence ratios. The average document occurrence scores for the four normalization strategies are indicated in the upper left corner of each graph. Although the graph in the lower right quadrant produced the lowest average document occurrence ratio, many documents are left empty when using this feature set, which does not make it a feasible feature set for topic modelling. In the next section, we calculate the stability index for the other three normalisation strategies and compare it with the bag-of-words and complete chunk feature sets. We anticipate that the topic model performance will correlate with the mean document occurrence ratio as displayed in the upper left corner of each graph in figure 5.6: A lower mean document occurrence ratio implies a higher stability index.
S CHOOL OF E LECTRICAL , E LECTRONIC AND C OMPUTER E NGINEERING
86
C HAPTER F IVE
5.6
S TRUCTURING F EATURES
EXPERIMENTAL EVALUATION
For experimental evaluation, we calculate the stability index on the document × chunk matrix for each chunking strategy and each normalisation strategy, both for the CRAN and Reuters corpora. Each experiment was repeated ten times, resetting the initial conditions of the model parameters with each iteration. The data sets are split into 80% train and 20% test sets. The number of topics for each experiment is set to 25, both for the CRAN and Reuters corpus. The rows in tables 5.6 5.7, display the results on the following matrices: • Bag-of-words: document × word matrix • All chunks: document × chunk matrix • No normalization: Subset of chunks with high variances, no normalization performed. • mean(p(chunk)): Subset of chunks with high variances, normalized with mean(p(chunk)). • ratio(documents containing chunk): Subset of chunks with high variances, normalized with ratio(document occurrence ratio). Tables 5.6 and 5.8 give a summary of the results and tables 5.7 and 5.9 display the p-values when comparing stability indices of bag-of-words with the respective chunking strategies. The results are also displayed graphically in figures 5.7 - 5.9 for the CRAN corpus. The y-axes in the figures represent the stability indexes and the x-axes represent the respective normalisation strategies. Some interesting topics are displayed in tables 5.10 - 5.15. For the CRAN corpus, each subset of chunks includes the top 1000 chunks with the highest variability across documents. For the Reuters corpus, each subset of chunks includes the top 30% with the highest variability across documents. As can be seen from the results, the best stability index is achieved with a subset of chunks where the variance is normalised with the document occurrence ratio. The chunking strategy *+, + achieves the best results.
5.7 CONCLUSIONS In this chapter we present two methods to structure features for topic modelling. The objective of these methods is to provide topic models with a feature set that satisfies the following requireS CHOOL OF E LECTRICAL , E LECTRONIC AND C OMPUTER E NGINEERING
87
C HAPTER F IVE
S TRUCTURING F EATURES
Stability Index: NN 0.86
normalise: mean(p(word))
0.84 bag−of−words 0.82
0.8 normalise: doc occurrence ratio 0.78
no normalisation
0.76
0.74 all chunks 0.72
0.7
0.68 0.5
1
1.5
2
2.5
3
3.5
4
4.5
5
5.5
Figure 5.7: Stability index; CRAN corpus - +
Stability Index: NNVB 0.95
0.9 normalise: mean(p(word)) 0.85 bag−of−words 0.8
no normalisation
0.75
0.7
normalise: doc occurrence ratio
all chunks
0.65
Figure 5.8: Stability index; CRAN corpus - ++
S CHOOL OF E LECTRICAL , E LECTRONIC AND C OMPUTER E NGINEERING
88
C HAPTER F IVE
S TRUCTURING F EATURES
Stability Index: JJNN VB 0.9
0.85 bag−of−words
normalise: doc occurrence ratio
normalise: mean(p(word))
0.8
no normalisation
0.75
0.7 all chunks 0.65
0.6
0.55
0.5 0.5
1
1.5
2
2.5
3
3.5
4
4.5
5
5.5
Figure 5.9: Stability index; CRAN corpus - *+, +
Table 5.6: Average stability index - CRAN corpus + Bag-of-words All chunks No normalization mean(p(chunk)) ratio(documents containing chunk)
Average 0.79 0.7 0.75 0.81 0.82
++ Variance 3.8×10−05 0.0001 4.1×10−05 0.0001 9.1×10−05
Average 0.79 0.65 0.76 0.81 0.83
Variance 3.8×10−05 6.6×10−05 4.1×10−05 6.6×10−05 5.8×10−05
*+, + Average Variance 0.79 3.8×10−05 0.60 0.0004 0.73 4.1×10−05 0.86 7.5×10−05 0.87 3.5×10−05
Table 5.7: P-value results for comparing bag-of-words with chunking strategies - CRAN corpus All chunks No normalization mean(p(chunk)) ratio(documents containing chunk)
+ 2.9×10⁻¹² 8.6×10−08 0.032 0.0005
++ 1.4×10⁻¹² 4.5×10⁻¹¹ 0.028 8.7×10−05
*+, + 4.2×10−09 4.5×10⁻¹¹ 2.9×10−08 2.67×10⁻¹¹
S CHOOL OF E LECTRICAL , E LECTRONIC AND C OMPUTER E NGINEERING
89
C HAPTER F IVE
S TRUCTURING F EATURES
Table 5.8: Average stability index - Reuters corpus + Bag-of-words All chunks No normalization mean(p(chunk)) ratio(documents containing chunk)
Average 0.75 0.69 0.63 0.78 0.52
++ Variance 2.3×10−05 1.7×10−05 1.2×10−05 1.8×10−05 0.0009
Average 0.75 0.69 0.64 0.83 0.83
Variance 2.3×10−05 7.4×10−06 1.6×10−05 1.9×10−05 5.3×10−05
*+, + Average Variance 0.75 2.3×10−05 0.62 1.6×10−05 0.69 1.6×10−05 0.81 1.9×10−05 0.85 8.3×10−06
Table 5.9: P-value results for comparing bag-of-words with chunking strategies - Reuters corpus All chunks No normalization mean(p(chunk)) ratio(documents containing chunk)
+ 3.2×10⁻¹³ 1.3×10−09 4.4×10−08 4.3×10−07
++ 4.5×10⁻¹² 1.3×10⁻¹⁶ 1.4×10⁻¹³ 3.7×10⁻¹¹
*+, + 5.7×10⁻¹⁸ 2.1×10⁻¹² 5.9×10⁻¹² 6.1×10⁻¹⁵
Table 5.10: Some interesting topics: CRAN corpus, + Topic 8 jet base pressure base number thrust sting loss ground effect heat release jet stagnation pressure heat release
Topic 9 distribution means similitude kernel function bluntness twist distribution influence coefficient design problem sweep angle hub
Topic 29 flow continuation fluid problem heat conduction shear flow shortcoming density variation divergence fatigue datum mathematics
Table 5.11: Some interesting topics: CRAN corpus, ++ Topic 17 equation transformation thermodynamics refinement stress ratio plate problem boundary layer fuel prediction stress level propagation
Topic 96 wind tunnel tunnel speed working calibration sting speed wind tunnel wall interference heat sink perforated
Topic 76 lift moment function roughness band stage refined bound burned altitude range crest vortex cancellation
S CHOOL OF E LECTRICAL , E LECTRONIC AND C OMPUTER E NGINEERING
90
C HAPTER F IVE
S TRUCTURING F EATURES
Table 5.12: Some interesting topics: CRAN corpus, *+, + Topic 6 jet thrust jet speed nose jet adjustment interaction shallow shell analysis shock conditions theory plastic air
Topic 44 method integral equation digital computer approximate treatment boundary layer body revolution circular cylinder field flow problem heat transfer rod additional span
Topic 94 vortex wake growth free shear layer constant velocity exerted basic equation vortex cancellation relation shockwave equation
Table 5.13: Some interesting topics: Reuters corpus, + Topic 7 stake share stock securities total exchange commission control investment firm investment purpose holding
Topic 90 wheat shipment soviet union delivery barley palm oil soviet ussr us wheat us corn
Topic 56 barrels day oil foot oil production well gas reserves discovery oil stocks gas
Table 5.14: Some interesting topics: Reuters corpus, ++ Topic 1 quota producer coffee bag export set price exporter exported tin
Topic 69 oil drilling exploration block area gallon oil co oil company heating interest
Topic 40 marks franc holding security savings assets finance ministry office loan association branch
S CHOOL OF E LECTRICAL , E LECTRONIC AND C OMPUTER E NGINEERING
91
C HAPTER F IVE
S TRUCTURING F EATURES
ments: Firstly it must reduce the feature dimension of the document × word matrix. Secondly, it must improve the performance of the topic model, by means of stability as well as interpretability of the topics inferred. The use of word statistics to structure features shows some promising results, but does not result in better stability indices than bag-of-words. Furthermore the top-n words in a topic are plagued with direct and indirect repetitions of terms. In the field of NLP, partial parsing, or chunking produces structured features that result in both better stability indices and topic interpretability. However, the set of chunks, or features needs to be filtered by including only features that are rich in variance across documents. We experiment with three chunking processes and find that the process *+, + produces the best results in terms of the stability indices it produces on both the CRAN and Reuters corpora. This process chunks verbs and nouns with adjectives respectively. The addition of adjectives to the chunks provides a rich topic description as can be seen in tables 5.15 and 5.12. We argue that structured features enrich the document × word matrix, with variability and meaning. The variability assists the topic model to better distinguish between documents and choose a mixture of topics for each document. The variability of a feature is measured by calculating the variance of document probability of a specific feature and normalising this measure. A subset of features with the highest variability serves as input features for the topic model. Normalising the document probability variance by the document occurrence ratio of a feature results in the best topic model performance. In this chapter, we introduced the structuring of features as a data preprocessing task. The objective of this approach is to provide a richer feature set to the topic model, while still preserving the statistical simplicity of the bag-of-words approach. The promising results that we have obtained are further evaluated on a practical task in the next chapter.
S CHOOL OF E LECTRICAL , E LECTRONIC AND C OMPUTER E NGINEERING
92
C HAPTER F IVE
S TRUCTURING F EATURES
Table 5.15: Some interesting topics: Reuters corpus, *+, + Topic 14 terms letter signed disclosed acquire intent definitive agreement transaction approval financial corp
Topic 74 year unemployment ratio averaged increased unemployment rate consumer price capital spending residual fuel demand rate
Topic 56 production produced year estimated increase energy cover agriculture ministry industrial production index base lake
S CHOOL OF E LECTRICAL , E LECTRONIC AND C OMPUTER E NGINEERING
93
C HAPTER S IX
T OPIC M ODELS A PPLIED TO D IGITAL F ORENSICS
”Searching for traces is not, as much as one could believe it, an innovation of modern criminal jurists. It is an occupation probably as old as humanity. The principle is this one. Any action of an individual, and obviously, the violent action constituting a crime, cannot occur without leaving a mark. What is admirable is the variety of these marks. Sometimes they will be prints, sometimes simple traces, and sometimes stains.” - Professor Edmond Locard (Chisum and Turvey, 2007)
6.1 INTRODUCTION The use and value of information obtained from digital sources in various investigations have been widely argued (Beebe and Clark, 2007; McCue, 2007). This has lead to the establishment of the term digital forensics and the subsequent growth of this field in practical applications and scientific research. The four major phases in digital investigation are acquisition, examination, analysis and reporting (Pollitt and Whitledge, 2006). It has been argued that the analysis phase (called digital 94
C HAPTER S IX
T OPIC M ODELS A PPLIED TO D IGITAL F ORENSICS
analysis from here on), where most of the actionable evidence is being gathered, lacks sufficient definition and support in terms of principles, methods, tools, etc. (Pollitt and Whitledge, 2006; Venter et al., 2007). The use of Knowledge Discovery and Data Mining (KDD) to enhance digital analysis has received some recent attention (Pollitt and Whitledge, 2006; Venter et al., 2007) and the use of KDD principles and tools in digital investigations were defined as evidence mining in Venter et al. (2007). Textual artifacts are very important in many digital investigations (Beebe and Clark, 2007; McCue, 2007) and include e-mails, reports, letters, notes, text messages, etc., collectively referred to as documents. A typical forensic evidence set contains thousands of documents. Herein lies one of the problems of digital analysis. Of the thousands of documents in an evidence set only a small proportion may be relevant and of these relevant documents only a small proportion may contain actionable evidence. Processing the thousands of text documents manually, in order to find the relevant evidence is a difficult and time consuming task. Digital analysis is mostly done through expression-based searching. This implies that a good understanding of the evidence that is looked for must exist before a search can commence. The information retrieved is not ranked (e.g. based on relevance to the case) in any manner. This situation means that latent evidence will not be found. (In this context we use the phrase “latent evidence” to refer to evidence that exists but is not directly accessible to the investigator). The latent evidence must first become visible before it can be considered in the investigation. Evidence mining aims to uncover, through the application of KDD principles and techniques, electronic artifacts that can form part of the evidence set to assist in the development of crime scenarios (Venter et al., 2007). Evidence mining includes known and latent evidence and a process to support evidence mining was defined in Venter et al. (2007) as CRISP-EM (a specialisation of the well-known CRISP-DM process (Chapman et al., 2000)). The work described in this chapter falls within the scope of the data-preparation task of CRISP-EM (see Figure 6.1). The data preparation phase covers all activities to construct a data set to be used in the next phase to do event reconstruction and modelling. The construction of this data set is obviously a challenging task and is a trade-off between choosing relevant data and loosing vital information necessary for event reconstruction. A summary of the data could be extremely helpful for the investigator to facilitate better understanding of the data content and to focus the data preparation task on relevant data. S CHOOL OF E LECTRICAL , E LECTRONIC AND C OMPUTER E NGINEERING
95
C HAPTER S IX
T OPIC M ODELS A PPLIED TO D IGITAL F ORENSICS
��������� � �����
�� ������ � �����
�� ��� ��� � ���
������������ ��
���������������
����� ���
�������� � �� ���
Figure 6.1: The main tasks of the CRISP-EM process. Topic modelling as a latent variable analysis technique can assist in associating relevant documents by modelling the underlying (latent) topics in the text collection. Additionally, it suggests prevalent themes within the text which provides a summary of the document collection. As a KDD technique, it has the potential to discover latent evidence often missed with expressionbased searching. However, digital evidence is inhomogeneous in terms of format and content, which poses unique challenges to KDD techniques. In the current research, we investigate the matters that need to be addressed to apply topic modelling to forensic data, as well as the success of such models when applied appropriately. This chapter is organised as follows. In section 6.2 the CRISP-EM process is described with special emphasis on the data preparation task. In section 6.3 topic modelling is applied to forensic data obtained from a real case and the results are presented. Section 6.4 addresses the important aspect of the interpretation of the results and how it can assist the forensic investigator. Merging the research fields of digital forensics and topic modelling is not a straightforward exercise and section 6.5 lists a number of valuable lessons learned from this case study when applying topic modelling as a KDD technique on forensic data. The chapter is concluded in section 6.6.
S CHOOL OF E LECTRICAL , E LECTRONIC AND C OMPUTER E NGINEERING
96
C HAPTER S IX
T OPIC M ODELS A PPLIED TO D IGITAL F ORENSICS
Figure 6.2: Detailed data preparation level.
6.2
THE CRISP-EM PROCESS FOR EVIDENCE MINING
The CRISP-DM consortium developed a Cross-Industry Standard Process for data mining (Chapman et al., 2000). In Venter et al. (2007) the appropriateness of applying this methodology to the evidence environment was investigated. CRISP-DM provides the opportunity for specialisation according to a pre-defined context. Venter et al. (2007) defined CRISP-EM as a specialisation of CRISP-DM in order to support the analysis phase of cyber forensic processes. CRISP-EM provides a good framework for the application of evidence mining. CRISP-EM was designed to be used in the context of a specific criminal case. Rather than mining for general trends in a case database, it provides support to an investigator on a specific case (Venter et al., 2007). The major tasks in the CRISP-EM process are displayed in figure 6.1. The contribution of topic modelling to CRISP-EM falls mainly into task 3 i.e. data preparation. The data preparation task involves the construction of a concise data set from initial raw data. This data set includes data pertaining the specific criminal case. Data preparation is described in detail in figure 6.2. The next two sections describe how topic modelling fits into the data preparation task and the
S CHOOL OF E LECTRICAL , E LECTRONIC AND C OMPUTER E NGINEERING
97
C HAPTER S IX
T OPIC M ODELS A PPLIED TO D IGITAL F ORENSICS
benefit of topic modelling to cyber forensic processes is discussed.
6.3
TOPIC MODELLING APPLIED TO FORENSIC DATA
When applied to text data, topic modelling provides a summary of the documents by describing the latent topics in the data. This leads to two useful outputs. The first output is a visual summary of the topics and the second output is a visual representation of the document space. 6.3.1
TOPIC MODELLING PROCESS
Figure 6.3 indicates the process followed to apply topic modelling to the analysis of the original forensic data. Each level represents a data set of a different nature and size. Level 1 in the figure represents the original forensic data set. Levels 2 to 4 describe the data filtering process and level 5 involves the data pre-processing step which results in the document × word input matrix for topic modelling. The topic modelling results define level 6. 6.3.2 DATA SET The data set employed in our case study can be described in parallel with the levels in the process depicted in figure 6.3. 1. The data used as a text corpus in the experiment was taken from a real digital investigation (level 1 of figure 6.3) and includes various entities (more than 100,000) such as documents, operating system files, deleted entities, page files, etc. 2. The data set and data type were selected (CRISP-EM tasks 3.1-A: Select sites/equipment/device and 3.1-B: Select types of data to be included - see figure 6.2). All the documents type files (.doc, .txt, .pdf, .html and .rtf) in the evidence set were extracted using the Forensics Toolkit from AccessData (F T K T M ). This includes only allocated, or logical type files. The data was extracted from three devices for one case. This data set of document type files is on level 2 of figure 6.3 and contained 12,483 documents. 3. The data set was reduced to documents with natural language content (CRISP-EM task 3.2A: Data Reduction). After converting the documents to text files (CRISP-EM task 3.5-A: Convert Data Formats), the data set at level 3 of figure 6.3 contained 1,661 documents. S CHOOL OF E LECTRICAL , E LECTRONIC AND C OMPUTER E NGINEERING
98
C HAPTER S IX
T OPIC M ODELS A PPLIED TO D IGITAL F ORENSICS
"
�������� �� ����
��
�
�������� ���� �����
&
������� �������� ������� �������� �� ���� ��������
%
���������� �������� �������� �� !���� ����� ������
$
��� � ������� ������
#
���� ������ ����� ������������
Figure 6.3: Topic modelling output and interpretation scheme for forensic data
S CHOOL OF E LECTRICAL , E LECTRONIC AND C OMPUTER E NGINEERING
99
C HAPTER S IX
T OPIC M ODELS A PPLIED TO D IGITAL F ORENSICS
4. By removing files such as keystroke log files, software documentation, multiple versions of the same document and files with no text (CRISP-EM task 3.2-A: Data Reduction), the data set of 837 files at level 4 of figure 6.3 was obtained. The rest of this section indicates the further processing done on the data. This relates to CRISP-EM task 3.3-D: Perform Text Processing (see figure 6.2). 6.3.3
CHUNKING PROCESSES FOR FORENSIC DATA
We apply the three chunking processes derived in chapter 5 on the data set of 837 files. These processes are: • Noun phrases: Only noun phrases in the feature set with regular expression + are included. This will include any number of adjacent nouns of any kind. • Noun and verb phrases: This chunking process are made up with two patterns. The first pattern includes any number of adjacent nouns of any kind: +. The second pattern includes any number of adjacent verbs of any kind: +. • Verb and noun with adjectives phrases: This chunking process are made up with two patterns. The first pattern includes any number of adjacent verbs of any kind: +. The second pattern are made up with zero or more adjectives, followed by one or more nouns: *+. We also investigate splitting the noun and verb phrases into two separate vocabularies. Forensic data could contain many leads on verb phrases as these elucidate intended criminal actions. If verb and noun phrases are treated as a single vocabulary, the number of noun phrases could overwhelm the number of verb phrases to such an extent that it the latter does not feature as highly probable words to represent a topic. 6.3.4 6.3.4.1
DATA PREPROCESSING BAG-OF-WORDS
As a data pre-processing task, stop words, words occurring only once in the corpus, numbers, special characters and words with two characters or fewer were removed from the data. Data S CHOOL OF E LECTRICAL , E LECTRONIC AND C OMPUTER E NGINEERING
100
C HAPTER S IX
T OPIC M ODELS A PPLIED TO D IGITAL F ORENSICS
preprocessing results in a document × word matrix and for this case study the matrix size is 837 documents × 11,698 words. This matrix defines the data set of level 5 in figure 6.3. 6.3.4.2
CHUNKING
Stop words are not removed from the corpus, as this will interfere with the tagging process. The full corpus is used with all words, numbers and punctuation to be tagged and chunked. Lemmatisation is performed on the corpus. Table 6.1 displays the feature size of each chunking strategy. The document × chunk matrix for each chunking strategy is filtered to only include chunks with a high variability across documents. In each case, only the top 30% chunks are included in the new feature set. Table 6.1: Forensic corpus - feature sizes of different chunking strategies bag-of-words ++ + + *+, +
6.3.5
Feature size 11698 12122 8994 3338 13762
Filtered features size 11698 3636 2698 1000 4130
EXPERIMENTAL EVALUATION
The LDA topic model was used to infer topics from the corpus. For simplification, the number of topics was fixed at 50. We calculate the stability index of the topic model output for the bagof-words feature set and each chunking strategy (table 6.2). We used initialisation as perturbation method to calculate the stability index. Table 6.2: Forensic corpus - stability index for different chunking strategies bag-of-words ++ + + *+, +
Stability index 0.47 0.62 0.51 0.54 0.57
The bag-of-words feature set performs the worst in terms of stability-based validation. The
S CHOOL OF E LECTRICAL , E LECTRONIC AND C OMPUTER E NGINEERING
101
C HAPTER S IX
T OPIC M ODELS A PPLIED TO D IGITAL F ORENSICS
chunking strategy ‘++’ performs the best. The output of topic models can be represented in two ways, a feature × topic matrix, which provides a visual representation of the topics, and topic × document matrix, which provides a visual representation of the document space. These two visual representations define level 6 in figure 6.3 and are discussed in the next two subsections. 6.3.6 VISUAL REPRESENTATION OF TOPICS Tables 6.3 - 6.7 display some topics inferred from each chunking strategy for the forensic corpus. In some cases, the information has been changed due to the sensitive nature of the original data. These are indicated in italic text. Table 6.3: Interesting topics: Forensic corpus, bag-of-words Topic 5 meeting company name team surname report end surname name discussion action
Topic 2 accused contract surname account support city bank tax government board
Topic 10 investigation act manner section government department terms public following pty government
Table 6.4: Interesting topics: Forensic corpus, ++ Topic 18 site dealer owned end surname february store march selling service station
Topic 6 government accused contract investment board said signed money treasury bank
Topic 47 vehicle travel services opening stock form return use register driver
The forensic data set is an extreme inhomogeneous corpus containing a diversity of natural S CHOOL OF E LECTRICAL , E LECTRONIC AND C OMPUTER E NGINEERING
102
C HAPTER S IX
T OPIC M ODELS A PPLIED TO D IGITAL F ORENSICS
Table 6.5: Interesting topics: Forensic corpus, + Topic 38 government investment money bank column division payment crime charge sheet surname
Topic 44 services budget costs proposal name service entity name expenditure contract
Topic 5 business group environment level support business unit division result share business process
Table 6.6: Interesting topics: Forensic corpus, + Topic 5 marketing contact forecast return suited consolidated lost rolling offering generated
Topic 26 related feel concerned steering work left handle turn start indicate
Topic 28 said paid called account transferred deposited worked employed engaged gave
language data such as emails, letters, invoices, documents and reports. This poses a challenge for the topic model to infer meaningful topics, and subsequent interpretation of the output. The interpretation of topic model output is a manual task prone to subjectiveness. For example, topic 5 in table 6.3 can be interpreted as dealing with team meetings and discussions, actions, reports, companies and people relevant to the meetings. Both topics 2 and 10 can be interpreted as dealing with a fraud investigation. The topics inferred from the feature set generated from the chunking strategy ++ (table 6.4) are of special interest, as this feature set has the highest stability index. Topic 18 has strong temporal (with words ‘february’ ‘march’) and identity (with words ‘dealer’ and ‘owned’) components and deals with a site or franchise of a company. Topic 6 deals with a problem involving contracts, money and government on a high level (with words
S CHOOL OF E LECTRICAL , E LECTRONIC AND C OMPUTER E NGINEERING
103
C HAPTER S IX
T OPIC M ODELS A PPLIED TO D IGITAL F ORENSICS
Table 6.7: Interesting topics: Forensic corpus, *+, + Topic 21 surname site company name dealer owned name credit held came surname
Topic 4 investment involved money payment statement received investigation believe government letter
Topic 28 accused mentioned state deparment column account regional division referred knew person accused pretended
‘board’ and ‘government’). Topic 47 deals with the logistics of transportation of goods. 6.3.7
VISUAL REPRESENTATION OF THE DOCUMENT SPACE
The mixture of topics describes the semantic context, or gist of the document (Griffiths and Steyvers, 2007). Documents with a similar mixture (topic distribution) are closely related in terms of it’s semantic context. This ‘relatedness’ of documents can be visualized in a 2D map. For each document pair, the symmetrised Kullback-Leibler divergence between topic distributions is calculated. (The Kullback-Leibler divergence is a measure of the difference between two probability distributions (Mackay, 2002).) Classical multidimensional scaling is used to visualize all pairwise document distances in the 2D map. Figure 6.4 illustrates the 2D visualisation of the forensic data documents where each symbol represents a document. The graph can be interpreted as follows: document A (indicated by symbol A in Figure 6.4) are closely related to document B in terms of their respective mixture of topics (semantic context). Documents A and C differ significantly in terms of their semantic context. For the purpose of forensic analysis it means that if document A is identified as a relevant document to the case, one would rather focus investigation efforts on document B than document C. The top-n documents associated with a topic can be listed in the same way as listing topn words associated with a topic (as in tables 6.4 - 6.7). This provides fast access to important documents in a topic of interest. For example, the document with the highest probability in topic 6 of table 6.4 deals with money laundering techniques. The document with the second highest probability in the same topic deals with a fraud investigation based on information received about S CHOOL OF E LECTRICAL , E LECTRONIC AND C OMPUTER E NGINEERING
104
C HAPTER S IX
T OPIC M ODELS A PPLIED TO D IGITAL F ORENSICS
A
B
C
Figure 6.4: Visualisation of documents in a 2D map an illegal investment. This aligns with the interpretation (even though subjective) of the top-10 words that describe the topic. The top-4 documents are highlighted in red dots in figure 6.4. It can be seen that they are closely situated on the 2D map that corresponds to their similar ranking as high priority documents in topic 6. A similar 2D map can be generated for topics, in which case it will indicate the relatedness between topics. Figure 6.5 is a 2D map of the 50 topics inferred from the forensic data set. It can be seen that topic 6, the topic of interest, is quite isolated from the other topics. The implication of such a map for digital forensics means that if a topic is identified as being relevant to the case, R then neighbouring topics on the 2D map can be prioritised in the investigation. The M atlab ° Topic Modeling Toolbox (Griffiths and Steyvers, 2004) was used to generate figures 6.4 and 6.5.
6.4
FORENSIC BENEFIT OF THE RESULTS
Topic modelling can assist cyber forensic analysts and investigators in different ways. Firstly, in a large case, with multiple data sets from multiple sites, performing topic modelling on natural language data will provide the analyst/investigator with an overview of the data in terms of the broad semantic contexts. The benefit of this is a summary of the natural language data which S CHOOL OF E LECTRICAL , E LECTRONIC AND C OMPUTER E NGINEERING
105
C HAPTER S IX
T OPIC M ODELS A PPLIED TO D IGITAL F ORENSICS
27 49
36
3 50
7 1
6
20 48 9 15 2512 44 42 37 39 30 24 1023 47 13 22 11 421 16 40 291732 33 31 38 1918 826 35 43 34 5
46 2
28 41 1445
Figure 6.5: Visualisation of topics in a 2D map could assist the investigator in prioritizing the data to be analysed. Conventional techniques use keyword searches to identify relevant documents. The document 2D map (Figure 6.4) can then be used to identify closely related documents that would typically not be found from the keywords. This assists in finding other relevant documents and therefore expanding the set of relevant documents. Words associated with topics can be used to expand existing keyword sets. Where an existing keyword occurs within the top-n words defining a topic, the other words defining that topic can then be included in the keyword set. This expands the set of keywords based on the actual characteristics of the forensic data and not prior case knowledge.
6.5
LESSONS LEARNED
This research has shown that topic modelling can be a valuable component for digital analysis, both for the purposes of reducing the quantity of data that must be reviewed by a human analyst and for suggesting themes that are prevalent within a set of documents to be analyzed. We have designed stability index as a performance metric for topic modelling. However, one issue that deserves attention is the design of performance metrics that reflect the goals of forensic investigations. Such metrics should reflect the particular requirements of the forensic environment (e.g. S CHOOL OF E LECTRICAL , E LECTRONIC AND C OMPUTER E NGINEERING
106
C HAPTER S IX
T OPIC M ODELS A PPLIED TO D IGITAL F ORENSICS
intelligibility to a human analyst, salience of topics detected); it will serve as a crucial guide for the development of more sophisticated algorithms. In addition, several practical matters were found to be important during our investigation. These include the following: • Many documents are represented by a variety of versions within the extracted set. Treating these versions as independent documents skews the topics extracted and increases the computational complexity of the modelling problem unnecessarily; on the other hand, detecting different versions is a computational challenge (for example, one version may contain only a portion of another; hence, the percentage overlap may be low). It is also a non-trivial challenge to merge the different versions without risking the loss of relevant information. • Named entities (person names, locations and organizations) are important in digital investigations and have a high evidence potential. These need to be treated with some care. We recommend that named entities should be recognized (using an algorithm such as that described by Louis et al. (2006)) and removed from documents temporarily to exclude them from data pre-processing tasks such as stemming and removal of stop words. Once the preprocessing is complete, the named entities can be returned to the document as concepts and not as individual words. Newman et al. (2006) combined topic models and named entity recognizers to jointly analyse named entities and topics. In this way topics relate entities to one another which provides a wealth of information on people, organisations and locations mentioned in the text corpus. • In many cases, documents from several languages may be present in the same corpus. Documents from different languages should be treated separately from one another, for several reasons (investigators may be proficient in only a subset of the languages, data preprocessing tasks such as stemming and spell checking are language dependent, chunking depends on part-of-speech tagging, etc.). It is therefore advisable to separate documents using an automatic system such as that developed by Botha et al. (2006). • ‘Known files’ include help files of purchased software, license agreements, etc. These files need to be removed from the corpus before analysis, to reduce the amount of spurious data presented to the analyst. Fortunately, this can be done efficiently (e.g. through the
S CHOOL OF E LECTRICAL , E LECTRONIC AND C OMPUTER E NGINEERING
107
C HAPTER S IX
T OPIC M ODELS A PPLIED TO D IGITAL F ORENSICS
use of hash values for lists of ‘known’ documents such as ‘readme.txt’ files of known programmes). • Spelling mistakes add parameters to the model and result in incorrect word statistics - the count of one word is split into more than one spelling variant. However, it is difficult to automate spell-checking reliably in an informal context: important neologisms and jargon related to the investigation could be transcribed wrongly. It is probably preferable to have a lower precision rather than to wrongly correct spelling mistakes, but this matter deserves further investigation. • Text corpora used for topic modelling are typically homogeneous (e.g. news articles, conference proceedings or book chapters). Forensic data, on the other hand, are generally a mixture of documents, reports, letters, email bodies and faxes. It might therefore be beneficial to modify topic modelling approaches to cope with such inhomogeneous data more successfully (e.g. to avoid the bias towards longer documents that is inherent in the statistics used by current approaches).
6.6
CONCLUSIONS
In this chapter we applied topic models to evidence mining. Topic modelling contributes mainly to the data preparation task in the CRISP-EM process in the sense that it focuses the search for evidence in forensic data. This is done in two ways: A summary of inferred topics by its top-10 words gives a good overview of the natural language data. Careful interpretation by an investigator leads to prioritisation of data to be analysed. If keywords already exist, they can be searched for in topics. If a keyword ranks highly in a particular topic, the topic becomes of special interest in terms of other highly ranked words as well as documents associated with the topic. We have applied chunking strategies to the forensic corpus in order to structure input features. The objective is to improve the performance of the topic model and increase the intelligibility of the topic model output. Both these objectives have been reached: The stability index, which serves as a performance measure, is higher for all chunking strategies than for the bag-of-word approach. The intelligibility of the topic model output is increased by multi-term chunks instead of single terms in the top-10 words that describe the topic.
S CHOOL OF E LECTRICAL , E LECTRONIC AND C OMPUTER E NGINEERING
108
C HAPTER S IX
T OPIC M ODELS A PPLIED TO D IGITAL F ORENSICS
This chapter reports on one case study of topic modelling applied to forensic data very early into an ongoing investigation. Future work includes reporting on the benefits of including topic modelling as a digital analysis technique in the ongoing investigation. More studies are needed on different case types, crimes and evidence sets in order to validate the lessons learned and possibly expanding the list. Topic model algorithms can be expanded to take into account evolution of topics and the temporary component of the data (Mei and Zhai, 2005). One useful characteristic of forensic data is the abundance of metadata. Metadata could be use to add the temporal component as well as other information (e.g. author indication, machine origin, external links, etc.) to KDD techniques in order to generate more informative results.
S CHOOL OF E LECTRICAL , E LECTRONIC AND C OMPUTER E NGINEERING
109
C HAPTER S EVEN
C ONCLUSION
7.1
INTRODUCTION
As motivated in section 1.3, the research question defining this thesis is twofold: • Can the performance of topic models be improved by relaxing the bag-of-word assumption using a feature-clustering technique? • How can multiple aspects of performance of topic models be measured consistently across parameter dimension size and topic model algorithms?
7.2
SUMMARY OF CONTRIBUTION
We have defined a general evaluation framework for topic models that is robust to changes in the feature space dimension. We constructed structured features for topic models and tested the performance of a standard topic model, Latent Dirichlet Allocation (LDA), using these features rather than the existing bag-of-words approach. The detailed contributions of this thesis include the following: • Existing stability-based validation techniques were developed for hard clusters. In section 4.3 we adapt stability-based validation techniques for probabilistic clusters. 110
C HAPTER S EVEN
C ONCLUSION
• We introduce the stability index as a novel performance measure for topic models that acts more consistently across feature space dimensions than existing measures such as perplexity. • We investigate the behaviour of information-theoretic performance measures for topic models across feature space dimensions and found them to change only weakly. Despite this consistent behaviour, the interpretation of the results is difficult. • In section 4.7 we sketch an evaluation framework with a suite of performance measures for topic models and outline the appropriateness of each measure to various topic model evaluation tasks. • In chapter 5 we introduce structured features as an alternative data structure to single-word features for topic models. We apply Natural Language Processing (NLP) techniques and experiment with various part-of-speech patterns to produce structured features. We show that structured features improve the performance of topic models, both in terms of the stability of topic-document associations produced, as well as the interpretability of topics. • In chapter 6 we discuss the application of topic models to the digital forensic environment. We show that topic models have potential to enhance the analysis phase of forensic investigations by navigating the search through natural text in the evidence set that could contain valuable information to the investigation.
7.3
FURTHER APPLICATIONS AND FUTURE WORK
This thesis formulates three directions of research, namely 1) a formal evaluation framework for topic models that addresses properties beyond the predictive abilities of the model, 2) processes to structure features into more meaningful concepts and 3) the application of topic models to the field of digital forensics. Specific issues that we would like to address include: • Further investigation into the use of stability-based validation as performance measure for topic models. In this thesis we proposed the Naive Bayesian classifier and Support Vector Machines as probability density estimators to transfer clustering solutions from one data set
S CHOOL OF E LECTRICAL , E LECTRONIC AND C OMPUTER E NGINEERING
111
C HAPTER S EVEN
C ONCLUSION
to another. We would like to investigate other suitable probability density estimators for this purpose, focusing on their compatibility with the generative assumptions of topic models. • Stability-based validation assesses the model’s ability to generate similar clusters on two different data sets. However, the interpretability of topics inferred by a topic model is not measured quantitatively. Preliminary research on this is captured in Chang et al. (2009) where the semantic meanings of inferred topics are measured using human judgment. • We utilise NLP techniques to structure features in this thesis. Future work on the structuring of features includes the evaluation of such methods in other languages. Related to this is the investigation of methods that are not language dependent, thereby widening the scope of topic modelling applications to multilingual corpora. • In section 5.5.5 we presented a method to ‘score’ the significance of features and included features with a high significance in the data set. The performance of topic models will benefit by a further investigation into a detailed definition of a significance score for features. • The successful application of topic models to digital forensics is dependent on many preprocessing tasks as described in section 6.5. The distinction of named entities from other features in the data set is an interesting field of research to investigate, one that could also benefit many other application areas.
7.4
CONCLUSION
In the past 20 years latent semantic analysis has evolved into powerful instruments to analyse large text corpora. Probabilistic topic models have proven to successfully summarise text by inferring topics as well as topic-document associations. However, the typical single word description of topics becomes a handicap when trying to interpret what the topic is about. In this thesis, we developed processes to enrich the interpretability of topic models and thereby promoting its usefulness in fields such as information retrieval and data mining. Topic models with structured features show great potential in the field of digital forensics where it focus and navigate searches in evidence mining, which are currently done manually.
S CHOOL OF E LECTRICAL , E LECTRONIC AND C OMPUTER E NGINEERING
112
R EFERENCES
Beal, M.J. (2003). Variational Algorithms for Approximate Bayesian Inference. Ph.D. thesis, Gatsby Computational Neuroscience Unit, University College London. Beebe, N. and Clark, J. (2007). Digital Forensic Text String Searching: Improving Information Retrieval Effectiveness by Thematically Clustering Search Results. Digital Investigation, vol. 4, no. 1, pp. 49–54. Bird, S., Klein, E. and Loper, E. (2009). Natural Language Processing with Python. O’Reilly Media. Blei, D.M. (2004). Probabilistic Models of Text and Images. Ph.D. thesis, U.C. Berkeley, Division of Computer Science. Blei, D.M. (2009).
Decide no of Topics.
https://lists.cs.princeton.edu/pipermail/topic-
models/2009-September/000613.html. Blei, D.M. and Jordan, M.I. (2004). Variational Methods for the Dirichlet Process. In: Proceedings of the 21st International Conference on Machine Learning. Blei, D.M. and Lafferty, J.D. (2006a). Correlated Topic Models. In Advances in Neural Information Processing Systems 18. Blei, D.M. and Lafferty, J.D. (2006b). Dynamic Topic Models. In: ICML ’06: Proceedings of the 23rd International Conference on Machine learning, pp. 113–120. ACM, New York, NY, USA. ISBN 1-59593-383-2. Blei, D.M. and Lafferty, J.D. (2009). Visualizing Topics with Multi-Word Expressions. 0907.
113
REFERENCES
1013. Available at: http://arxiv.org/abs/0907.1013 Blei, D.M., Ng, A.Y. and Jordan, M.I. (2003). Latent Dirichlet Allocation. Journal of Machine Learning Research, vol. 3, pp. 993–1022. ISSN 1533-7928. Botha, G., Zimu, V. and Barnard, E. (2006). Text-based Language Identification for the South African Languages. In: Proceedings of the 17th Annual Symposium of Pattern Recognition Association of South Africa. Breckenridge, J. (1989). Replicating Cluster Analysis: Method, Consistency and Validity. Multivariate Behavioural Research, vol. 24, pp. 147–161. Buntine, W. (2002). Variational Extensions to EM and Multinomial PCA. In ECML 2002. Buntine, W. and Jakulin, A. (2005). Discrete Principle Component Analysis. Tech. Rep., Helsinki Institute for Information Technology. Canny, J. (2004). GaP: A Factor Model for Discrete Data. In: International ACM SIGIR Conference on Research and Development in Information Retrieval, pp. 122–129. Chang, J., Boyd-Graber, J., Wang, C., Gerrish, S. and Blei, D.M. (2009). Reading Tea Leaves: How Humans Interpret Topic Models. In: Neural Information Processing Systems. Chapman, P., Clinton, J., Kerber, R., Khabaza, T., Reinartz, T., Shearer, C. and Wirth, R. (2000). CRISP-DM 1.0 step-by-step data mining guide. Tech. Rep., The CRISP-DM Consortium. Chisum, W.J. and Turvey, B.E. (2007). Crime Reconstruction. Elsevier. Dasarathy, B.V. (1990). Nearest neighbor (NN) norms: NN Pattern Classification Techniques. Los Alamitos: IEEE Computer Society Press, 1990. De Waal, A. and Barnard, E. (2007). Topic Models applied to Multilingual Data. In: Proceedings of the 18h Annual Symposium of the Pattern Recognition Association of South Africa (PRASA), pp. 99–103. De Waal, A. and Barnard, E. (2008). Evaluating Topic Models with Stability. In: Proceedings of the 19h Annual Symposium of the Pattern Recognition Association of South Africa (PRASA), pp. 99–103. S CHOOL OF E LECTRICAL , E LECTRONIC AND C OMPUTER E NGINEERING
114
REFERENCES
De Waal, A., Venter, J. and Barnard, E. (2008). Applying Topic Modelling on Forensic Data: A Case Study. In: Shenoi, S. (ed.), Advances in Digital Forensics IV, vol. 242 of International Federation for Information Processing, pp. 303–315. Springer Boston. Dhillon, I.S., Mallela, S. and Kumar., R. (2003). A Divisive Information-theoretic feature Clustering Algorithm for Text Classification. Journal of Machine Learning Research(JMLR): Special Issue on Variable and Feature Selection, vol. 3, pp. 1265–1287. Dumais, S.T. (1998). Using SVMs for Text Categorization. IEEE Intelligent Systems Magazine, Trends and Controversies, vol. 13, no. 4, pp. 21–23. Frank, A. (2004). On Kuhn’s Hungarian Method - A Tribute from Hungary. Tech. Rep. TR-200414, Egervry Research Group, Budapest. Gaussier, E. and Goutte, C. (2005). Relation between PLSA and NMF and Implications. In: SIGIR ’05: Proceedings of the 28th Annual International ACM SIGIR Conference on Research and Development in Information Retrieval, pp. 601–602. ACM, New York, NY, USA. ISBN 1-59593-034-5. Gelman, A., Carlin, J.B., Stern, H.S. and Rubin, D.B. (2003). Bayesian Data Analysis, Second Edition. Chapman & Hall/CRC. Griffiths, T. and Steyvers, M. (2004). Finding Scientific Topics. Proceedings of the National Academy of Sciences, vol. 101, no. suppl. 1, pp. 5228–5235. Griffiths, T. and Steyvers, M. (2007). Probabilistic Topic Models. Handbook of Latent Semantic Analysis, pp. 427–448. Griffiths, T., Steyvers, M. and Tenenbaum, J. (2007). Topics in Semantic Representation. Psychological Review, vol. 114, no. 2, pp. 211–244. Gunn, S.R. (1998). Support Vector Machines for Classification and Regression. University of Southhampton, Technical Report. Harman, D. (1992). Overview of the first text retrieval conference (TREC-1). In: Proceedings of the First Text Retrieval Conference (TREC-1), pp. 1–20.
S CHOOL OF E LECTRICAL , E LECTRONIC AND C OMPUTER E NGINEERING
115
REFERENCES
Heinrich, G. (2008). Parameter Estimation for Text Analysis. Technical Note. Heinrich, G., Kindermann, J., Lauth, C., Paass, G. and Sanchez-Monzon, J. (2005). Investigating Word Correlation at Different Scopes - A Latent Concept Approach. In: Workshop Lexical Ontology Learning at Int. Conf. Machine Learning. Hofmann, T. (1999). Probabilistic Latent Semantic Indexing. In: SIGIR ’99: Proceedings of the 22nd Annual International ACM SIGIR Conference on Research and Development in Information Retrieval, pp. 50–57. ACM Press. Jordan, M.I. (2004). Graphical models. Statistical Science (Special Issue on Bayesian Statistics), vol. 19, pp. 140–155. Jurafsky, D. and Martin, J.H. (2000). Speech and language processing, Second Edition. Prentice Hall. Kuhn, H.W. (1955). The Hungarian method for the assignment problem. Naval Research Logistic Quarterly, vol. 2, pp. 83–97. Landauer, T.K. and Dumais, S.T. (1997). A Solution to Plato’s problem: The Latent Semantic Analysis Theory of the Acquisition, Induction, and Representation of Knowledge. Psychological Review, vol. 104, no. 2, pp. 211–240. Landauer, T.K., Foltz, P.W. and Laham, D. (1998). An Introduction to Latent Semantic Analysis. Discourse Processes, vol. 25, pp. 259–284. Landauer, T.K., McNamara, D.S., Dennis, S. and Kintsch, W. (eds.) (2007). Handbook of Latent Semantic Analysis. Lawrence Erlbaum Assoiciates, New Jersey. Lange, T., Roth, V., Braun, M.L. and Buhmann, J.M. (2004). Stability-based Validation of Clustering Solutions. Neural Comput., vol. 16, no. 6, pp. 1299–1323. Lee, D.D. and Seung, H.S. (2000). Algorithms for Non-negative Matrix Factorization. NIPS 13: Proceedings of the 2000 Conference, pp. 556–562. Lewis, D.D. (1998). Naive (Bayes) at Forty: The Independence Assumption in Information Retrieval. In: N´edellec, C. and Rouveirol, C. (eds.), Proceedings of ECML-98, 10th European Conference on Machine Learning, pp. 4–15. Springer Verlag, Heidelberg, DE. S CHOOL OF E LECTRICAL , E LECTRONIC AND C OMPUTER E NGINEERING
116
REFERENCES
Li, W. and McCallum, A. (2006). Pachinko Allocation: DAG-structured Mixture Models of Topic Correlcations. International Conference on Machine Learning (ICML). Louis, A., De Waal, A. and Venter, J. (2006). Named Entity Recognition in a South African Context. In: SAICSIT ’06: Proceedings of the 2006 Annual Research Conference of the South African Institute of Computer Scientists and Information Technologists on IT Research in Developing Countries, pp. 170–179. South African Institute for Computer Scientists and Information Technologists. Mackay, D.J.C. (2002). Information Theory, Inference & Learning Algorithms. Cambridge University Press. MacQueen, J.B. (1967). Some Methods for Classification and Analysis of Multivariate Observations. In: Proceedings of 5-th Berkeley Symposium on Mathematical Statistics and Probability, pp. 281–297. University of California Press, Berkeley. Marcus, M.P., Santorini, B. and Marcinkiewicz, M.A. (1993 June). Building a Large Annotated Corpus of English: The Penn Treebank. Computational Linguistics (Special Issue on Using Large Corpora), vol. 19, no. 2, pp. 313–330. Marlin, B. and Zemel, R.S. (2004). The Multiple Multiplicative Factor Model for Collaborative Filtering. In: ICML ’04: Proceedings of the Twenty-first International Conference on Machine learning, p. 73. ACM, New York, NY, USA. ISBN 1-58113-828-5. McCallum, A. and Nigam, K. (1998). A Comparison of Event Models for Naive Bayes Text Classification. In: AAAI-98 Workshop on Learning for Text Categorization. McCue, C. (2007). Data Mining and Predictive Analysis: Intelligence Gathering and Crime Analysis. Butterworth-Heinemann, Newton, MA, USA. ISBN 0750677961. Mei, Q. and Zhai, C. (2005). Discovering Evolutionary Theme Patterns from Text: An Exploration of Temporal Text Mining. In: Proc. of KDD’05, pp. 198–207. Meila, M. (2002). Comparing Clusterings. Tech. Rep. 418, Department of Statistics, University of Washington.
S CHOOL OF E LECTRICAL , E LECTRONIC AND C OMPUTER E NGINEERING
117
REFERENCES
Minka, T. and Lafferty, J. (2002). Expectation-propagation for the Generative Aspect Model. In: UAI-2002. Nallapati, R.M., D, S., Lafferty, J.D. and Ung, K. (2007). Multiscale Topic Tomography. In: KDD ’07: Proceedings of the 13th ACM SIGKDD International Conference on Knowledge Discovery and Data Mining, pp. 520–529. ACM, New York, NY, USA. ISBN 978-1-59593-609-7. Newman, D., Chemudugunta, C., Smyth, P. and Steyvers, M. (2006). Analysing Entities and Topics in News Articles Using Statistical Topic Models. In: LNCS-IEEE Conference on Intelligence and Security Informatics, pp. 93–104. San Diego, USA. Pollitt, M. and Whitledge, A. (2006). Exploring Big Haystacks Data Mining and Knowledge Management. International Federation for Information Processing, Advances in Digital Forensics II, vol. 222, pp. 67–76. Pritchard, J.K., Stephens, M. and Donnelly, P. (2000 June). Inference of Population Structure Using Multilocus Genotype Data. Genetics, vol. 155, no. 2, pp. 945–959. Rigouste, L., Capp´e, O. and Yvon, F. (2007). Inference and Evaluation of the Multinomial Mixture Model for Text Clustering. Inf. Process. Manage., vol. 43, no. 5, pp. 1260–1280. ISSN 03064573. Rosenbaum, P.R. (1989). Optimal Matching for Observational studies. Journal of the American Statistical Association, vol. 84, no. 408, pp. 1024–1032. Russell, S.J. and Norvig, P. (2003). Artificial Intelligence: A Modern Approach (Second Edition). Prentice Hall. Salton, G. (1999). SMART Version 11.0 Stop word list. ftp://ftp.cs.cornell.edu/ pub/smart/english.stop. Salton, G. and McGill, M.J. (1983). Introduction to Modern Information Retrieval. McGraw-Hill. Slonim, N. and Tishby, N. (2000). Document Clustering using Word Clusters via the Information Bottleneck Method. In: SIGIR ’00: Proceedings of the 23rd Annual International ACM SIGIR Conference on Research and Development in Information Retrieval, pp. 208–215. ACM, New York, NY, USA. ISBN 1-58113-226-3. S CHOOL OF E LECTRICAL , E LECTRONIC AND C OMPUTER E NGINEERING
118
REFERENCES
Smola, A.J. and Sch¨olkopf, B. (1998). A Tutorial on Support Vector Regression. NeuroCOLT2 Technical Report Series. Teh, Y., Jordan, M., Beal, M. and Blei, D. (2006). Hierarchical Dirichlet Processes. Journal of the American Statistical Association, vol. 101, no. 476, pp. 1566–1581. Tishby, N., Pereira, F. and Bialek, W. (1999). The Information Bottleneck Method. In: Proceedings of the 37-th Annual Allerton Conference on Communication, Control and Computing, pp. 368–377. Venter, J., De Waal, A. and Willers, N. (2007). Specialising CRISP-DM for Evidence Mining. In: Shenoi, S. (ed.), Advances in Digital Forensics III, vol. 242 of International Federation for Information Processing, pp. 303–315. Springer Boston. Wallach, H.M. (2006). Topic Modelling: Beyond Bag-of-Words. In: Proceedings of the 23rd International Conference on Machine Learning. Wang, X. and McCallum (2006). Topics Over Time: A Non-Markov Continuous-time Model of Topical Trends. In: Eliassi-Rad, T., Ungar, L.H., Craven, M. and Gunopulos, D. (eds.), KDD, pp. 424–433. ACM. Wang, X., McCallum, A. and Wei, X. (2007). Topical N-Grams: Phrase and Topic Discovery, with an Application to Information Retrieval. In: ICDM ’07: Proceedings of the 2007 Seventh IEEE International Conference on Data Mining, pp. 697–702. IEEE Computer Society, Washington, DC, USA. Webb, A. (2002). Statistical Pattern Recognition. John Wiley and Sons, Ltd.
S CHOOL OF E LECTRICAL , E LECTRONIC AND C OMPUTER E NGINEERING
119