to the graph cut framework that incorporates a âblobâ-like shape prior. ... eterized via structured learning. Extensive ... in [14] allows us to envision the automated extraction of full lineage for ... a robust nuclei segmentation method that exploits this pri- or. ... method is based, many shape priors have been explored. Similar to ...
Learning to Segment Dense Cell Nuclei with Shape Prior Xinghua Lou1 , Ullrich Koethe1 , Jochen Wittbrodt2 , Fred A. Hamprecht1 1 HCI, IWR, University of Heidelberg, 69115, Germany 2 Department of Developmental Biology, University of Heidelberg, 69115, Germany http://hci.iwr.uni-heidelberg.de/
Abstract We study the problem of segmenting multiple cell nuclei from GFP or Hoechst stained microscope images with a shape prior. This problem is encountered ubiquitously in cell biology and developmental biology. Our work is motivated by the observation that segmentations with loose boundary or shrinking bias not only jeopardize feature extraction for downstream tasks (e.g. cell tracking), but also prevent robust statistical analysis (e.g. modeling of fluorescence distribution). We therefore propose a novel extension to the graph cut framework that incorporates a “blob”-like shape prior. The corresponding energy terms are parameterized via structured learning. Extensive evaluation and comparison on 2D/3D datasets show substantial quantitative improvement over other state-of-the-art methods. For example, our method achieves an 8.2% Rand index increase and a 4.3 Hausdorff distance decrease over the second best method on a public hand-labeled 2D benchmark.
A
B
C
D
E
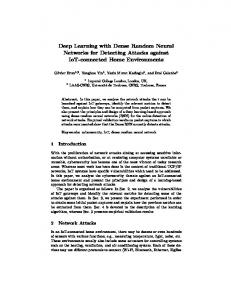
Figure 1. Challenging cell nuclei images. A, B - dense populations; C - poor quality; D, E - staining/imaging artifacts.
ducing loose boundary and over-segmentation. It usually demands ad hoc post-processing such as merging [18]. Contour evolution [8, 29, 23] can well approximate the true boundary but is subject to high computational cost and other issues like under-segmentation and numerical instability. Adaptive intensity thresholding [14] rarely considers spatial context and is sensitive to texture and noise. Failing to reveal the true extent of nuclei, it usually amounts to detection rather than segmentation. Gradient flow tracking [17] relies on a gradient diffusion procedure that may further weaken vague boundaries, which easily leads to undersegmentation. Graph cut with α-expansion [1] is computationally expensive due to the excessive use of labels and it loses the important global optimality of graph cut [16, 4].
1. Introduction The rapid progress of microscopic techniques creates compelling challenges for biomedical image analysis. This is particularly true for many in vivo imaging experiments in cell or developmental biology. For example, the work in [14] allows us to envision the automated extraction of full lineage for advanced animals such as zebrafish. Such digital embryo databases have a far reaching impact on the field of developmental biology. But, even today, processing such datasets remains a challenging problem in dense populations, in the presence of staining/imaging artifacts, or when the image quality is poor (Fig. 1). In such experiments, the cell nuclei are usually stained using GFP or Hoechst and accurately segmenting all of them is crucial for any downstream tasks such as feature extraction for cell tracking. Existing cell nuclei segmentation methods can be broadly categorized by their underlying image processing technique. The popular watershed algorithm is computationally efficient but is prone to pro-
Our work was inspired by studies on nuclear structure which show that healthy nuclei usually exhibit ellipsoid, “blob”-like shapes [30]. We therefore aim at developing a robust nuclei segmentation method that exploits this prior. In the context of graph cut segmentation on which our method is based, many shape priors have been explored. Similar to shape priors for level set, authors in [11, 28] propose to incorporate shape information by penalizing deviations from a pre-defined mask. This method can handle very complicated shapes but usually requires alignment or registration to address geometric transformations. Another direction of work is to efficiently incorporate simple shape 1
priors such as convex [27], compact [7] or ”blob”-like [12], and such priors are particularly useful for biomedical applications. Usually, these shape priors work for a single object. The contributions of this work include: • a novel extension to graph cut that encodes a shape prior for all nuclei simultaneously; • a supervised learning strategy to parameterize the corresponding energy terms; • an extensive evaluation and comparison to state-of-theart methods on real world 2D/3D datasets with qualitative and quantitative performance statistics. It is worth pointing out that not all nuclei match our prior and some irregularity exists [30]. Note that the proposed method is biased by the prior, but does not enforce it, when the evidence to the contrary is unequivocal.
2. Shape Prior for Nuclei Segmentation Given an image x, we model the segmentation problem using a Markov Random Field (with nodes I and edges N ) and use graph cut [4] to infer the best labeling l ∈ {0, 1}|I| that minimizes the proposed energy
E(x, l; w)
=
wdata
X
Edata (lp ) +
p∈I
X
wsmooth
Esmooth (lp , lq ) +
{p,q}∈N
wflux
X
Eflux (lp ) +
p∈I
wshape
X
Eshape (lp , lq ).
(1)
{p,q}∈N
The first term encourages labels that are compatible with local appearance, while the second term favors smooth labelings. The third term is the flux maximizing term that counteracts the well-known shrinking bias [15] induced by the second contribution; and the last term, finally, encodes our shape prior. Note that, unlike some early extensions to graph cut [15, 12], the flux term and the shape term have to affect all nuclei simultaneously in our problem. The parameters w = {wdata , wsmooth , wflux , wshape } associated with each energy term weight the respective contribution. The first, third and fourth term depend on the image in a local (Edata ) and a non-local (Eflux , Eshape ) fashion. Even so, we drop the index x to make for an uncluttered notation. We now set out to elaborate on each term, commencing with the important shape term.
A
p v q
q B
p v
C
v p q
Figure 2. “Blob”-like shape prior by aligning cuts and some vector field. A - preferred segmentation, well aligned; B - “crescent”shaped, orthogonal; C - a hole inside, opposite.
2.1. Alignment of Cuts and Vector Field The graph cut framework models segmentation as a graph partition problem. It attempts to find the cheapest set of cuts on the edges, which separates the graph into two disjoint sets, i.e. foreground and background (see [4] for more details). Now, consider the example in Fig. 2A. It shows a preferred segmentation that matches our shape prior (green boundary) and some vector field v originating from the center (yellow arrows). We see that the boundary of the preferred segmentation is largely perpendicular to v, which is equivalent to the cuts being mostly aligned with v (e.g. red arrow, pixel p → q). On the contrary, for unfavorable segmentations such as “crescent”-shaped or donuts/perforated nuclei, the cuts can be orthogonal or even opposite to the vector field, as respectively shown in Fig. 2B and Fig. 2C. Given the intuition above, we formulate our shape prior term as Eshape (lp , lq ) = e−hvp ,up→q i ·δ (hvp , up→q i ≤ 0)·δ (lp 6= lq ) , (2) where vp is the unit vector of v at pixel p, up→q is a unit vector pointing from pixel p to pixel q, and δ (c) is an indicator function that returns 1 when the condition c is satisfied and 0 otherwise. The first term in Eq. 2 penalizes the divergence of the two vectors, the second one truncates the penalty and avoids over-penalization, and the last term ensures that this penalty is only counted on cuts.
2.2. Shape Prior Extension for Multiple Nuclei
Figure 3. Different vector fields as shape prior. A - raw intensity gradient; B - gradient of seeded Euclidean distance transform; C gradient of seeded function distance transform.
Now we show how this prior is extended to affect multiple nuclei simultaneously. This problem boils down to find-
ing an appropriate vector field that originates from the inside of each nucleus and points towards its boundary. Apparently, raw intensity gradient fails to suffice (Fig. 3A). We therefore include a nuclei detection procedure to roughly locate the nuclei first. We use a method similar to [21] but more efficient. It is based on the same intuition: noisy local maxima are not stable across scales. Instead of combining wavelet coefficients across scales [21], we combine (logically, by ∧) the response, also across multiple scales, of an indicator function I(ηpσ ≺ 0). Here, ηpσ consists of all pixel p’s Hessian eigenvalues computed after the image is smoothed at scale σ. Each resulting connected component is referred to as a “seed” (e.g. Fig. 3C, red regions). The seeds are usually located well within the nuclei despite a strong shrinking bias and irregularity in shape. To generate a vector field that suffices, we pursue two goals: high efficiency and low interference. For example of Fig. 3B, the overextension of vectors from the small nucleus will cause a shrinking bias to the large one. Such vector field is generated by simply computing an Euclidean distance map from the seed centers and taking its gradient. Noticing that the seeds roughly describe the size of nuclei, we propose to manipulate the extent of vectors from each seed by its size. This is realized by using function distance map, as o n p (3) dp = min (xp − cq )2 − size(q) ,
However, it is difficult to demand perfect pixel prediction from the classifier. The accuracy is bounded by the performance of the classifier, the discriminative power of the features and the representativeness of the training samples. For example, staining artifact inside nuclei may confuse the classifier and eventually cause holes inside the segmentation (see Fig. 4 for an example). Our shape prior can prevent such errors and yield hole-free segmentations.
2.4. Details on Other Energy Terms Graph cut is known to favor shorter segmentation boundaries, i.e. it exposes shrinking bias [15]. This is further exacerbated after the introduction of the shape penalty. We therefore add the flux term as a counterpoise. Based on the same vector field that is used by the shape term, Eflux (lp ) attempts to push the boundary outwards for each nucleus, by maximizing the flux going through it. In practice, the P flux passing through pixel p is approximated by wp = q∈Np hvp , up→q i, where Np is the set of p’s neighbors, vp is the same vector field used by the shape term, and up→q is the same as in Eq. 2. Then, the flux term is computed by (see [15] for more details) −wp if wp ≤ 0 and lp = 1 wp if wp > 0 and lp = 0 (5) Eflux (lp ) = 0 otherwise
q
where q indexes the seeds, xp and cq denote the spatial coordinate of pixel p and seed center, respectively, and size(q) is the size of seed q. This is equivalent p to pulling down the parabola (xp − cq )2 rooted at cq by size(q), such that the borders of the resulting Voronoi diagram are shifted towards smaller seeds. Eq. 3 can be efficiently computed using [9] with a complexity linear in image size, just like computing the Euclidean distance map. The resulting vector field is clean for each individual nucleus (Fig. 3C).
2.3. Data Fidelity Prediction by Random Forest The shape term alone is certainly insufficient for good performance. Another key term is the data term Edata (lp ). To capture the variability in brightness and texture, we extract local features F and train a random forest (RF) [5] on them to compute a probability map Prob(l|F ) as the data fidelity (see [2] for more details on the features). To spare the labeling effort, we directly take the seeds as the foreground labels. We run a seeded watershed using the same seeds and take the resulting watersheds as background labels. Note that since RF accumulates votes through decision trees trained on bags of samples, imperfect labeling does not hurt the probability map much. A similar “automatic” label generation technique appeared in [19]. In summary, Edata (lp ) = 1 − Prob(lp |F p ).
(4)
Finally, we use the discontinuity penalty [4] that penalizes small intensity difference (||xp − xq ||2 ) on the cuts, as Esmooth (lp , lq ) = e−
||xp −xq ||2 2σ 2
·
1 · δ (lp 6= lq ) . dist(p, q) (6)
3. MRF Parametrization by Learning Determining the optimal weights in Eq. 1 is nontrivial since the terms can be incommensurable and their relative magnitudes may change from one dataset to another. Early work applies heuristics [27] or resorts to manual tweaking [13]. We solve this MRF parametrization problem via a more fundamental learning strategy.
3.1. Learning Formulation by Risk Minimization The recent advances in structured learning [26] allows for efficient parameter estimation for complicated graphical models and, in particular, for MRFs and conditional random fields (CRFs) [24]. Formally, given N training images X = {xn } and ground truth binary labels L∗ = {ln∗ }, the best set of parameters is the optimizer of min
w≥0
1 X λ R(w; xn , ln∗ ) + kwk2 . N n 2
(7)
Here, the empirical loss R(w; x, l∗ ) = max ∆(l, l∗ ) − l∈L
1 1 E(x, l∗ ; w) + ∗ E(x, l; w), (8) |l∗ | |l |
where Ln is the structured space of all possible labels for image n. ∆(l, ln∗ ) is a loss function that can be, for example, normalized Hamming loss (i.e. the percentage of diverging labels):
dual form. Pseudocode of bundle method and adaption of its dual formulation to incorporate non-negativity constraint on w are provided in the supplementary. Searching for the most violated constraints requires solving an “augmented” graph cut problem as shown in Eq. 8. To see this, we drop the independent middle term and remove the common factor |l1∗ | . We obtain max
∆(l, l∗ ) =
� 1 X� lp (1 − lp∗ ) + lp∗ (1 − lp ) . ∗ |l | p
l∈L
(9)
1 The normalization factor |l| in Eq. 8 ensures numerical stability because the sum of individual energy terms in E(x, l; w) can be very huge, which may trouble the subsequent subgradient computation for optimization (see Section 3.3 for more details).
3.2. Max-Margin Structured Learning Formulation The objective function in Eq. 7 can be reformulated using the max-margin structured learning formulation [26]: P min N1 n ξn + λ2 kwk2 w,ξ
s. t. ∀n, ∀l ∈ Ln : 1 ∗ ∗ |l∗ | [E(xn , ln ; w) − E(xn , l; w)] ≥ ∆(ln , l) − ξn , w ≥ 0, ξ ≥ 0. (10) Here, ∆(ln∗ , l) is known as “margin-rescaling” [26]. Intuitively, it pushes the decision boundary further away from the “bad” solutions with high losses. Note that we have a non-negativity constraint on w. This is suggested by [24] such that the graph cut energy formulation remains submodular [16]. Otherwise, one has to resort to structured learning with approximation inference [10] on non-submodular energies (e.g. QPBO [22]).
3.3. Optimization with Bundle Method We developed our optimizer for the above max-margin problem based on bundle method [25]. Bundle method is an enhancement over the popular cutting plane method that provides better convergence rate: given precision �, it converges with speed 1� rather than �12 of usual cutting planes. Briefly, bundle method starts with some parametrization w and no constraints. Iteratively find, first, the optimum labeling n using the current w by solving, for all n, l = o 1 ∗ arg maxl |l∗ | E(x, l; w) + ∆(l , l) . Use all the l to identify the most violated constraint, and add it to Eq. 10. Update w by solving Eq. 10 (with added constraints), then find new best labeling, etc. pp. From the perspective of functional approximation, those constraints form a lower bound linear approximation of the original objective and the approximated version of Eq. 10 can be efficiently solved in its
X
X (1−lp∗ )·δ(lp = 1)+ lp∗ ·δ(lp 6= 1)+E(xn , l; w),
p∈I
p∈I
(11) which suggests the following graph construction procedure: (i) set the default t-link and n-link energies from the original graph cut problem (Eq. 1); (ii) for each node p, append value 1 − lp∗ to its source t-link and append lp∗ to its sink t-link.
3.4. Implementation Details Our energy function is submodular since both pairwise terms are binary Potts models and their weighting parameters are constrained to be non-negative. Global optimality is guaranteed by graph cut [4]. We implemented our method in C++ using VIGRA1 for image representation, watershed and random forest classification. For graph cut, we used the max-flow/min-cut code2 . We implemented the bundle method adapted to our problem using LIBQP3 for QP solving. The segmentation software will be available to the public at: https://github.com/xlou.
4. Results We conducted an extensive evaluation on both 2D and 3D images acquired from different fluorescence microscopes. The methods in comparison include level-set (LS) with Chan-Vese model4 (base model for [8]), gradient flow tracking5 (GFT) [17], graph cut with α-expansion6 (GC-α) [1], the classic graph cut (GC) without shape prior [4], and the watershed based merging algorithm (MA) [18]. We trained our model on the 2D benchmark using the annotations therein [6]. We observe that the normalized Hamming loss becomes less informative when training the model on the entire image since it is usually close to one. We therefore train the model on randomly selected image patches (200 out of 1549) with a much smaller size, especially on those where cell nuclei clutter (usually contains less than 4 proximate nuclei). The bundle method usually takes around 15 iterations before convergence. We did not train the model on the 3D dataset due to lack of 3D ground truth. 1 http://hci.iwr.uni-heidelberg.de/vigra/ 2 http://vision.csd.uwo.ca/code/ 3 http://cmp.felk.cvut.cz/
xfrancv/libqp/html/ code by Yan Zhang (University of Central Lancashire) 5 http://www.biomedcentral.com/1471-2121/8/40 6 http://www.farsight-toolkit.org 4 Matlab
Other important parameters are the scales used in nuclei detection (i.e. the Gaussian kernel width σ). They are computed as in [3]: σ = 1.2 × D/9, where D is sampled evenly from the range of nuclei’s diameter (in pixel). The parameters for the remaining methods are tuned via grid search.
4.1. 2D Segmentation: Hand-Labeled Benchmark For the 2D nuclei segmentation benchmark from [6], we use the same measures for qualitative evaluation, such as merge, split, spurious and missing, and those for quantitative evaluation like Rand index (RI) and Hausdorff distance. The result in Table 1 shows our superior performance in most categories. In particular, due to shape prior and shrinking bias reduction, our method provides significant quantitative improvement (+8.2% RI and -4.3 Haus. over the second best). The high sensitivity yields a low number of missing detections but also brings many spurious detections. Many of them are small debris that can be easily filtered out by size thresholding. Note that those spurious detections are not excluded from the statistics in Table 1.
LS GFT GC-α GC Ours MA
RI 82.6% 80.8% 83.3% 80.4% 91.5% 83.0%
Haus. 14.6 20.4 15.2 27.7 10.3 15.9
Spl. 1.8 2.7 4.0 3.1 2.4 1.6
Mer. 3.9 4.0 4.7 2.9 1.6 3.0
Spu. 3.9 11.1 5.7 19.8 13.8 6.8
Mis. 2.9 1.1 1.7 0.8 0.0 5.9
Table 1. Statistics on segmenting NIH3T3 cell nuclei of [6]. The results for MA are directly from [6].
Fig. 4 shows the results on the “difficult” image (U2OS) suggested in [6]. With respect to the ground truth (Fig. 4A), level-set segments sparse nuclei perfectly but has severely under-segmentation in dense regions (Fig. 4B). The same applies to gradient flow tracking (Fig. 4C). Graph cut with α-expansion exploits no prior and is subject to many wrong expansions of labels that lead to irregularly shaped objects (Fig. 4D). The classic graph cut (Fig. 4E) uses a RF pixel classifier trained on another image. It seems that the manual trained pixel classifier does not generalize well to more difficult images, yielding obvious shrinking, missed detection and perforated nuclei. On the contrary, the RF classifier trained with automatic label generation seems useful when combined with the shape and flux (Fig. 4F).
4.2. 3D Segmentation: Digital Zebrafish Embryo The digital embryo dataset was acquired using digital laser light sheet fluorescence microscopy (DSLM) [14]. It records the location and movement of stained cell nuclei in an entire zebrafish embryo over the first 24 hours of development. Segmenting each and every nucleus for the ultimate goal of lineage-tree reconstruction [14, 20] has a far
reaching impact on the field of developmental biology. The challenges in this dataset include strong staining/imaging artifacts at early stage (Fig. 5A) and severe nuclei clutter at late stage (Fig. 5D). Maximum intensity projections of two representative volumes are shown in Fig. 5B and Fig. 5E, respectively. The respective segmentations by our method are rendered in Fig. 5C and Fig. 5F. In summary, we obtained an F-score from 96.8% to 98.8% for the first 100 time steps. The original local adaptive thresholding segmentation used in [14] yields an F-score between 92.3% and 97.6%. For detailed comparison, Fig. 6 shows two subvolumes from each volume in Fig. 5 (yellow box). The first row shows a representative sparse subvolume with “stripe”-like artifacts and the second row is on another one with very high density. GC-α [1] exhibits apparent “blocky” artifacts due to the metrication error (Fig. 6B). Generally, it appears to fail in this dense subvolume where a huge number of labels have to be propagated by expansion move (Fig. 6F). Results could only be obtained partially for the 200×200×100 subvolume, due to excessive memory consumption (2GB). Gradient flow tracking [17] is sensitive to those stripe artifacts (see Fig. 5A and Fig. 6C) and is prone to obvious undersegmentation (Fig. 6G). Despite the artifacts and high density, our method manages to produce clean segmentations with regularly shaped nuclei (Fig. 6D, H).
5. Conclusions & Future Work We present a novel nuclei segmentation method which extends the classic graph cut framework with a manifestly useful multi-object shape prior. Extensive evaluation on 2D and 3D images from different modalities shows our superior performance over several state-of-the-art methods. A structured learning-based strategy allows to parameterize the MRF energy terms from user annotated segmentations, rather than by tweaking unintuitive parameters. Our method could be further sped up and scaled up by dual decomposition and parallel computing. This is particularly meaningful in view of the ongoing trend of ubiquitous application of 3D imaging in biomedical research.
References [1] Y. Al-Kofahi, W. Lassoued, W. Lee, et al. Improved Automatic Detection and Segmentation of Cell Nuclei in Histopathology Images. IEEE Transactions on Biomedical Engineering, 57(4):841 –852, 2010. [2] Bj¨orn Andres, Ullrich K¨othe, Moritz Helmstaedter, et al. Segmentation of sbfsem volume data of neural tissue by hierarchical classification. In Pattern Recognition, volume 5096, pages 142–152, 2008. [3] H. Bay, T. Tuytelaars, and L. Van Gool. Surf: Speeded up robust features. In European Conference on Computer Vision (ECCV), 2006.
A
B
C
D
E
F
Figure 4. Comparison on the “difficult” example given in [6]. A - hand labeled ground truth; B - level set w/ Chan-Vese model; C - gradient field tracking; D - graph cut w/ α-expansion; E - classic graph cut w/ supervised pixel classifier; F - ours w/ shape prior.
A
B
C
D
E
F
Figure 5. Sample volumes of the 3D digital embryo dataset. A, D - slice view; B, E - maximum intensity projection; C, F - volume rendering of segmentations. The yellow box indicates the subvolume used for detailed comparison, see Fig. 6.
[4] Y. Boykov, O. Veksler, and R. Zabih. Fast approximate energy minimization via graph cuts. IEEE Transactions on Pattern Analysis and Machine Intelligence, 23(11):1222–1239, 2001. [5] L. Breiman. Random Forests. Machine Learning, 45(1), 2001. [6] L. P. Coelho, A. Shariff, and R. F. Murphy. Nuclear segmentation in microscope cell images: a hand-segmented dataset and comparison of algorithms. In IEEE International Symposium on Biomedical Imaging: From Nano to Macro (ISBI),
2009. [7] P. Das, O. Veksler, V. Zavadsky, et al. Semiautomatic segmentation with compact shape prior. Image and Vision Computing, 27(1-2):206–219, 2009. [8] A. Dufour, V. Shinin, S. Tajbakhsh, et al. Segmenting and Tracking Fluorescent Cells in Dynamic 3-D Microscopy With Coupled Active Surfaces. IEEE Transactions on Image Processing, 14(9):1396–1410, 2005. [9] P. F. Felzenszwalb and D. P. Huttenlocher. Distance Transforms of Sampled Functions. Technical report, Cornell Uni-
A
B
C
D
E
F
G
H
Figure 6. Comparison on two 3D subvolumes. A, E - maximum intensity projection; B, F - graph cut w/ α-expansion; C, G - gradient flow tracking; D, H - ours w/ shape prior.
versity, 2004. [10] T. Finley and T. Joachims. Training structural SVMs when exact inference is intractable. In International Conference on Machine Learning (ICML), 2008. [11] D. Freedman and T. Zhang. Interactive graph cut based segmentation with shape priors. In IEEE Conference on Computer Vision and Pattern Recognition (CVPR), 2005. [12] G. Funka-Lea, Y. Boykov, C. Florin, et al. Automatic heart isolation for CT coronary visualization using graph-cuts. In IEEE International Symposium on Biomedical Imaging: From Nano to Macro (ISBI), 2006. [13] V. Kaynig, T. Fuchs, and J. M. Buhmann. Neuron Geometry Extraction by Perceptual Grouping in ssTEM Images. In IEEE Conference on Computer Vision and Pattern Recognition (CVPR), 2010. [14] P. J. Keller, A. D. Schmidt, J. Wittbrodt, et al. Reconstruction of zebrafish early embryonic development by scanned light sheet microscopy. Science, 322(5904):1065, 2008. [15] V. Kolmogorov and Y. Boykov. What Metrics Can Be Approximated by Geo-Cuts, or Global Optimization of Length/Area and Flux. In IEEE International Conference on Computer Vision (ICCV), 2005. [16] V. Kolmogorov and R. Zabih. What energy functions can be minimized via graph cuts? IEEE Transactions on Pattern Analysis and Machine Intelligence, 26(2):147–159, 2004. [17] G. Li, T. Liu, A. Tarokh, et al. 3D cell nuclei segmentation based on gradient flow tracking. BMC Cell Biol, 8(1):40, 2007. [18] G. Lin, U. Adiga, K. Olson, et al. A hybrid 3D watershed algorithm incorporating gradient cues and object models for automatic segmentation of nuclei in confocal image stacks. Cytom Part A, 56(1):23–36, 2003. [19] P. Lo, J. Sporring, H. Ashraf, et al. Vessel-guided airway tree segmentation: A voxel classification approach. Medical Image Analysis, 14(4):527–538, 2010.
[20] X. Lou, F. Kaster, M. Lindner, et al. Deltr: Digital embryo lineage tree reconstructor. In IEEE International Symposium on Biomedical Imaging: From Nano to Macro (ISBI), 2011. [21] J. C. Olivo-Marin. Extraction of spots in biological images using multiscale products. Pattern Recognition, 35(9):1989– 1996, 2002. [22] C. Rother, V. Kolmogorov, V. Lempitsky, et al. Optimizing binary MRFs via extended roof duality. In IEEE Conference on Computer Vision and Pattern Recognition (CVPR), 2007. [23] G. Srinivasa, M. C. Fickus, Yusong Guo, et al. Active Mask Segmentation of Fluorescence Microscope Images. IEEE Transactions on Image Processing, 18(8):1817 –1829, aug. 2009. [24] M. Szummer, P. Kohli, and D. Hoiem. Learning CRFs using graph cuts. In European Conference on Computer Vision (ECCV). Springer, 2008. [25] C. H. Teo, S. V. N. Vishwanthan, A. J. Smola, et al. Bundle methods for regularized risk minimization. Journal of Machine Learning Research, 11:311–365, 2010. [26] I. Tsochantaridis, T. Joachims, T. Hofmann, et al. Large Margin Methods for Structured and Interdependent Output Variables. Journal of Machine Learning Research, 6(2):1453, 2006. [27] O. Veksler. Star shape prior for graph-cut image segmentation. In European Conference on Computer Vision (ECCV), 2008. [28] N. Vu and B. S. Manjunath. Shape prior segmentation of multiple objects with graph cuts. In IEEE Conference on Computer Vision and Pattern Recognition (CVPR), 2008. [29] C. Zanella, M. Campana, B. Rizzi, et al. Cells Segmentation from 3-D Confocal Images of Early Zebrafish Embryogenesis. IEEE Transactions on Image Processing, 19(3):770– 781, 2010. [30] D. Zink, A. H. Fischer, and J. A. Nickerson. Nuclear structure in cancer cells. Nat Rev Cancer, 4:677–687, 2004.