Exploiting Weak Shape Constraints to Segment Capillary Images in Microangiopathy 1
1
2
M Rogers , J Graham and R A Malik 1
Imaging Science and Biomedical Engineering, University of Manchester, Manchester M13 9PT, U.K. 2 Department of Medicine, Manchester Royal Infirmary, Manchester, U.K.
[email protected] www.isbe.man.ac.uk
Abstract. Microangiopathy is one form of pathology associated with peripheral neuropathy in diabetes. Capillaries imaged by electron microscopy show a complex textured appearance, which makes segmentation difficult. Considerable variation occurs among boundaries manually positioned by human experts. Detection of region boundaries using Active Contour Models has proved impractical due to the existence of confusing image evidence in the vicinity of these boundaries. Despite the fact that the shapes have no identifying landmarks, the weak constraints imposed by statistical shape modelling combined with genetic search can provide accurate segmentations.
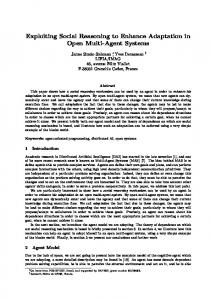
1. Diabetic Nerve Capillaries Peripheral neuropathy is an important and debilitating symptom of diabetes. Among the pathological manifestations of neuropathy is microangiopathy (disease of small blood vessels) which affects the capillaries in the endoneurium - the interstitial connective tissue in peripheral nerves separating individual nerve fibres. The two main effects are: 1. a thickening of the basement membrane or an accumulation of basement membrane material in the capillaries causing an apparent contraction of the luminal area, and 2. a proliferation of endothelial cell material together with a thickening of the basement membrane, which manifests itself in arteries, arterioles and occasionally venules. The aetiology of the condition is unknown. Quantitative studies of the variation in shape and size of the Basement Membrane (BM), Endothelial Cell (EC) and lumen region may shed light on the progression of nerve capillary damage [1]. The structure of two endoeneurial capillaries as they appear in electron micrographs is shown in Fig. 1. Currently segmentations of these areas for the purpose of measurement are taken by hand [1], which is a time consuming process and restricts the quantity of samples that
can be analysed. There is a requirement for an automated approach, both to reduce the labour required and to make the measurements more objective. The nerve capillary structures have a complex appearance, containing no consistent structural features and wide variation in shape and structure. The image evidence defining the required boundary is extremely variable from image to image and is often highly ambiguous.
Basement membrane
Endothelial cell material
(a)
Luminal area
Basement membrane
(b) Fig. 1. Two examples of nerve capillary images showing the large variation in appearance and structure. Image (a) exhibits atypical texture around the EC/BM boundary. Image (b) shows an area of locally confusing image evidence at the top of the capillary structure.
2. Segmentation of Capillaries Byrne and Graham [2] applied an Active Contour Model to this difficult segmentation problem and achieved encouraging results however, the active contours were initiated by manual positioning, and often became ‘trapped’ on confusing image evidence (see Fig. 1(b)), which provided good but incorrect local boundaries. In this study we seek to obtain more accurate segmentations by: 1. using genetic search to overcome the problem of local maxima in hill climbing methods, 2. constraining the solutions using a model of capillary shape. There is considerable variability in the shape of capillaries so shape constraints will not be as powerful as those that can be exploited, for example, in the detection of organs in anatomical images. However, capillary shapes are not totally unconstrained either, and conducting a search within the statistical limits imposed by a training set should contribute to better solutions than might be obtained with a totally data-driven approach. Active Shape Models (ASMs) have been applied successfully to analysis of radiological images [3,4]. The power of this method derives from the statistics of consistent landmark positions on training objects (see section 3 below). The shape representation is then manipulated by a hill climbing search mechanism. Capillaries do not have recognisable landmarks. However, it is still possible to use boundary points to represent the shape, and the resulting descriptions are easily manipulated by Genetic Algorithms (GAs).
3. Materials and Methods
3.1.
Data
Our data set consists of 44 electron microscope images (8-bit grey scale, 768x575 pixels) of nerve capillaries. Significant variation in the quality of the images has been introduced by inconsistencies in the image acquisition process. A set of 10 images to be used as the training set for grey level modelling has been chosen manually. The selection was made based on the perceived quality of the images. Each capillary image has been annotated three times by experts who marked the boundaries between the various structures within the capillaries. Even for expert human annotation, the boundary positions are difficult to judge and there is considerable variation in the position of manually placed boundaries even for the cleanest images. Table 1 includes the mean point-to-line distances between different expert annotations
of the same image for the 10 images in the ‘good’ image set. The average closest annotated boundary from any sampled point is 7.8 pixels. Many of the differences between boundaries are small and represent variation in positioning the same perceived boundary. However, some of the larger distances represent different interpretations of the positions of the boundaries between the relevant structures, revealing a genuine ambiguity of interpretation. Fig. 2 shows examples of capillary images with two possible interpretations of the EC/BM boundary position from the three annotations.
(a)
(b)
Fig. 2. Two examples of nerve capillaries with multiple expert annotations (marked as solid black lines) of different positions for the Endothelial Cell/Basement Membrane boundary
3.2.
Texture Discrimination
As we wish to describe texture boundaries, we transform the grey level images into a texture image. We use the method described by Byrne and Graham [2] in which Laws texture filters [5] are applied to a set of training images to give a set of texture features. These are combined using linear discriminant analysis to provide a texture discrimination function. This function is then used to generate the texture images used in GA search. Fig. 3 shows an example of a texture image generated in this way. 3.3.
Active Shape Models
Active Shape Models [6] are generated using a statistical analysis of shape and local grey level appearance over a training set of images. For a detailed description of ASM search see [7]. The training images are labelled with a set of landmark points marking consistent features throughout the set of images. Further evenly spaced model points between chosen features are often required to provide an adequate representation of the shape of a structure. The local grey level appearance is modelled over a patch at each model point.
(a)
(b)
Fig. 3. An example capillary image (a) with the corresponding texture image (b) generated using the texture discrimination function.
The variation in shape across the set is described by applying Principal Component Analysis (PCA) to the landmark points, resulting in a Point Distribution Model (PDM) 7. In this way any valid example of the shape being modelled can be approximated using:
x = x + Pb
(1)
where x is the mean shape vector, P is a set of orthogonal modes of variation and b is a vector of shape parameters. Conversely, for any shape x the parameter vector b can be calculated:
b = P T ( x − x)
(2)
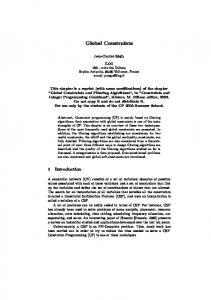
The model can be used as a representation for image search. By constraining the shape to lie within a specified range of ‘allowed’ shapes determined by the training set, solutions can be found which are guaranteed to have ‘legal’ shapes. In the capillary images there are no consistently identifiable ‘landmark’ points. To take account of this it was necessary to modify the ASM method. The training points were provided by sampling evenly spaced points from each boundary in the set of expert annotations. The first point on each boundary was defined to lie at one end of the major axis of the best fitting ellipse to the original boundary. Each training example contains 50 boundary points. The shape model training set contains all three annotations from each of the 44 capillary images giving 132 sets of boundary points. The first three modes of variation from the shape model built in this way are shown in Fig 4.
Mode 1
Mode 2
Mode 3 `2 s.d.
Fig. 4. First three modes of variation of the EC/BM boundary model. The model is built using 50 landmark points sampled from each of 132 expertly annotated boundaries.
The grey level appearance in the capillary images is very variable across the entire set, and this can lead to a model that fits well to flat image data. In order to produce good models capable of discriminating between regions, a subset of 10 images with good discrimination between endothelial area and basement membrane were manually chosen to build the grey level models. An area of 20x3 pixels around each landmark was modelled. Since the model points do not correspond to any particular anatomical feature, there is no reason to believe that the grey level appearance at one model point should be different from that at any other point. Any difference between the grey level models is a feature of the small sample rather than any real property of the data. Therefore a single local model, calculated from all model points was used for all points in the PDM. A further adjustment to the standard ASM grey level modelling scheme was introduced to utilize our prior knowledge of how the texture images were formed. An ASM was built and an iteration of search was carried out using the original landmarks as a starting point. This has the effect of finding the local best fit of the profile model to the image data, and relocating landmarks closer to areas of high texture gradient. The new point positions after search are then used to build a new grey level model that will find areas of high texture gradient more robustly. This is only appropriate as we want image search to identify areas of high texture gradient as good model matches. The process can be thought of as removing small errors from the annotated landmark positions. Comparative results between a standard ASM with a combined grey level model and an ASM built in this manner are given in section 4. 3.4.
Genetic Algorithms
In the standard implementation ASMs perform a hill-climbing search. Small areas of locally difficult texture evidence in the capillary images cause many local maxima to be present in an objective function of the quality of fit of an ASM (see Fig. 5). It is necessary to apply a search method capable of overcoming local maxima to correctly determine the global solution. Genetic Algorithms [8] are a commonly used stochastic
search mechanism which can find good solutions in the presence of numerous local maxima in the objective function. In general, the fittest individuals of a population of candidate boundaries tend to reproduce and survive to the next generation.
Fig. 5. A plane through the search space defined by the objective function (eqn. 3), produced by varying translation parameters shows many local maxima. Axis values are in pixels.
We use as the objective function:
− mi f = ∑ exp 2 i
(3)
where mi is the Mahalanobis distance for the fit of model point i from the mean position. Hill et al. [9] show that convergence of GAs is accelerated by performing an iteration of hill-climbing ASM search at the end of each generation. We can think of the GA locating hills in the objective function and the ASM reaching the top of them. This approach has been shown to speed up GA convergence [9].
4. Results GA searches were run on the set of 10 texture processed nerve capillary images that had been used to build the ASM grey level model in a leave-one-out cross validation, using a population size of 100 individuals and a maximum of 25 generations. The individual with the highest fitness from the final population was taken as the boundary found by the search. Result boundaries were evaluated against the expert annotations available for the corresponding image by calculating the point-to-line distance for each landmark point. Several annotated boundaries exist for each image giving a set of point-to-line distances for each landmark. Table 1 gives details of the point-to-line distances obtained for each of the 10 image searches.
Image 1 2 3 4 5 6 7 8 9 10 Average
A Ebm 5.98 26.19 15.28 6.73 12.60 5.97 6.32 16.70 6.42 129.3 23.15
B Ebm 6.76 25.48 14.52 3.84 12.94 5.43 5.65 14.79 4.94 84.62 17.90
C Ebm 10.34 6.71 8.22 5.86 10.18 6.23 6.60 6.91 6.48 8.72 7.62
Table 1. Search results from leave-one-out GA searches. Column A shows results from GA search with a standard ASM with a combined grey level model; column B shows results using an ASM with optimised landmarks and a combined grey level model and column C shows differences between expert annotations.
Successful (Ebm35) Total
% 72. 73 27. 27 100
Ebm 17.1 4 62.9 9 29.6 4
E bσ 12.5 7 28.5 3 32.3 0
Table 2. Robustness results from the set of 44 capillary images, both combined and seperated into successful and unsuccessful search categories. Ebm is the mean point-to-line distance of each landmark to the closest single annotation, Ebσ is the standard deviation of the values
The searches of all the images have found good approximations to the annotated boundaries except for image number 10 which has a far larger error than the rest of the set for all three methods. Of the two GA experiments, the performance of the ASM with an optimized grey level model is slightly better throughout the set with a mean point-to-line error Ebm of 17.90 against the standard ASM error of 23.15. Ignoring the results from image 10, average Ebm errors become 11.36 and 10.48 for the standard and optimised landmark models respectively, which are comparable to the error in expert annotation. Fig. 6 shows examples of GA search results together with the closest expert annotation.
(a)
(b)
(c)
(d)
Fig. 6. GA search results: solid lines are automatic segmentations and dashed lines show the closest expert annotation. (a) shows the result for image 1 from Table 1; (b) shows the result for a successful search from the robustness set of 44 images; (c) show a search result that has been influenced by local image evidence; (d) shows the results from image 10 in Table 1 which is an example of a failed search.
Table 2 presents an extension of the evaluation in which leave-one-out tests were carried out on the entire set of 44 usable capillary images. In each case 43 images were used to train the shape model, but the training of the texture model was limited to the ‘good’ set of 10 images. The search results have been classified into successful searches, with a mean point-to-line distance less than 35 pixels, and unsuccessful searches. The GA search technique is successful in 72.7% of cases. The overall pointto-line error throughout the entire set was 29.6 pixels.
5. Conclusions and Discussion Actives Shape Models manipulated by GA search have been shown to produce results that have comparable accuracy to human experts. However, the method is inadequately robust at its current state of development; just over 25% of the searches converge on totally misleading evidence. Inspection of the images on which the search failed
suggests that this occurred in cases where the textured appearance of the boundary is significantly different from those in the model, including image 10 in the ‘good’ set. Fig. 1(a) gives an example of such an image with unusual texture appearance. This indicates that the most likely approach to improving robustness is in development of more adaptive texture models. It is not yet clear whether the very wide variation in texture in some images is a genuine feature of the capillary images or if it has been caused by some error in the imaging process. Analysis of a larger image set will allow investigation of this.
Acknowledgements We would like to thank Dave Walker of the Department of Medicine, Manchester Royal Infirmary for his assistance in annotating the capillary images used in this work.
References 1.
2.
3. 4.
5. 6.
7. 8. 9.
R A Malik, S Tesfaye, S D Thompson, A Veves, A K Sharma, A J M Boulton, J D Ward. Microangiopathy in Human Diabetic Neuropathy: Relationship between Capillary Abnormalities and the Severity of Neuropathy. Diabetologia, vol. 30, pp. 92-102, 1989. M J Byrne and J Graham. Application of Model Based Image Interpretation Methods to Diabetic Neuropathy. Proceedings of European Conference on Computer Vision, vol. 2, pp. 272-282, 1996. T F Cootes, A Hill, C J Taylor, J Haslam. The Use of Active Shape Models for Locating Structures in Medical Images. Image and Vision Computing vol.12, no.6, pp.355-366, 1994. T F Cootes, A Hill, C J Taylor, Medical Image Interpretation Using Active Shape Models: Recent Advances. 14th International Conference on Information Processing in Medical Imaging, pp. 371-372, 1995. K I Laws. Textured Image Segmentation. University of Southern California, 1980. T F Cootes, C J Taylor, D H Cooper and J Graham. Active shape models – their training and application. In Computer Vision and Image Understanding, vol. 61, no. 1, pp. 38-55, 1995. T F Cootes, C J Taylor, D H Cooper and J Graham. Image search using trained flexible shape models. Advances in Applied Statistics, pp. 111-139, 1994. L Davis. Genetic Algorithms and Simulated Annealing. Pitman, London, 1987. A Hill, T F Cootes and C J Taylor. A Generic System for Image Interpretation Using Flexible Templates. BMVC, pp. 276-285, 1992.