LEARNING TURN AND TRAVEL ACTIONS WITH AN UNINTERPRETED. SENSORIMOTOR APPARATUS. David Pierce. Department of Computer Sciences.
In Proceedings IEEE International Conference on Robotics and Automation Los Alamitos, CA: IEEE Computer Society Press, 1991.
LEARNING TURN AND TRAVEL ACTIONS WITH AN UNINTERPRETED SENSORIMOTOR APPARATUS� David Pierce Department of Computer Sciences University of Texas at Austin, Austin, TX 78712
Abstract We demonstrate a learning method by which a mobile robot may analyze an initially uninterpreted sensorimotor apparatus and produce a useful characterization of its set of actions. By \initially uninterpreted" we mean that the robot is given no knowledge of the structure of its sensory system nor of the e�ects of its actions. It merely sees and produces vectors of real numbers. We apply the method to the case of a simulated robot with an array of 16 range nders and a motor apparatus with which it can make combinations of turning and advancing actions. The robot learns a set of primitive actions allowing it to make pure turns (both clockwise and counterclockwise) and pure travels. We believe our approach is robust and will apply in general to sensory systems which may be used for motion detection (such as arrays of photoreceptors or range nders).
1 Introduction
We are concerned with the learning problem faced by a mobile robot which has initially uninterpreted sensors and e�ectors and whose goal is to learn to use those sensors and e�ectors in order to navigate in its environment. Kuipers (1985), Rivest & Schapire (1987), Shen & Simon (1989), Sutton (1990), and others have explored methods by which robots with uninterpreted sensors and e�ectors can analyze unknown environments possessing a nite number of discrete states. A di�erent approach is taken by Brooks (1986), Kuipers & Byun (1988), Mataric (1990), and others who have used continuous spatial environments such as those in which a mobile robot lives. In their work, the sensorimotor apparatus is completely understood by the robot. Our approach is a combination of these two alternatives. Our robot lives in a (simulated) continuous spatial world and initially has no understanding of its sensorimotor apparatus. The robot must rst learn how to use its sensorimotor apparatus and then learn how to navigate in its environment.
� This work has taken place in the Qualitative Reasoning Group at the Arti cial IntelligenceLaboratory,The University of Texas at Austin. Research of the Qualitative Reasoning Group is under the direction of Benjamin Kuipers and supported in part by NSF grants IRI-8905494 and IRI-8904454, by NASA grant NAG 2-507, and by the Texas Advanced Research Program under grant no. 003658-175.
Toward this end we showed (Pierce & Kuipers, 1990) how a robot may learn goal-driven behaviors using an uninterpreted sensorimotor apparatus and pointed out that these behaviors may be improved by knowledge of turn and travel actions. In this paper we discuss work done in developing methods by which a simulated robot (henceforth called a \critter") can learn the basic behaviors of turning and traveling (assuming that the critter's e�ectors permit such behaviors).
2 Overview
The learning process proceeds by analyzing a sensory history (a sequence of sense vectors seen by the critter over a period of time) using the following steps: 1. De ne a distance metric between pairs of sensors. 2. Use the metric to group sensors into \sensoria" (e.g., groups of sonar range nders or photoreceptors). 3. Map each group's sensors onto a two-dimensional map. 4. De ne local motion detectors using this map. 5. Use the local motion detectors to learn a mapping from actions to average motion vector elds (amvf's). 6. Analyze this mapping to produce a set of qualitatively distinct amvf's and associated primitive actions. 7. Search this set for turn and travel actions. The last step has not been implemented yet but we will describe a method we believe will work.
3 Problem Description
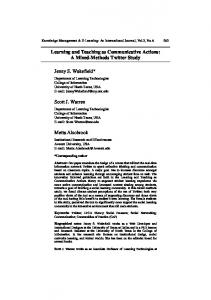
The critter's world is simulated as a 100x100 grid with a number of obstacles and one food source in it (Figure 1).
Figure 1: The critter world with critter (lower right) and food source (upper left).
The critter has the following sensors, organized into a sense vector, s, of 21 real-valued components. Each sense component's value lies between ?1:0 and 1:0.
At-food: This component is equal to 1.0 at the food (i.e., if it is inside the 7x7 square centered at the food source) and 0.0 otherwise. Sonar: This is a 16-component vector, (s0 ; s1 ; :::;s15 ), whose components give the ranges to the nearest objects (food or walls in this case) in each of sixteen directions. These have a maximum value of 1.0 which they take on when the nearest object is beyond a certain distance away. The sonars are numbered clockwise from the front. Smell: This is equal to 1.0 if the critter is at the center of a food source. It decreases with distance from the nearest source of food. Position: This is a pair, (x,y), which gives the absolute position of the critter (but of course the critter doesn't know that this pair gives its position). Compass: This gives the absolute orientation of the critter, with respect to east. A value of 1.0 corresponds to 180 degrees, -1.0 corresponds to -180 degrees. The motor apparatus is Turn-and-advance: This action function takes two parameters. Positive values of the rst turn it counterclockwise (up to 22.5 degrees) and negative values clockwise. The second parameter determines the amount that the critter advances in this new direction (up to 5 grid locations). The critter does not advance at all if this component is negative.
4 From sensorimotor histories to turns and travels
The learning process is summarized below: Input: The input to the learning algorithm is a sensorimotor history produced as the critter wanders randomly in its world. This history is a sequence of sense vectors, one per time step. Output: A characterization of the critter's action space. A set of primitive actions is found from which the other actions may be composed. For example, if the critter is capable of performing turning actions and advancing actions, the set should contain two primitives, one for each of these actions. Interestingly, these primitive actions will be, in a sense, orthogonal.
4.1 Tools for analyzing sensory histories
In this section, we introduce a number of de nitions which will enable us to describe the overall learning process more clearly and concisely. The raw data used in this analysis is the history. The history may be represented as a function of type1 HIST = (Z0+ � [0 : : : (ns ? 1)] ! [?1; 1]) where ns is the number of sense components and h(t; c) gives the value of component c at time t. Thus, for example, h(t; 0) is the value of the at-food sensor at time t. In analyzing a sense component, we have found the frequency distribution to be a helpful tool. The distribution of 1 Some notation: Z0+ is the set of nonnegative integers. [a; b] is the set of reals between a and b inclusive. R+0 is the set of nonnegative reals. [0 : : : n] is the set of integers between 0 and n inclusive.
A Language for Analyzing Sense Histories
History (HIST): Dist'n (DIST):
Two Basic Data Types h : Z0+ � [0...(ns - 1)] ! [-1,1] p : [0...(nb - 1)] ! R+0
Operators on Histories Time Derivative: @t : HIST ! HIST Dist'n Operator: Dc : HIST ! DIST
Figure 2: A concise description of the language used for analyzing sense histories. a sense component, c, partitions the range of c (i.e., [?1; 1]) into a number of subintervals or \bins" and associates with each subinterval the number of times in the history that the value of component c lay in that subinterval. If nb is the number of bins in the distribution, then a distribution, p, may be represented as a function of type DIST = [0 : : : (nb ? 1)] ! R+0 . We introduce the operator D which maps histories into distributions. The operator D is parameterized by nb, the number of bins in the partition, and by c, a sense component. In our experiments, nb = 100. The operator D is of type HIST ! DIST. We de ne Dc as follows: Dcfhg(i) = P�t bi (h(t; c)) if x 2 bini where bi (x) = 01;; otherwise Here, bini is the ith subinterval in the distribution's partition of the interval [?1; 1]. The summation is taken over all values of t for which h is de ned. Another useful operator is the operator @t , mapping histories into histories, which can be viewed as taking the derivative of a complete history with respect to time. Thus
@t fhg(t; c) = h(t; c) ? h(t ? 1; c);
t>0
To summarize, the functions and operators introduced in this section are listed in Figure 2 with their types. A more complete set of operators for analyzing sensory histories is given by Pierce & Kuipers (1991).
4.2 Step One: Derivation of an intersensor distance metric
The goal of this step is to de ne a metric, based on the sensory history, that gives a measure of the dissimilarities between pairs of sensors. This metric should be such that sensors that belong together in an array of sensors are similar according to the metric. For example, the distance between two adjacent sonar sensors should be small as should the distance between two photoreceptors in a retina. In the next section, we discuss how this metric can be used to form sensory subgroups. The distance metric has three contributing factors, also distance metrics, each based on a di�erent notion of how sensors di�er. The overall metric is obtained by combining
these metrics using the Pythagorean rule:
p
d = (d1 )2 + (d2 )2 + (d3 )2 Consider a ring of sonar sensors. Adjacent sensors measure ranges to objects that are physically close to each other; thus, due to the fact that the spatial world is generally continuous, these adjacent sensors generally have similar values, i.e., they are correlated. The metric d1 is based on this observation: d1 (i; j ) is proportional to the sum of absolute di�erences between sense values for units i and j with the sum taken over all sense vectors in the sense history: X d1 (i; j ) = k1 jh(t;i) ? h(t; j )j t
where k1 is chosen to normalize the function so that the largest distance between any two units is 1.0. Recall that h(t; i) is the value of sensor i at time t. Since all the sensors in the ring operate in the same fashion, disregarding temporally local variations, the sensors should all have similar overall distributions and di�erence distributions. Metrics d2 and d3 are based on this observation. The second metric, d2 (i; j ), is proportional to the sum of absolute di�erences between pointwise distribution values for units i and j:
d2 (i; j ) = k2
nb ?1 X x=0
jDifhg(x) ? Dj fhg(x)j
Here, again, k2 is used for normalization. The third metric, d3 (i; j ), is proportional to the sum of absolute di�erences between pointwise di�erence-distribution values for units i and j:
d3 (i; j ) = k3
nb ?1 X x=0
jDi f@t fhgg(x) ? Dj f@t fhgg(x)j
4.3 Step Two: Formation of sensory subgroups In this section we show how the distance metric can be used to group together sensors that naturally belong together. Consider again the ring of sonar sensors. Adjacent sensors are very similar, but sensors on opposite sides of the ring may be quite di�erent since their values are not correlated. In spite of this fact, we want all of the sonar sensors to be grouped together. We can accomplish this end in the following way: Given a distance metric, d, we compute, for each sensor, s, the set of sensors that are most-closely-related-to it. This is done using thresholding. The function mcrt (for mostclosely-related-to) returns, given sense component i, a list of components which are similar to it: fj j d(i; j ) < thg where th is the threshold. Here is an example of what is produced by mapping the function mcrt to the list of sense components (using th = 0:3): (0) (1 2 3 4 14 15 16) (1 2 3 4 5 15 16) (1 2 3 4 5 6) (1 2 3 4 5 6 7) (2 3 4 5 6 7 8) (3 4 5 6 7 8 9) (4 5 6 7 8 9 10) (5 6 7 8 9 10 11) (6 7 8 9 10 11 12) (7 8 9 10 11 12 13)
(8 9 10 11 12 13 14) (9 10 11 12 13 14 15) (10 11 12 13 14 15 16) (1 11 12 13 14 15 16) (1 2 12 13 14 15 16) (1 2 13 14 15 16) (17 19) (18) (17 19) (20).
Notice that mcrt has grouped the sonar sensors together into groups of neighboring sensors. For example, the group (1 2 3 4 14 15 16) contains the three components on each side of sense component 1. Each of the groups in the resulting list may be thought of as an equivalence subclass, e.g., 1, 2, 3, 4, 14, 15, and 16 could be called equivalent because these sense components are all similar (i.e., their distances are less than the threshold). The function closure computes the closures of these equivalence subclasses and produces complete equivalence classes. Another way of saying this is that the function closure uses transitivity and the relation mcrt to produce closed groups of sensors. The set of closed groups is shown below: (0) (1 2 3 4 5 6 7 8 9 10 11 12 13 14 15 16) (17 19) (18) (20).
Notice that the sonar sensors have all been grouped together into a group containing no other sensors. This process of grouping the sensors together is robust in the sense that a wide range of threshold values produces the same grouping: as the threshold changes, the subgroups returned by mcrt change, but the closures of these subgroups remain the same.
4.4 Step Three: Two-dimensional structure of sensory subgroups
In the last section we showed how to discover the natural groupings of sensors in the sensory apparatus. In order to do motion detection, we need to know, in addition, the relative positions of the sensors. In this section, we show how to deduce such information using a program, called formation, which takes a matrix of distances between pairs of units as input. It uses a relaxation algorithm to map the set of units to a two-dimensional surface such that the positions of the units satisfy the distance constraints speci ed by the matrix. (See Dewdney (1987) for a presentation of a similar program.) The distance metric used is d1 , which looks at absolute di�erences between sense values summed over time. We do not use the other distance metrics because ideally they return 0 for distances between units in the same sensorium. Metric d1 is best for nding di�erences within a sensorium. We apply this program to all subgroups detected in Step 2 which have at least ten elements. In the running example, only the sonar sensorium meets this requirement. In Figure 3 we show the positions of the sonar sensors as computed by the formation program. Clearly, the program has, in an intuitively satisfying sense, captured the physical structure of the sonar ring. An obvious question to raise at this point is \Why use two dimensions to represent the structure of the sensorium?" One justi cation is that many examples of sensory systems useful for motion detection (e.g., retinas and arrays of range nders) can be viewed as two-dimensional arrays of sensors.
7 12
3
11 14
16
4 15
6
9 10 2
11 10 9
13 8 5
1
12 13 14 15 16
8
1 2 3
7 6 5 4
Figure 3: These diagrams show example initial and nal states of the relaxation system which deduces the ring structure of the sonar apparatus.
4.5 Step Four: De nition of local motion detectors In this section, we show how to use the structural information derived in the last section in order to de ne local motion detectors, one per sensory unit in the sensorium. Let us derive a de nition for the instantaneous \optical"
ow seen at unit i. The optical ow measured at unit i is taken to be a weighted sum of motion vectors in the direction from unit i to unit j where j ranges over all of the units close to unit i. (In the present implementation, two units are considered close to each other if their distance is less than 0.3 { the maximum distance between components in the mapping is roughly 1.0.) The weight is inversely proportional to the distance between units i and j . It remains to show how to compute the motion vector detected between units i and j . In computing the motion detected in the direction from unit i to unit j , we use the one-dimensional form of the optical ow constraint equation (see Horn, 1986). Let Et = @E @t and Ex = @E @x where x is taken to be the spatial dimension in the direction from unit i to unit j and E (x; t) is the intensity of the stimulus measured by the sensors as a function of time and position. Then the component of the optical ow from i to j is given by: v = ?Et =Ex . A problem with this formulation is that if the value of Ex is small (or zero), then the calculation will be prone to error (or will be unde ned). The measurement of the optical ow is more precise at edges or, in general, when the spatial derivative, Ex , is large. Thus we weight the measurement using the term (Ex )2 and measure the value of: v = ?Et =Ex � (Ex )2 = ?Et � Ex These partial derivatives are approximated using the last and current sense vector values for units i and j : Et = sti ? sti?1 and Ex = (stj ? sti )=�x where �x is the distance between units i and j in the two-dimensional map of the sensorium and sti = h(t; i).
4.6 Step Five: Average motion vector elds
In the last section, we showed how to compute, given the structural description of a sensorium, a local motion vector for each unit in the sensorium. Taken together, these motion vectors form an instantaneous motion vector eld. Since the instantaneous motion vector elds for a given action uctuate greatly with time, we characterize the effects of actions using average motion vector elds (amvf's),
where the average is taken over a whole sensorimotor history. We want a mapping that gives the average motion vector eld for any particular action. This mapping is obtained as follows: The space of actions is divided up into a set of boxes. For example, if there are two components to the action vector (na = 2), we divide up each component's range (i.e., [?1; 1]) into a number of subintervals (we used 11). The entire space of actions is thus divided into 11na = 121 boxes. These boxes can be speci ed by two-place indices where the rst component of the index is the central value of the rst action component for that box, etc. For example, the index (0:0; 0:91) corresponds to a set of actions whose turn components are close to zero and whose advance components are near 0.91. An average motion vector eld is learned for each of these boxes: Each time the critter takes an action, it updates the amvf for the box corresponding to the action just taken. Examples of these vector elds are shown in Figure 4. Notice that the amvf's for the pure turn action and the pure advance actions are orthogonal to each other. Notice also that all the amvf's can be viewed, approximately at least, as linear combinations of the amvf's for the pure turn and advance actions. These facts will be exploited in the next step.
4.7 Step Six: Characterizing the action space
Given the mapping from actions to average motion vector elds learned in the last step, the learning problem reduces to characterizing the space of actions using that mapping. This is done by analyzing the space of amvf's that the critter is capable of producing. We want to nd a basis for this space, i.e., a set of representative motion vector elds from which all the motion vector elds may be produced by linear combination. This type of decomposition may be performed using Principal Component Analysis. (See Mardia et al. (1979) for an introduction and Oja (1982) for a discussion of how a neural network can function as a Principal Component Analyzer.) Principal Component Analysis works as follows. Let x be the random variable of interest (e.g., the average motion vector eld). Assume that the expected value of x is 0. The rst principal component is the component of the variable in the direction of the vector b1 where this vector is chosen so as to maximize the variance of this component subject to the constraint that the magnitude (i.e., length) of vector b1 is 1. The second principal component is chosen similarly with the added constraint that it must be uncorrelated with the rst component. The process is repeated for the subsequent components. What is of interest to us is the set of vectors bi that results. These may be viewed as a basis set for variable x. In fact, x may be approximated as a linear combination of the rst few principal basis vectors while throwing the remaining ones away. The application of Principal Component Analysis to a simple two-dimensional set of points is shown in Figure 5. Principal Component Analysis may be performed using a technique called Singular Value Decomposition (A.K. Cline, personal communication; see also Press et al., 1988).
(?:91; ?:91)
(0:0; ?:91)
(:91; ?:91)
(?:91; :91)
(0:0; :91)
(:91; :91)
Figure 4: Examples of average motion vector elds and the central action vectors for the corresponding action boxes. b2 b1
if we keep only the rst two components. The rst three principal components obtained in the experiment are shown in Figure 6. Clearly, the rst corresponds to a pure rotation motion and the second to a pure advance motion. The third (and subsequent components) do not correspond to motions.
Figure 5: Principal Component Analysis applied to a set of two-dimensional points. The two basis vectors are shown.
The sample values of x (the average motion vector elds with the average removed) are organized as the rows of matrix A. There are 121 of these elds each having 32 components. The Singular Value Decomposition of A is Am�n = Um�n Wn�n VnT�n where W is a diagonal matrix whose elements are the singular values of A and the rows of V T are the desired orthonormal basis vectors. Here, m = 121, the number of average motion vector elds and n = 32, the number of components in each amvf (two for each local motion detector in the sonar sensorium). Below, we make explicit the relationship among the four matrices. We will assume that the decomposition orders the singular values according to magnitude, with the largest in the upper left corner.
2 66 66 4
a1 3 2 7 66 .. 7 . 7 75 = 664 am
u1 3 2 32 T 3 v1 77 w1 6 7 .. 7 6 . .. 5 4 ... 75 . 74 5 wn vnT um
Here we see how each of the amvf vectors is written as a linear combination of the vectors in V . Consider vector ai . According to the equation above, it may be written as:
ai =
n X j=1
uij wj vjT
Thus we have found a basis set (the row vectors of V T ) for the space of amvf's. The amvf's may be approximated by throwing away all but the most important basis vectors. Thus, for example, vector ai may be approximated by ai � ui1 w1v1T + ui2 w2 v2T
b1 b2 b3 Figure 6: The rst three principal components for the space of average motion vector elds.
We have shown how to decompose avmf-space into meaningful components. What the critter needs is to break its space of possible actions into primitive components. It can do this by nding the actions that best correspond to the principal components. Consider the rst principal component. We need an action which produces this e�ect. We would also like to have an action which produces the opposite e�ect if such an action exists. In order to do this, we look at angles between amvf's and the rst principal component. We choose the actions whose amvf's are closest to linear or antilinear with the rst principal component. These are (?0:91; ?0:91) and (0:91; ?0:91), the primitive actions that best capture the e�ect illustrated by the rst principal component. We proceed similarly for the second principal component and nd that only the action (0:0; 0:91) corresponds well to the principal component. Its e�ect is actually opposite to that described by the component. For the remaining principal components, no actions correspond well. To conclude, here is the characterization of the action space after this step: The motor apparatus has two degrees of freedom (at least from the perspective of the sonar apparatus). The actions (?0:91; ?0:91) and (0:91; ?0:91) can be used for motion in the rst dimension and the action (0:0; 0:91) can be used for motion in the second dimension. The characterization of the set of actions may be taken a step further. The nonprimitive actions may be charac-
terized in terms of their e�ects. The amvf's of these actions may be approximated as linear combinations of the two principal amvf's. These combinations may be taken directly from the singular value decomposition as was discussed previously:
ai � ui1 w1v1T + ui2 w2 v2T
4.8 Step Seven: Recognizing turns and travels After deriving the decomposition of action space into primitive components from the last section, the critter is in a good position for learning about its motor capabilities. A very large action space has been reduced to a set of three primitive actions in two dimensions. The critter now has only to understand the e�ects of these primitives in order to understand its entire set of actions. In this last step, (which we have not yet implemented) we are speci cally interested in diagnosing turn and travel actions. This can be accomplished by observing what happens when the actions are repeated many times. When a turn action is repeated, the sequence of sense vectors will exhibit periodicity. When a travel action is repeated, periodicity will not generally result. This periodicity can be diagnosed as follows: The critter remembers the sense vector s0 at time zero. It repeatedly executes the action being studied, looking at the di�erence, kst ? s0 k, between the current sense vector and the remembered sense vector. It keeps track of the times ftk g when this di�erence becomes close to zero and then analyzes the values of �t = tk ? tk?1 . These values should be clustered together if the senses are periodic; in this case the mean value of �t will give an estimation of the period of rotation for the action. If the action is a genuine turn, the measured period should be the same when the test is repeated in di�erent locations.
5 Summary
We have outlined a method for solving part of the problem of map learning with an uninterpreted sensorimotor apparatus. Using our method, a mobile robot may learn a useful characterization of its action space. The rst step is to learn the structure of the sensory apparatus. Using this structural information, the critter de nes motion detectors which allow it to learn the e�ects of its actions in terms of average motion vector elds. It then analyzes the space of such motion vector elds in order to identify the principal motion vector elds and associated primitive actions. The critter is then in a position to understand its motor system by exploring the use of the primitive actions, (for example, by diagnosing turn and travel actions).
6 Future Work
We intend to explore the generality of the learning method presented here by testing it on other sensorimotor systems. We have successfully applied our method to a critter with a tank-style locomotion system (as is used in the work of Kuipers & Byun, 1988) and will apply it to a \roving eye," in which the sensory system is a retinal-style array of photoreceptors looking straight down on a patterned
surface with the motor system allowing for translation in two dimensions plus rotation. We expect that the analysis will produce three primitive actions corresponding to these three degrees of freedom.
References
[1] Brooks, R.A. (1986). A robust layered control system for a mobile robot. IEEE Journal of Robotics and Automation., March 1986, pp. 14-23. [2] Dewdney, A.K. (1987). Computer recreations: Diverse personalities search for social equilibrium at a computer party. Scienti c American, September 1987, pp. 112-15. [3] Horn, B.K.P. (1986). Robot Vision. Cambridge, MA: The MIT Press, ch. 12. [4] Kuipers, B.J. (1985). The map-learning critter (AITR85-17). AI Laboratory, UT-Austin. [5] Kuipers, B.J., & Byun, Y.-T. (1988). A robust, qualitative method for robot spatial learning. Proceedings AAAI-88, St. Paul/Minneapolis, pp. 774-779. [6] Mardia, K.V., Kent, J.T., & Bibby, J.M. (1979). Multivariate Analysis. New York: Academic Press. [7] Mataric, M.J. (1990). Environment learning using a distributed representation. Proceedings IEEE International Conference on Robotics and Automation, pp. 402-6. [8] Oja, E. (1982). A simpli ed neuron model as a principal component analyzer. Journal of Mathematical Biology, 15, 267-73. [9] Pierce, D.M., & Kuipers, B.J. (1991). Learning hillclimbing functions as a strategy for generating behaviors in a mobile robot. From Animals to Animats: Proceedings of The First International Conference on Simulation of Adaptive Behavior, J.-A. Meyer & S.W. Wilson, eds., Cambridge, MA: The MIT Press/Bradford Books, pp. 327-336. [10] Press, W.H., et al. (1988). Numerical Recipes in C. Cambridge University Press, pp. 60-72. [11] Rivest, R.L., & Schapire, R.E. (1987). A new approach to unsupervised learning in deterministic environments. Proceedings of the Fourth International Workshop on Machine Learning, Pat Langley, ed., pp. 364-375. [12] Sutton, R.S. (1990). Integrated architectures for learning, planning, and reacting based on approximating dynamic programming. Proceedings Seventh International Conference on Machine Learning, Porter, B.W. & Mooney, R.J., eds., pp. 216-24. [13] Shen, W.-M., & Simon, H.A. (1989). Rule creation and rule learning through environmental exploration. Proceedings IJCAI-89, pp. 675-80.