tests are good predictors. • tests predict success better than grades ... 9. 200. 190.
180. 170. 160. 150. 140. 130. 120. 110. 60 62 64 66 68 70 72 74 76.
INTELLIGENCE John Gabrieli 9.00
1
Exam 2 – Next Thursday 50 multiple-choice questions 30 from book (Chapters 5-7) 20 from Sacks & lectures 5 short answers (4 pts) Select 5 from 8-10 choices 70 points
2
WHY HAVE TESTS?
3
WHY HAVE TESTS? • learning • selection & prediction achievement aptitude (SAT, GRE)
4
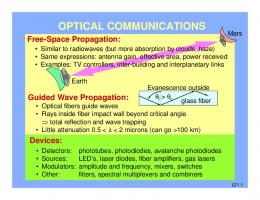
Standardized tests and graduate students’ success • tests are good predictors • tests predict success better than grades • combination of tests and grades is best
Kuncel & Hezlett, Science, 2007
(.4 correlation between sex & height) © AAAS. All rights reserved. This content is excluded from our Creative Commons license. For more information, see http://ocw.mit.edu/fairuse.
5
WHAT IS INTELLIGENCE?
6
WHAT IS INTELLIGENCE? • ability to solve problems • understand and learn complex material • adapt to the environment • mental quickness
7
WHAT MAKES SOMETHING AN EXPERIMENT? dependent variable what you measure - the outcome
independent variable what you vary Studies of intelligence are almost always correlational and rarely experimental Studies of intelligence focus on differences among people rather than intelligence per se 8
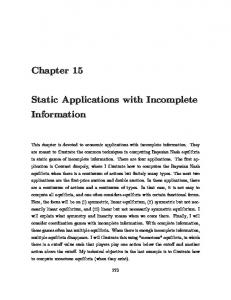
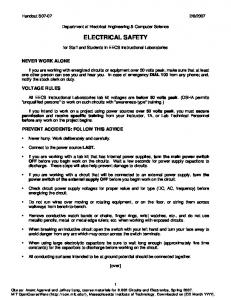
Positive Correlation 200 190
Weight (pounds)
180 170 160 150 140 130 120 110
60
62
64
66
68
70
72
74
76
Height (inches) 9 Image by MIT OpenCourseWare.
IQ = Intelligence Quotient • France, 1904-1911, universal elementary education • Alfred Binet, physician, aimed for an objective way to identify children who needed extra help • many abilities, many tests - copy a drawing, repeat digits, recognize coins, explain why a statement did not make sense 10
IQ = Intelligence Quotient • give test to normal children at multiple ages • mental age vs. chronological age
11
IQ = Intelligence Quotient • David Wechsler Wechsler Adult Intelligence Scale (WAIS) Wechsler Adult Intelligence Scale for Children (WISC) Verbal Subtests and Performance Subtests
12
WAIS - III • Verbal Subtests Vocabulary - define words Similarities - how are an airplane and a car alike Arithmetic - simple operations Digit Span - digits in STM capacity Information - who was Martin Luther King, Jr.? Comprehension - why are there taxes? 13
WAIS - III • Performance Subtests (nonverbal) Picture Completion - what is missing? Digit-Symbol Coding Block Design Matrix Reasoning Picture Arrangement - order pictures
14
IQ = Intelligence Quotient • give test to normal children at multiple ages • mental age (MA) vs. chronological age (CA) IQ = (MA/CA) X 100 Average = 100
15
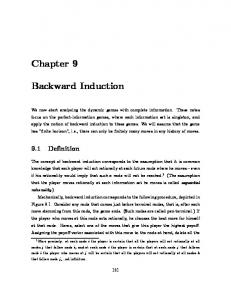
Standardized Test • standardized sample - random population • normal distribution • norming (raw score vs. standardized score) mean = 100 standard deviation = 15 for WAIS 67% of people are +/- 1sd (85-115); more than 2sd = 4.54% Age norming - on 6th birthday - move from 120/100 - 40 year-old like undergrad raw 16 score = 230 IQ
Source: Stangor, C. Introduction to Psychology. Flatworld Knowledge, 2010. Courtesy of Flatworld Knowledge.
17
< 70 a big problem
Top 2% = Mensa
RELIABILITY & VALIDITY • Reliable - same score on two occasions • Valid - measures what it is supposed to measure
18
VALIDITY • IQ - correlates with GPA in high school and college, job success, salary, stable marriages, staying out of jail, longevity • 25% of variation (personality, education, culture)
19
WHAT DO 15 IQ POINTS MEAN? 100 IQ - average in high school, year or two in community college 115 IQ - at least college, white collar 85 IQ - dropping out of high school, skilled labor 20
Relationship between IQ and income and percentage of women having illegitimate children, for siblings from the same stable, middle‐class family who differ in IQ.
IQ Group
Income
Very bright siblings (120+) Bright siblings (110‐119) Reference group (90‐109) Dull siblings (80‐89) Very dull siblings (