A New Approach to the Determination of Warp-Weft Densities in Textile Fabrics by Using an Image Processing Technique Kazım Yildiz1, Volkan Yusuf Şenyürek1, Zehra Yildiz2, Mustafa Sabri Özen2 Department of Electronic-Computer Education, Marmara University, Kadıköy, İstanbul, Turkey
1
Department of Textile Education, Marmara University, Kadıköy, İstanbul, Turkey
2
Correspondence to: Kazım Yildiz email:
[email protected] ABSTRACT This paper presents a new approach for processing images of woven fabrics to determine the warp-weft densities. This approach includes three main steps, namely; image transformation, image enhancement, and analyzing signals of the image. In the experimental process, 19 different woven fabric images were scanned at a high resolution (2400 dpi); then these images were transferred to the MATLAB program. By using the vertical and horizontal frequencies of the textile image, the FFT analyses were carried out. Consequently with 97 % accuracy, the densities were predicted only by using the images instead of counting them by hand.
forming forces and the influence of these two deformations on composite laminate properties [9]. In another research an automated searching system based on color image processing system was improved for forensic fiber investigations, in order to determine the connection between the crime scene and the textile material [10]. Warp and weft densities in woven fabrics are very important parameters in making textile production measurements. Determination of weft and warp densities in textile woven fabric depends on the principle of analyzing the vertical and horizontal frequencies from a textile image. Counting these parameters is generally made by hand with the help of a tiny device namely “loupe”. So the exact density can change from person to person. This paper presents a warp-weft density prediction system based on a given textile image. In order to prevent individual errors the image processing technique was used to determine the exact weft-warp densities. For the system design, 19 different textile fabrics were scanned in 2400 dpi resolution and then transformed to the MATLAB program. The FFT analysis was performed from the vertical and horizontal frequencies of the textile image. The results show that weft-warp densities can be determined by using just its’ image with 97 % accuracy.
Keywords: textile fabrics, warp weft densities, image processing INTRODUCTION Image processing technique usage for industrial applications is widespread. For instance, image processing techniques can be used in the textile industry for applications such as flaw detection in textile fabrics [1, 2], lint in textile fibers [3, 4], yarn diameter measurement from a given image of an optical sensor [5], and scanning electron microscopy [6], and yarn quality testing equipment for measuring yarn production characteristics [7]. In a previous study, the digital image correlation technique was used to assess macro-scale textile deformations during biaxial tensile and shear tests in order to verify the loading homogeneity and the correspondence between the textile and rig deformation [8]. Also, tow geometry parameters are measured with the help of microscopy and image processing techniques in order to determine tow deformations in a textile preform subjected to Journal of Engineered Fibers and Fabrics Volume 9, Issue 1 – 2014
EXPERIMENTAL Materials and Methods Textile fabric samples were collected from various textile companies. The scanning process was performed with a 2400 dpi, HP Scanjet 4070 Photosmart Scanner; then the MATLAB program was used for all analyses. 1
http://www.jeffjournal.org
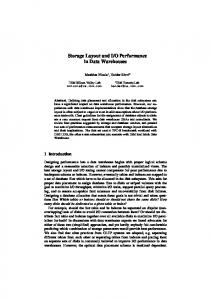
A warp-weft density prediction system was designed by using an image processing technique from a given textile fabric image. Firstly, 19 different woven fabrics were scanned in 2400 dpi resolution and then transformed into gray-scale images in the MATLAB program. In the second step, horizontal and vertical segmentation was achieved with the morphological image processing. For this segmentation, two different line structure elements were applied to the input image. The length of the line elements were 50 pixel and the angles of the elements were 0 degrees and 90 degrees respectively. Figure 1 shows the original batiste texture input image and vertical and horizontal segmented images. Thirdly, the FFT analysis was carried out by getting horizontal signals from 400 different rows of the images. The average value of these signals gave us the horizontal frequency components of the image. The same process was applied on the vertical direction of the image to determine the vertical frequency components.
upper left-hand corner of this pixel has coordinates of (0.5,0.5) (Figure 2b) [11].
FIGURE 2. (a)Pixel coordinate system (b) Spatial coordinate system.
Frequency content of the waveform provides more useful information than the time domain representation. Determining of the frequency content of a waveform is termed spectral analysis. The Fourier transform (FT) method is the most straightforward spectral analysis technique. The Fourier transform approach takes advantage of the fact that sinusoids contain energy at only one frequency. The two-dimensional version of the Fourier transform can be applied to images providing a spectral analysis of the image content. It can be a very useful analysis tool for describing the content of an image. When applied to images, the spatial directions are equivalent to the time variable in the one dimensional Fourier transform, and this analogous spatial frequency is given in term of cycles/unit length (i.e., cycles/cm or cycles/inc) [12].
FIGURE 1. (a) The raw fabric (b) vertical segmented image (c) horizontal segmented image.
The two-dimensional Fourier transform in continuous form is given by:
Image Processing Technique Images can be treated as two-dimensional data, and many signal processing approaches can be directly applied to image data. An image is always represented in one, or more, two dimensional arrays I(m,n). Each element of the variable I represents a single picture element, or pixel. The most convenient indexing protocol follows the traditional matrix notation, with the horizontal pixel locations indexed left to right by the second integer n and the vertical locations indexed top to bottom by the first integer m (Figure 2a). Another indexing protocol accepts noninteger indexes. In this protocol, termed spatial coordinates, the pixel is considered to be a square patch, the center of which has an integer value. In the default coordinate system, the center of the upper left-hand pixel still has a reference of (1,1), but the Journal of Engineered Fibers and Fabrics Volume 9, Issue 1 – 2014
(1)
The variables
and
are frequency variables,
they define spatial frequency and their units are in radians per sample. F(w1,w2) is a complex-valued function that is periodic in both and . The discrete form of Eq. (1) is similar to their time domain analogs. For an image size of M by N, the discrete Fourier transform (DFT) becomes: (2)
2
http://www.jeffjournal.org
A simple square object (30 pixels by 30 pixels) is constructed. The resultant spatial frequency function is plotted both as a three-dimensional function and as intensity images (Figure 3, 4).
The real and predicted values of weft-warp densities belong to 19 different fabric types can be seen in Table I. It can be concluded that the designed image processing system can predict the densities with 97 % accuracy. TABLE I. Actual and Predicted Values of Warp-Weft Densities per cm at Different Fabric Types. Actual value
FIGURE 3. The square images object.
FIGURE 4. Fourier transform of the square object in Figure 3 plotted a)as a function, b) as an image.
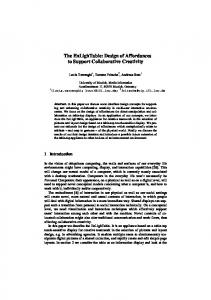
RESULTS AND DISCUSSION In conclusion, as can be seen from Figure 5, the highest frequency values for both vertical and horizontal directions give us the exact value of warp and weft densities.
Predicted value
Fabric types
Warp/cm
Weft/cm
Warp/c m
Weft/cm
Batiste
44
29
45,7
26,74
Jeans
38
30
37
28
Canvas
32
21
31,4
21,27
Madras
50
36
47,61
32,7
Damask
34
26
31,8
24,57
Coating
26
22
25,4
20
Velvet
26
23
28,9
21,7
Printed Cotton
38
30
40
31
Opal
40
26
42
27
Etamine
14
14
20
16
Flamel
24
12
23,2
15,4
Sailcloth
20
14
18,9
14,3
Oxford
48
42
49
41,6
Ottoman
64
16
66
13,8
Panama
12
10
11,7
9,6
Broadcloth
34
16
29,1
16,1
Serge
32
26
30
23,7
Fresco
24
20
24,9
18,7
Lama
44
22
44
22
The properties of the fabric types that were used in the experimental design can be seen below: Batiste: A thin plain-weave cotton or linen fabric; used for shirts or dresses. FIGURE 5. The average horizontal and vertical frequency spectrum of the image batiste.
Journal of Engineered Fibers and Fabrics Volume 9, Issue 1 – 2014
3
http://www.jeffjournal.org
fabric include coats, suits, dresses, upholstery, and draperies.
Jeans: A coarse durable twill-weave cotton fabric, which is normally dyed dark blue.
Panama: A kind of fabric made from acrylic/cotton blend fibers. It’s warm and durable. Panama Fabric has the barest trace of shrinkage and is very soft.
Canvas: A strong, durable, closely woven cotton fabric, which can be used for clothing or chairs or sails or tents.
Broadcloth: A densely textured woolen fabric with a lustrous finish.
Madras: Hand loomed Indian cotton fabric in plaids, checks, or stripes all colorfully intermingled Because the yarn is dyed with natural vegetable dyes, colors run together (bleeding), producing a muted effect The weave itself has many slubs and imperfections.
Serge: A fabric with a smooth hand that is created by a two-up, two-down twill weave. Fresco: A hot-weather fabric, but only available in dark colors/patterns.
Damask: A fabric of linen or cotton or silk or wool with a reversible pattern woven into it a table linen made from linen damask having a woven pattern; "damask table linens.
Lama: A light weight fabric for home decoration usage [13-16]. CONCLUSIONS In the present study, an image processing technique was designed to determine warp-weft densities in woven textile fabrics. For this reason, 19 different woven fabric samples were used in the experimental setup. From the vertical and horizontal frequencies of textile images the FFT analysis was performed. Results show that warp and weft densities were measured with the 97 % accuracy. This approach demonstrates that with the help of this method, the personal effort which is made while counting the densities can be been eliminated. Thus the loupe usage was removed. Additionally, this method quickens the textile production measurements and makes the process easier. This technique also can be embedded to a pattern design program.
Coating: A heavy fabric suitable for coats. Velvet: A closely woven fabric, originally of silk, now also of cotton or man-made fibers, with a thick short pile on one side. Printed Cotton: A fabric with a dyed pattern pressed onto it (usually by engraved rollers). Opal: A finely woven cotton fabric that has a slight sheen. Etamine: A soft cotton or worsted fabric with an open mesh; used for curtains or clothing etc. Flannel: Light to heavyweight plain or twill weave fabric with a napped surface can be made of cotton or wool the brushing process creates insulating air cells that provide more warmth than plain cotton.
ACKNOWLEDGEMENT The authors wish to acknowledge Ms. Zuhal IRS who is an undergraduate student in Marmara University for supplying the fabric samples to this research.
Sailcloth: A type of heavy canvas fabric used to make sails. Oxford: Soft, somewhat porous and rather stout cotton shirting weave gives a silk like finish, also made from spun rayon, acetate, and other man-made fibers Oxford also means a woolen or worsted fabric with a grayish cast.
REFERENCES [1] L. J. G., F. C., M. F. et al., “Linear flow detection in woven fabrics using model basedclustering,” Pattern recognition letters, vol. 18, pp. 1539-1548, 1997. [2] A. Abouelela, H. M. Abbas, H. Eldeeb et al., “Automated vision system for localizing structural defects in textile fabrics,” Pattern recognition letters, vol. 26, no. 10, pp. 14351443, 2005.
Ottoman: A tightly woven plain weave ribbed fabric with a hard slightly lustered surface The ribbed effect is created by weaving a finer silk or manufactured warp yarn with a heavier filler yarn, usually made of cotton, wool, or waste yarn In the construction, the heavier filler yarn is completely covered by the warp yarn, thus creating the ribbed effect End uses for this Journal of Engineered Fibers and Fabrics Volume 9, Issue 1 – 2014
4
http://www.jeffjournal.org
[3]
[4]
[5]
[6]
[7]
[8]
[9]
[10]
[11]
[12] [13] [14]
W. Yang, D. Li, L. Zhu et al., “A new approach for image processing in foreign fiber detection,” Computers and Electronics in Agriculture, vol. 68, no. 1, pp. 68-77, 2009. R. Ji, D. Li, L. Chen et al., “Classification and identification of foreign fibers in cotton on the basis of a support vector machine,” Mathematical and Computer Modelling, vol. 51, no. 11-12, pp. 1433-1437, 2010. T. M., P. T., T. M. et al., “Measuring yarn diameter using inexpensive optical sensors,” Procedia Engineering, vol. 5, pp. 236-239, 2010. V. Carvalho, R. M. Vasconcelos, F. O. Soares et al., “Yarn Diameter and Linear Mass Correlation,” Journal of Nondestructive Evaluation, vol. 28, no. 2, pp. 49-54, 2009. V. Carvalho, P. Cardoso, M. Belsley et al., “Yarn hairiness parameterization using a coherent signal processing technique,” Sensors and Actuators A: Physical, vol. 142, no. 1, pp. 217-224, 2008. A. Willems, S. V. Lomov, I. Verpoest et al., “Drape-ability characterization of textile composite reinforcements using digital image correlation,” Optics and Lasers in Engineering, vol. 47, no. 3-4, pp. 343-351, 2009. P. Potluri, I. Parlak, R. Ramgulam et al., “Analysis of tow deformations in textile preforms subjected to forming forces,” Composites science and technology, vol. 66, no. 2, pp. 297-305, 2006. N. Paulsson, and B. Stocklassa, “A real-time color image processing system for forensic fiber investigations,” Forensic science international, vol. 103, no. 1, pp. 37-59, 1999. S. J. L., Biosignal and Biomedical Image Processing, New York: Marcel Decker Inc., 2004. G. R., and W. R., Digital Image Processing, USA: Addison-Wesley, 1992. 22nd of September, 2011; www.seslisozluk.com. "Panama Fabric / Panama Cloth," 22nd of September, 2011; http://www.textilesindepth.com/index.php?p age=panama-cloth.
Journal of Engineered Fibers and Fabrics Volume 9, Issue 1 – 2014
[15]
"Fresco Fabric," 22nd of September, 2011; http://www.styleforum.net/t/108062/frescofabric-a-hot-weather-fabric-but-onlyavailable-in-dark-colors-patterns. [16] "Dahlia Lama Seafoam," 22nd of September, 2011;http://www.funkyfabrix.com.au/item_ 2871/Dahlia-Lama-Seafoam.htm. AUTHORS’ ADDRESSES Kazım Yildiz Volkan Yusuf Senyurek Zehra Yildiz Mustafa Sabri Ozen Marmara University Goztepe Campus Technical Education Faculty Department of Electronic Computer Education D412 Kadikoy, Istanbul, 34722 TURKEY
5
http://www.jeffjournal.org