Microeconomics is the study of the behavior of individual households, firms and
industries as well as ... Instead what is important is “opportunity cost” – what we
have to give up ...... comparative advantage will be adversely affected by free
trade.
3rd Edition, June 2005
Eric Doviak
Principles of Microeconomics
on the
Lecture Notes
Preface Microeconomics is the study of the behavior of individual households, firms and industries as well as the supply and demand relationships between producers and consumers. You might think of a household as a consumer, but households are also producers. For example, take a look at your kitchen: you take raw materials (meat, cheese, vegetables, eggs, salt and pepper) as well as capital (stove and frying pan) and your own labor to produce an omelet, which is demanded by you and members of your family. They may not pay you in money, but you’re compensated in other ways. Cooking an omelet for your family is a very simple example of an economic problem. So what’s the point? The point is that economics isn’t “all about money.” It’s about life. It’s about human behavior. In fact, economic analysis can be applied to almost any problem imaginable. For example, there is a branch of economics that studies the production of health and the demand for health. Notice that I wrote “health” and not “health care.” To take another example, economic analysis can also be used to analyze the war on drugs without ever mentioning the word “price.” Instead what is important is “opportunity cost” – what we have to give up when we make a choice. In some American cities, police officers are so busy preparing prosecutions that they don’t have time to respond to 911 calls. Why? Because the politicians chose to put as many people in jail as possible, they actually had to forgo law and order. Studying economics will help you understand the nature of trade-offs that you face in everyday life. If you spend more time studying economics, you’ll be less likely to make decisions that are as stupid as the ones our politicians have made and more likely to make rational decisions.
Page 2
Lecture Notes on the Principles of Microeconomics Eric Doviak 3rd Edition, June 2005
Table of Contents 4 10 11 13 17 22
Lecture 1: Introduction and Math Review Ƈ Homework #1A Ƈ Homework #1B – More Math Review Problems Ƈ What’s the difference between Marginal Cost and Average Cost? Ƈ Calculus Tricks Ƈ Homework #1C
23 32
Lecture 2: Production, Opportunity Cost and Relative Price Ƈ Homework #2
34 43
Lecture 3: Supply, Demand and Equilibrium Ƈ Homework #3
45 54
Lecture 4: Elasticity Ƈ Homework #4
57
Review for the Mid-term Exam
61 69 78 81
Lecture 5: Household Behavior and Consumer Choice Ƈ Examples of Income and Substitution Effects Ƈ Homework #5 Ƈ A Microeconomic Critique of the War on Drugs
86 93 98 102
Lecture 6: The Production Process: The Behavior of Profit-Maximizing Firms Ƈ Economic Thought on Land Value Taxation Ƈ Notes on Isoquants, Isocosts and the Memo on Land Value Taxation Ƈ Homework #6
104 111 113
Lecture 7: Short-Run Costs and Output Decisions Ƈ Why does a Firm Maximize its Profit where Marginal Revenue equals Marginal Cost? Ƈ Homework #7
114 120 122
Lecture 8: Costs and Output Decisions in the Long Run Ƈ Notes on the Zero Profit Result Ƈ Homework #8
124
Review for the Final Exam
Page 3
Lecture 1
Introduction and Math Review Eric Doviak Principles of Microeconomics
Helpful hints x x x x x
x
Economics doesn’t have to be difficult BUT... some people make it difficult for themselves. I did. If a model is unclear, don’t try to think of an example from the $10 trillion US economy. Instead, apply the model to a small rural village.
x
Most important part of any economic model are the:
ASSUMPTIONS x
x
x
Page 4
If you understand the assumptions of the model, you will understand the conclusions. You will NOT understand the conclusions, if you don’t understand the assumptions. WHEN READING, DON’T SKIP CHAPTERS!
Scope & Method of Economics Why should I study economics? x
To learn a way of thinking! Hopefully, you’ll learn to use three key concepts in your daily lives: o efficient markets o marginalism and o opportunity cost
Efficient markets x x x
Profit opportunities are rare because everyone is looking for them. Efficient markets eliminate profit opportunities immediately. Ex. You’ll never find a good parking space, because if there was a good one, it would already be taken before you got there.
Marginalism Average cost – total cost divided by quantity x x x
If I spend 300 hours preparing 30 lessons for you: You had better study! My average cost per lesson is 10 hours.
Sunk cost – costs that can no longer be avoided because they have already been “sunk” x If I teach this class again next semester, I will have already sunk 300 hours into preparation.
Marginal cost – cost of producing one more unit x Next semester I can recycle my notes, so my marginal cost per lesson will equal 75 minutes. x Compare that with my current 10 hours! Page 5
Opportunity Cost x x x
x x
We all face choices. Resources are “scarce.” We can’t spend more time or money than we have, so we have to give up one opportunity to take advantage of another. If I have a choice between earning $1000 per month by teaching this course OR earning $500 per month by working at McDonald’s, then: o It takes me one month to produce $1000 worth of teaching. o It takes me one month to produce $500 worth of burger flipping. Q: What’s my opportunity cost of teaching? A: Half a burger flipping per unit of teaching. one month $1000 of teaching one month $500 of burger flipping
one month per $1000 of teaching one month per $500 of burger flipping
$500 of burger flipping $1000 of teaching
1 burger flippings teaching 2
I’ll give a much, much better example in the next lecture.
Point plotting (X,Y): x the first point in a pair lies on the X axis (horizontal axis) x the second point in a pair lies on the Y axis (vertical axis) Let’s graph the following equation in red (square points):
y = –5x + 20 Connect points: (0,20), (1,15), (2,10), (3,5) & (4,0) y-intercept: x the value of y, when x = 0 x here it’s 20, because: 20 = (–5*0 ) + 20 slope: (we’ll get back to that) More examples: y = 4x + 5 (blue, round points) y = –2x + 15 (green, triangle points) Page 6
Math – tool of econ. analysis
equation: y = –5x + 20 y = 4x + 5 y = –2x + 15
slope: – 5 4 – 2
y-int: 20 5 15
Math – tool of econ. analysis
What is SLOPE? x
the change in y divided by the change in x
o o o o x x
y = –5x + 20 x increases from 1 to 2 y decreases from 15 to 10 slope: 10 �15 � 5 �5 2 �1 1 positive slope: x and y increase and decrease together negative slope: x and y increase and decrease inversely (when one rises the other falls)
x x
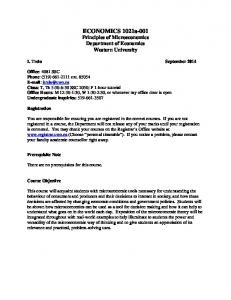
Why does curve slope up? When is avg. consumption greater than avg. income? How is this possible?
x
A statistical estimation of the relationship between avg. income and avg. consumption is: AC = 0.57*AI + 13,539
NB: in linear functions (such as the ones here) the slope equals the value of the parameter by the variable X.
Analyzing Graphs
where: AC = avg. consumption and AI = avg. income
x x
What’s the significance of the y-intercept ($13,539)? What’s the significance of the parameter next to the AI-variable (0.57)?
The graph illustrates relationship between average household income and average consumption expenditure. Along the 45 degree line, income equals expenditure. Page 7
AC = 0.57*AI + 13,539 marginal propensity to consume I’m using an example from macroeconomics, because some of you have already taken a macro course. If you haven’t … Don’t worry. We’re just reviewing basic algebra.
x
x x
If your boss increased your income from $31,000 to $32,000, how much more would you consume? o On average, you would consume an extra $570 worth of goods. o Put differently, if you were an average person, your expenditure on consumption goods would rise from $31,209 to $31,779. Every $1000 increase in income raises consumption by $570. Why? marginal propensity to consume = 0.57 (NB: that’s the slope of the line!)
x x
What if you got fired? How much would you consume? Your income would fall to zero, but you’d still consume $13,539 worth of goods. After all, you’ve got to eat!
x
When your income is less than $31,486 your expenditures on consumption goods exceed your income. (You run down your savings). When your income is more than $31,486 your income exceeds your expenditures on consumption goods. (You save some of your income).
x
A few more definitions AC = 0.57*AI + 13,539 x x
x
Y = C + I + G + (X–M)
Model – the formal statement of a theory, often presented using mathematical equations Variable – a measure that can change such as consumption or income o Dependent variable o Independent variable o In the example above, consumption depends on income. Parameters – values which remain constant in an equation (here: 0.57 and 13,539)
x
Ceteris paribus – “all else equal”
x
How does an increase in investment, I, affect national income, Y? To answer this question we must hold all other variables constant, while we determine the effect of investment alone.
x
Page 8
Micro vs. Macro x x
MICROeconomics Study of the decision-making of individuals, households and firms Study of distribution of wealth
x x
MACROeconomics Study of aggregates What factors affect: o Gross Domestic Product? o the price level? o the unemployment rate?
Positive vs. Normative Economics x x
Positive No judgements Just asking how the economy operates
x x x
Normative Makes judgements Evaluates the outcomes of economic behavior Policy recommendations
Economic policy x x
x
Positive – economic policy starts with positive theories and models to develop an understanding of how the economy works Then economic policy evaluates (normative) on the basis of: o Efficiency – Is the economy producing what people want at the least possible cost? (quantifiable) o Equity – Is the distribution of wealth fair? Are landlords treating low-income tenants fairly? (non-quantifiable) o Growth – Increase in total output of the economy. Note: efficiency gains lead to growth (quantifiable) o Stability – steady growth, low inflation and full employment of resources – capital and labor (quantifiable) And recommends (normative) courses of action to policy-makers (presidents, congressmen, etc.)
Page 9
Homework #1A problems #1–3, from Ch. 1, p. 23 of Case/Fair Principles…(6th ed.) 1. Graph each of the following sets of numbers. Draw a line through the points and calculate the slope of each line. 1 X 1 2 3 4 5
2 Y 5 10 15 20 25
X 1 2 3 4 5
3 Y 25 20 15 10 5
X 0 10 20 30 40
4 Y 0 10 20 30 40
X 0 10 20 30 40
5 Y 40 30 20 10 0
X 0 10 20 30 40
6 Y 0 10 20 10 0
X 0.1 0.2 0.3 0.4 0.5
Y 100 75 50 25 0
2. For each of the graphs in Figure 1 below, say whether the curve has a positive or negative slope. Give an intuitive explanation for the slope of each curve. Figure 1.
3. For each of the following equations, graph the line and calculate its slope. a. P = 10 – 2q (Put q on the X-axis) b. P = 100 – 4q (Put q on the X-axis) c. P = 50 + 6q (Put q on the X-axis) d. I = 10,000 – 500r (Put I on the X-axis) Page 10
Homework #1B More Math Review Problems 1. Graph these equations (placing Y on the vertical axis and X on the horizontal axis): x Y = 2X + 2 x Y = 4X + 2 Comparing the two equations, which is different: the slope or the Y-intercept? How is it different? Are the lines parallel or do they intersect?
2. Graph these equations (placing Y on the vertical axis and X on the horizontal axis): x Y = 2 + 2X x Y = 2 – 2X Comparing the two equations, which is different: the slope or the Y-intercept? How is it different? Are the lines parallel or do they intersect?
3. Graph these equations (placing Q on the vertical axis and P on the horizontal axis): x Q = 4 + 2P x Q = 2 + 2P Comparing the two equations, which is different: the slope or the Q-intercept? How is it different? Are the lines parallel or do they intersect?
4. Graph these equations (placing Q on the vertical axis and P on the horizontal axis): x Q = 4 – 2P x Q = 2 + 2P These two equations have different slopes and different Q-intercepts. Do the lines intersect? If so, can you find the value of P and Q at which they intersect?
X
Y(1st)
Y(2nd)
X
Y(1st)
Y(2nd)
P
Q(1st)
Q(2nd)
P
Q(1st)
Q(2nd)
If demand curves slope down and supply curves slope up, then which of these two equations resembles a demand curve? Which resembles a supply curve? 5. Solve these two equations for P. Then graph the new equations by placing P on the vertical axis and Q on the horizontal axis: x Q = 4 – 2P x Q = 2 + 2P Do the lines intersect? If so, can you find the value of P and Q at which they intersect?
Q
Page 11
P(1st)
P(2nd)
6. The Law of Demand says that consumers purchase more of a good when its price is lower and they purchase less of a good when its price is higher. Can you give that statement a mathematical interpretation? (Hint: Does price depend on quantity purchased? or does quantity purchased depend on price?) Is price an independent variable or a dependent variable? Is quantity purchased an independent variable or a dependent variable? What is the difference between a dependent variable and an independent variable? On which axis (the vertical or horizontal) do mathematicians usually place the independent variable? On which axis do mathematicians usually place the dependent variable? When economists draw supply and demand diagrams, they usually place price on the vertical axis and quantity purchased on the horizontal axis. Why is that “wrong”?
7. (A question about percentages) 0.750 = ______% 8. (A question about fractions)
2 = ______% 3
Page 12
Eric Doviak Principles of Microeconomics
What’s the difference between Marginal Cost and Average Cost? “Marginal cost is not the cost of producing the “last” unit of output. The cost of producing the last unit of output is the same as the cost of producing the first or any other unit of output and is, in fact, the average cost of output. Marginal cost (in the finite sense) is the increase (or decrease) in cost resulting from the production of an extra increment of output, which is not the same thing as the “cost of the last unit.” The decision to produce additional output entails the greater utilization of factor inputs. In most cases … this greater utilization will involve losses (or possibly gains) in input efficiency. When factor proportions and intensities are changed, the marginal productivities of the factors change because of the law of diminishing returns, therefore affecting the cost per unit of output.”
– Eugene Silberberg, The Structure of Economics (1990)
Let’s break Silberberg’s definition of marginal cost into its component pieces. First, he ascribes changes in marginal cost to changes in marginal productivities of factor inputs. (By factor inputs, he means factors of production, like labor and capital). So what is the marginal product of labor and how is it affected by the law of diminishing returns? Imagine a coal miner traveling deep underground to swing his pick at the coal face. The longer he swings his pick, the more coal he will produce, but it’s exhausting work, so if his boss were to require him to work a double shift, the miner wouldn’t double the amount of coal that he produces. To be more specific, let’s assume that the miner produces an amount of coal equal to the square root of the number of hours he works. The tonnage of coal that he produces is his “total product of labor (TPL).” So if he puts in zero hours, he produces zero tons of coal. If he puts in one hour he produces one ton. If he puts in two hours, he produces 2 1.41 tons of coal, etc. tons of coal hours 0 1 2 3 4
coal 0 1 1.41 1.73 2
hours 'coal 'hours – 1 0.41 0.32 0.27
If the miner increases the number of hours that he spends mining from one hour to two hours, his output of coal will increase by 0.41 tons. Increasing the miner’s hours from two to three hours only increases his output of coal by 0.32 tons however. Notice that the additional coal he produces per additional hour that he works diminishes. This is the law of diminishing marginal returns. Notice also that the table lists the ratio of the change in coal output to the change in the amount of hours worked. That’s the slope of the total product function, or the “marginal product of labor.” Page 13
Plotting the miner’s marginal product of labor against the amount of hours that he works shows the rate of output change at each amount of working hours. tons of coal hours 0 1 2 3 4
hours
coal 0 1 1.41 1.73 2
'coal 'hours – 1 0.41 0.32 0.27
We don’t need to measure the changes in the miner’s coal output in one hour increments however. In fact, economists are usually more interested in a continuous rate of change. Those of you who have taken a course in calculus should know that the continuous rate of change in output is simply the first derivative of the total product function with respect to the number of hours worked. For those of you who have not taken a course in calculus, imagine that we can measure the miner’s total output at each second in time. If we look at how much the miner’s output increases from one second to the next and divide that change by one second, we’ll have a good approximation of the first derivative. For example, one second is 1 360 of an hour or 0.002778 hours. If the miner works for exactly two hours, then he’ll produce 1.414214 tons of coal. If he works for exactly two hours and one second, then he’ll produce 1.415195 tons of coal. In other words, adding one second to a two hour workday increases his output of coal by 0.000982 tons. The marginal product of labor evaluated at two hours and one second is:
2.002778 � 2 0.002778
1.415195 � 1.414214 0.002778
0.000982 0.002778
0.353431 tons per hour
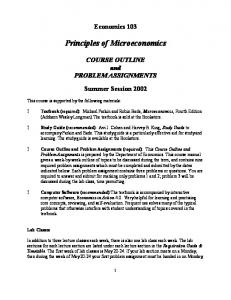
To see how successively smaller changes in units of time (by which output changes are measured) lead to closer and closer approximations to the first derivative, consider this graph of true marginal product (red), the change in output per half-hour change in work hours (green) and the change in output per one hour change in work hours (blue). A table of the data points in the graph is given on the next page. Now that you know what the “marginal product of labor” is, what do you think “marginal cost” is? It’s the change in total cost per unit change in output, calculated for an infinitesimally small change in output. Just as the marginal product of labor measures the slope of the total product of labor function, marginal cost measures the slope of the total cost function. Page 14
hours
coal
true MPL
0 0.5 1.0 1.5 2.0 2.5 3.0 3.5 4.0
0 0.71 1.00 1.22 1.41 1.58 1.73 1.87 2.00
infinite 0.71 0.50 0.41 0.35 0.32 0.29 0.27 0.25
'coal 'hrs.
'hrs. 0.5 – 1.41 0.59 0.45 0.38 0.33 0.30 0.28 0.26
'coal 'hrs. 'hrs. 1 – – 1 – 0.41 – 0.32 – 0.27
Notice also what happens when we sum the last two columns of the table above (i.e. the columns of 'coal 'hrs. ). The column listing a time interval of one hour sums to 2, which is exactly how many tons of coal are produced. The area under the marginal product curve equals total product because increasing the number of hours from zero to one yields one additional ton of coal per hour, increasing the number of hours from one to two yields 0.41 additional tons of coal per hour, etc. The column listing a time interval of half an hour sums to 4, which when multiplied by 0.5 hours also equals 2 (tons of coal), so once again the area under the marginal product curve equals total product. The column listing the true marginal product of labor sums to 3.1 plus infinity, which at first glance seems to contradict the results above, but keep in mind that the true marginal product is calculated using infinitesimally small intervals of time. So we’d have to multiply infinity plus 3.1 by the infinitesimally small intervals of time that we used to obtain the true marginal product to obtain 2 tons of coal. (In mathematical terms: we could integrate the true marginal product of labor from zero hours to four hours with respect to the number of hours the miner works to obtain 2 tons of coal). ƇƇƇ
Now that we understand the law of diminishing returns and the concept of marginalism, let’s reexamine Silberberg’s quote. He says that to produce more output, a firm must hire more factors of production (like labor or capital) and/or use them more intensively, but such increased utilization reduces the efficiency of those factors of production (due to the law of diminishing returns) and raises the marginal cost of output. For example, if the mining company only employs one miner and pays him a wage of $1 and that one miner is the only factor of production, then producing one ton of coal requires one hour of labor from the miner and costs a total of $1, but producing two tons requires four hours of labor and costs a total of $4. In this case, the marginal cost of increasing output from zero tons to one ton is $1 and the marginal cost of increasing output from one ton to two is: $4 – $1 = $3. So let’s examine a hypothetical firm’s total, average and marginal costs by assuming that it faces a fixed cost of $10 and its variable cost is given by: VC X 3 � 3X 2 � 4X , where X is the amount of output that it produces. Total cost is equal to fixed cost plus variable cost, so: TC X 3 � 3X 2 � 4X � 10 .
In the specification above, the firm’s variable costs increase as the firm produces more output (and decrease as it produces less), therefore marginal cost reflects changes in variable cost. By definition, the firm’s fixed costs do not change when it increases or decreases the amount of output it produces, therefore marginal cost does not reflect changes in fixed cost – because there are no changes in fixed cost. Page 15
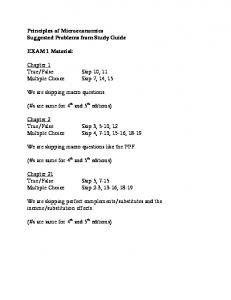
In the graph at right, I have drawn a total cost curve running from negative one units of output to four units of output. Now it should be obvious to you that a firm would not produce a negative output.
I drew the total cost function from negative one to better show the shape of the curve and because I’ll use negative one to approximate the marginal cost at zero units of output. The total cost curve depicted is everywhere increasing as output increases (i.e. is everywhere positively sloped), but it is not increasing at a constant rate. Initially total cost rises at a fairly rapid rate, but then the rate of increase slows, yielding a somewhat flat section. Finally, the rate of increase accelerates again. Since marginal cost is the rate of change in total cost (the slope of the total cost curve), the marginal cost curve will be U-shaped. TC
X 3 � 3X 2 � 4X � 10 'TC 'X
X
TC
VC
AC
–1 0 1 2 3
2 10 12 14 22
–8 0 2 4 12
– infinite 12 7 7 13
'X 1 – 8 2 2 8
4
42
32
10 1 2
20
If the firm faces a U-shaped marginal cost curve, then at low levels of output, it can increase the marginal productivity of its inputs by using them more intensively (a possibility I ruled out in the miner example), but at higher outputs, the firm confronts the law of diminishing returns and faces rising marginal cost. The firm also faces a U-shaped average cost curve. The firm’s average costs fall when it increases its production from zero to a moderate amount of output because its fixed cost is spread over a larger amount of output and (to a much lesser extent) because its average variable cost falls as inputs are used more efficiently (i.e. they yield a higher marginal product). At high levels of output, the firm’s average fixed cost approaches zero, but its variable costs rise rapidly due to the law of diminishing returns. At high levels of output, marginal cost exceeds both average variable cost and average cost, because the averages spread the rising variable cost over the total amount of output, whereas marginal cost reflects changes in variable cost over small intervals. Finally, notice that the sum of the entries in the column containing the firm’s marginal cost equals $32 – the variable cost. (Ignore the marginal cost of $8 that occurs when the firm produces zero units of output because it was calculated by increasing output from negative one to zero). It equals $32 because marginal cost examines changes in variable cost, so the sum of the marginal costs must equal variable cost at that level of output. Page 16
Calculus Tricks Calculus is not a pre-requisite for this course. However, the foundations of economics are based on calculus, so what we’ll be discussing over the course of the semester is the intuition behind models constructed using calculus. It’s not surprising therefore that the students who do better in economics courses are the ones who have a better understanding of calculus – even when calculus is not a required part of the course. So if you want to do well in this course, you should learn a little calculus. ƇƇƇ Many times throughout the course, we’ll be discussing marginalism – e.g. marginal cost, marginal revenue, marginal product of labor, marginal product of capital, marginal utility, marginal rate of substitution, marginal rate of transformation, etc. Whenever you see “marginal …” it means “the derivative of …” A derivative is just a slope. So, for example, let’s say labor is used to produce output x if TP stands for Total Production (quantity produced), x if L stands for Labor input and x if ' denotes a change, 'TP that’s the change in Total Production divided by the change in Labor. then if I write: 'L x It’s the slope of the total production function. x It’s the derivative of the production function with respect to labor input. x It’s the marginal product of labor (MPL).
So if you understand derivatives, you’ll understand the course material much better. ƇƇƇ a few preliminaries – exponents
You should recall from your high school algebra classes that when you see an exponent, it simply means multiply the number by itself the number of times indicated by the exponent. x
3
xxx x
x2 0
But what if you see the something like: x ? Well, that’s simply equal to: x
0
2 2 2
8
22
2 2
4
21
2
2
20
1
1
2�1
1 2 1 2 2 1 2 2 2
1 2 1 4 1 8
xxx
Now if you divide both sides of the above equation by x: x3 x
23
x1 x
x x
2� 2 2� 3
1
Page 17
16 2 8 2 4 2 2 2 1 2 12 2 14 2
24 2 23 2 22 2 21 2 20 2 2�1 2 �2 2 2
Similarly, x �1
x0 x
1 and x � 2 x
x �1 x
1x x
1 xx
1 x2
But what about x 0.5 ? That’s the square root of x : x 0.5
By the same logic as before: x � 0.5
1 . Ex. 9 � 0.5 x
.
x . Ex. 16 0.5 1 9
16
4
1 3
ƇƇƇ a few preliminaries – functions
You may have seen something like this in your high school algebra classes: f �x . This notation means that there is a function named “ f ” whose value depends on the value of the variable called “ x .” Some examples of functions in economics include: x The quantity of output that a firm produces depends on the amount of labor that it employs. In such a case, we can define a function called “ TP ” (which stands for Total Production) whose value depends on a variable called “ L ” (which stands for Labor). So we would write: TP �L . x
A firm’s total cost of producing output depends on the amount of output that it produces. In such a case, we can define a function called “ TC ” (which stands for Total Cost) whose value depends on a variable called “ Q ” (which stands for Quantity). So we would write: TC�Q .
x
A firm’s total revenue from selling output depends on the amount of output that it produces. In such a case, we can define a function called “ TR ” (which stands for Total Revenue) whose value depends on a variable called “ Q ” (which stands for Quantity). So we would write: TR �Q . ƇƇƇ derivatives
Now let’s return to the original purpose of these notes – to show you how to take a derivative. A derivative is the slope of a function. For those of you who saw f �x in your high school algebra classes, you may recall taking a derivative called “f-prime of x,” f c�x . What you were doing was you were finding the slope of the function f �x . You were finding how much the value of the function f �x changes as x changes. So let’s define the function: f �x 3x 2 and let’s look at how the value of f �x changes as we increase x by one unit increments. Once again, let ' denote a change.
x
f �x
0 1 2 3
0 3 12 27
'f �x 'x �� 3 9 15
true f c�x 0 6 12 18
The third column is our rough measure of the slope. The fourth column – entitled true f c�x – is the true measure of the slope of f �x evaluated at each value of x . The values differ greatly between the two
Page 18
columns because we are looking at “large” changes in x as opposed to the infinitesimally small changes described in the notes entitled: “What’s the Difference between Marginal Cost and Average Cost?” Why does it make a difference whether we look at small or large changes? Consider the following derivation of the slope of f �x : f c�x
'f �x 'x
f �x � 'x � f �x 'x
3�x � 'x 2 � 3x 2 'x
3�x � 'x �x � 'x � 3x 2 'x
3x 2 � 6x'x � 3�'x 2 � 3x 2 'x
�
3 x 2 � 2x'x � �'x 2 � 3x 2 'x
6 x'x � 3�'x 2 'x
6 x'x 3�'x 2 � 'x 'x
f c�x 6x � 3'x If we look at one unit changes in the value of x – i.e. 'x 1 – then the slope of f �x evaluated at each value of x is equal to 6 x � 3'x which equals 6 x � 3 since 'x 1 . If we look at changes in x that are so small that the changes are approximately zero – i.e.: 'x | 0 – then the slope of f �x evaluated at each value of x is approximately equal to 6 x and gets closer and closer to 6 x as the change in x goes to zero. So if f �x 3x 2 , then f c�x 6 x . Since we’ll be looking at infinitesimally small changes in x , we’ll stop using the symbol ' to denote a change and start using the letter d to denote an infinitesimally small change. ƇƇƇ calculus tricks – an easy way to find derivatives
For the purposes of this course, there are only three calculus rules you’ll need to know: x the constant-function rule x the power-function rule and x the sum-difference rule. the constant-function rule
If f �x 3 , then the value of f �x doesn’t change x as changes – i.e. f �x is constant and equal to 3. So what’s the slope? Zero. Why? Because a change in the value of x doesn’t change the value of f �x . In other words, the change in the value of f �x is zero. So if f �x 3 , then
d f �x dx
f c�x 0 .
Page 19
the power-function rule
Now if the value of x in the function f �x is raised to a power (i.e. it has an exponent), then all we have to do to find the derivative is “roll the exponent over.” To roll the exponent over, multiply the original function by the original exponent and subtract one from the original exponent. For example:
f �x 5 x 3 d f �x dx
15x 2
f c�x 15x 2
g �x 4 x1 2 d g �x dx
5x 3 o 3 5x 3�1
1
�1 1 12 2 4x o 4x 2
4 x
gc�x 2 x �1 2
2 x
2x �1 2
the sum-difference rule
Now, say the function you are considering contains the variable x in two or more terms. k �x 2x 2 � 3x � 5 if we define: f �x 2 x 2 then:
k �x
g�x �3x1
h �x 5
�3x
f �x � g�x � h �x 2x 2 � 3x � 5
Now we can just take the derivatives of f �x , g �x and h �x and then add up the individual derivatives to find k c�x . After all, the change in a sum is equal to the sum of the changes. d k �x dx
d f �x dx
�
d g �x dx
�
d h �x dx
k c�x
f c�x
�
g c�x
�
h c�x
k c�x
2 2x 2 �1 � 1 3x1�1 �
Page 20
0
4x � 3
Example #1 – Total Revenue and Marginal Revenue Total Revenue, denoted TR , is a function of the quantity of output that a firm produces, denoted Q , and the price at which the firm sells its output, denoted p . Specifically, Total Revenue is equal to the amount of output that a firm sells times the price. For example, if the firm sells 20 widgets at a price of $5 each, then its Total Revenue is $100. If a firm is in a perfectly competitive market, then the firm cannot sell its output at a price higher than the one that prevails in the market (otherwise everyone would buy the products of competitor firms). So we can assume that the price is constant. So what is a firm’s Marginal Revenue? It’s Marginal Revenue, denoted MR , is the derivative of Total Revenue with respect to a change in the quantity of output that the firm produces.
TR �Q p Q o MR
d TR �Q dQ
p
Example #2 – Total Product and Marginal Product of Labor
If a firm produces output using “capital” – a fancy word for machinery – and labor, then the quantity of output that it produces – i.e. its Total Product, denoted by TP – is a function of two variables: capital, denoted by K , and labor, denoted by L . TP �K, L K 0.5 L0.5 So what is the Marginal Product of Labor, denoted MPL ? Marginal Product of Labor is the change in Total Product caused by an increase in Labor input. Marginal Product of Labor is the derivative of Total Product with respect to Labor. Notice that we’re looking solely at the change in Total Product that occurs when we vary the Labor input. We’re not changing the capital stock, so when we take the derivative of Total Product with respect to Labor, we’ll hold the firm’s capital stock is fixed – i.e. we’ll hold it constant. TP �K, L K 0.5 L0.5 o MPL
d TP �K, L dL
Page 21
0.5 K 0.5 L� 0.5
Homework #1C 1. Find the derivative of each of the following functions: a. g �x 7 x 6 b. k �y 3y �1 3 �2 3 c. m�q q 2
d. h �w �aw 2 � bw �
c w
e. u �z 5
2. The Total Product of a firm, denoted by TP , depends on the amount of capital and labor that it employs. Denote capital by K and denote labor by L .
The Total Product function is given by: TP �K, L K 0.5 L0.5 . Throughout this problem, assume that the firm’s capital stock is fixed at one unit. a. Plot the Total Product function from zero units of Labor to four units of Labor. (Hint: Use graph paper if you have it). b. Now find the Marginal Product of Labor by taking the derivative of the Total Product function with respect to Labor. c. Plot the Marginal Product of Labor from zero units of Labor to four units of Labor.
3. The Total Cost function of a firm depends on the quantity of output that it produces, denoted by Q .
The Total Cost function is given by: TC�Q Q 3 � 6Q 2 � 18Q � 6 . a. Plot the Total Cost function from zero units of output to five units of output. (Hint: Use graph paper if you have it).
b. Does the Total Cost function ever slope downward? Or is it strictly increasing? c. Now find the Marginal Cost function by taking the derivative of the Total Cost function with respect to the quantity of output that the firm produces. d. Plot the Marginal Cost function from zero units of output to five units. e. Does the Marginal Cost function ever slope downward? Or is it strictly increasing? f. If the Total Cost function never slopes downward, then why does the Marginal Cost function slope downward over some ranges of output?
Page 22
Lecture 2
Production, Opportunity Cost and Relative Price Eric Doviak Principles of Microeconomics
The Economic Problem x
What will be produced? o Basic needs: food, clothing, shelter, etc. o Non-essentials: fish tanks, televisions, etc. o Capital goods: machinery, tools, human skills, etc. to produce more in the future
x
How will it be produced? o What resources are available? o How should labor and capital be allocated the production of each of the various products?
x
Who will get what is produced? o How should the products be allocated to the members of society – individuals, businesses, government, etc.? Page 23
Comparative Advantage This is one of the very few economic principles which is undeniably true, but is not obvious to intelligent people. x
The US has a comparative advantage in the production of a good, if the opportunity cost of producing that good is lower in the US than it is in other countries. o Opportunity cost – how much of one good you have to give up in order to gain more of another. o Unit labor requirement – amount of labor 1 hour 0.5 hour needed to produce one unit of a good. Ex. If I page 2 pages type 2 pages of notes per hour, then my unit labor requirement (to type one page) is half an hour per page.
x x x x
Countries gain from trade, if they specialize in producing the goods in which they have a comparative advantage, although there may be distributional effects to consider.
Comparative Advantage x x
Colleen can cut 12 logs a day or gather 10 bushels of food a day Bill can only cut 5 logs a day or gather 8 bushels a day Bill’s opportunity cost
Colleen’s opportunity cost x of cutting logs: 1 day 12 logs 10 bushels 0.83 bushels 1 day 12 logs log 10 bushels
x of cutting logs: 1 day 5 logs 8 bushels 1.6 bushels 1 day 5 logs log 8 bushels
x of gathering food: 1 day logs 12 logs 10 bushels 1.2 bushel 1 day 10 bushels 12 logs
x of gathering food: 1 day logs 5 logs 8 bushels 0.625 bushel 1 day 8 bushels 5 logs
x
Colleen has a comparative advantage in cutting logs because her opportunity cost of cutting logs is less than Bill’s.
x
Bill has a comparative advantage in gathering food because his opportunity cost of gathering food is less than Colleen’s. Page 24
x x x
Colleen has a comparative advantage in cutting logs. Bill has a comparative advantage in gathering food. Colleen has an ABSOLUTE advantage in the production of BOTH goods, but she has a COMPARATIVE advantage in the production of only ONE good (cut logs).
Relative Price x x x
If Colleen and Bill valued logs and food equally, then they would trade logs for food at a one-to-one ratio. If you prefer to think in terms of dollar values: o let the price of logs be one dollar per log: $1/log o let the price of food be one dollar per bushel: $1/bushel so that: o
the relative price of logs is one bushel per log: $1/log
o
the relative price of food is one log per bushel: $1/bushel 1 log
$1/bushel $1/log
1 bushel log bushel
Colleen’s Specialization Æ Cutting Logs x
A person (country) should specialize in producing a good if its opportunity cost is less than the relative price of that good.
o
o
Colleen should specialize in logs because her opportunity cost of cutting logs is less than the relative price of logs. By contrast, Bill should not cut logs because his opportunity cost of cutting logs is greater than the relative price of logs.
Colleen's opp. cost of logs 0.83 bushels log
�
rel. price of logs 1 bushel log
�
Bill's opp. cost of logs 1.6 bushels log
Colleen’s Gains from Trade x
By specializing in cutting logs and trading her logs for food, Colleen gains more food (per day of work) than if she gathered food herself. 12 logs *1 bushel 1 day 1 log
12 bushels 1 day Page 25
!
10 bushels 1 day
Bill’s Specialization Æ Gathering Food x
A person (country) should specialize in producing a good if its opportunity cost is less than the relative price of that good.
o
o
Colleen should not gather food because her opportunity cost of gathering food is greater than the relative price of food. By contrast, Bill should gather food because his opportunity cost of gathering food is greater than the relative price of food.
Colleen's opp. cost of food 1.2 logs bushel
!
rel. price of food 1 log bushel
!
Bill's opp. cost of food 0.625 logs bushel
Bill’s Gains from Trade x
By specializing in gathering and trading his food for logs, Bill gains more logs (per day of work) than if he cut logs himself. 8 bushels * 1 log 1 day 1 bushel
8 logs 1 day
!
5 logs 1 day
Moral of the Story x x x x
Even though Colleen can produce both goods more efficiently, she gains by specializing in logs (the good in which she has a comparative advantage) and trading her logs for food with Bill. Moral: America gains by trading with less developed countries. Even though Bill is less efficient at producing both goods, he gains by specializing in food (the good in which he has a comparative advantage) and trading his food for logs with Colleen. Moral: less developed countries gain by trading with America.
Lower Productivity Æ Lower Wage x x
Recall the dollar prices of each good: $1/bushel and $1/log o Colleen produces 12 logs per day, so her wage is $12 per day. o Bill produces 8 bushels per day, so his wage is $8 per day. This is why the Malaysians who made your sneakers, receive a much lower wage than you do. They’re less productive. Page 26
econ. data for 15 of the largest underdeveloped countries, 2001 GDP per Human Exports as Imports as country cap. at PPP Dev. Index % of GDP % of GDP Mexico $ 8,430 80.0 % 27.5 % 29.8 % Brazil $ 7,360 77.7 % 13.2 % 14.2 % Thailand $ 6,400 76.8 % 66.0 % 59.4 % Philippines $ 3,840 75.1 % 48.6 % 51.7 % Turkey $ 5,890 73.4 % 33.7 % 31.3 % China $ 4,020 72.1 % 25.5 % 23.1 % Iran $ 6,000 71.9 % 20.7 % 18.5 % Vietnam $ 2,070 68.8 % 54.6 % 57.0 % Indonesia $ 2,940 68.2 % 42.3 % 34.9 % Egypt $ 3,520 64.8 % 17.4 % 22.1 % India $ 2,840 59.0 % 13.5 % 14.1 % Bangladesh $ 1,610 50.2 % 15.4 % 21.5 % Pakistan $ 1,890 49.9 % 18.0 % 19.3 % Nigeria $ 850 46.3 % 43.3 % 34.4 % Ethiopia $ 810 35.9 % 15.1 % 29.8 % correlation matrix
GDP per cap. at PPP Human Dev. Index Exports as % of GDP Imports as % of GDP
GDP per Human cap. at PPP Dev. Index 1.000 0.847 1.000 0.062 0.353 –0.024 0.245
Exports as Imports as % of GDP % of GDP
1.000 0.939
1.000
sources: World Development Indicators (2005); Human Development Report (2003)
Trading Up x x x
Of the countries in the table above, the ones which have the highest levels of human development, are generally the ones that engage in more international trade. the Human Development Index is positively correlated with:
o o
a country’s share of exports in GDP a country’s share of imports in GDP
the correlations are not perfect, but they are significant
moral of the story x x x x
Countries gain from trade, if they specialize in producing the goods in which they have a comparative advantage, although there may be distributional effects to consider:
o o
workers who are not working in the sector where the country has a comparative advantage will be adversely affected by free trade ex. in America steel workers, textile workers and farmers are adversely affected by trade Page 27
Production Possibilities Frontier x
PPF – all combinations of goods that can be produced if resources are used efficiently. One can produce at or below the PPF, but not above it.
In one day, Colleen can: x cut 12 logs or gather 10 bushels x or produce a combination, such as: 6 logs and 5 bushels.
In one day, Bill can: x cut 5 logs or gather 8 bushels x or produce a combination, such as: 2.5 logs and 4 bushels.
Slope of the PPFs (above) is: –1*opp. cost of gathering food
Gains from Trade x
Add a red line whose slope represents the relative price: 1 log
bushel
If Colleen specializes in cutting logs: x she can trade some of her logs for bushels of food and x consume a combination that exceeds any combination that she could produce on her own.
If Bill specializes in gathering food: x he can trade some of his bushels of food for logs and x consume a combination that exceeds any combination that he could produce on his own.
Page 28
Production Function Quantity produced is a function of capital and labor: Q = f (K, L) x x x
If you have one unit of kapital (for example, one stove in a kitchen), and you keep increasing number of workers (labor) at that machine the quantity produced will increase but at a decreasing rate o o
because the workers start to get in each other’s way “too many cooks in the kitchen”
x PPF represents:
o all the possible combinations of goods (and services) o that can be produced, o if resources are used efficiently.
x Production possibilities are constrained by amount of labor and capital in the economy. x Cannot produce above PPF x If we shift labor from production of X and into production of Y, o less X will be produced o more Y will be produced
x PPF summarizes opportunity cost of all such shifts. x If resources are not used efficiently o labor unemployment, o inefficient management
x the economy is producing at a point below the PPF. Page 29
Q = f (K, L) This production function is drawn for a fixed amount of capital.
Production Possibilities Frontier
Cuba’s Ten Million Ton Sugar Harvest x x x
In the 1960s, Cuba produced about 6 to 7 million tons of sugar a year, which was sold primarily to countries in the Soviet bloc. Beginning in 1969, Cuban dictator Fidel Castro sent hundreds of thousands of urban workers into the fields in an effort to produce 10 million tons of sugar in 1970. Ultimately, Cuba missed its goal and only managed to produce 8.5 million tons – the largest harvest in Cuban history.
What were the effects on Cuban economy? For simplicity, assume that before the plan: x Cuba produced 6 million tons of sugar and 5 million tons of "everything else" x relative price of sugar was one ton of everything else per ton of sugar, else , Cuba traded 2 million tons of x at a relative price of 1 everything sugar x
sugar for 2 million tons of everything else and consumed 4 million tons of sugar and 7 million tons of everything else
massive disruptions in the Cuban economy Since Cuba allocated all of its production to sugar, it produced at the "sugar corner" of its PPF. At that corner, the opportunity cost of producing sugar exceeds the relative price of sugar. For simplicity, let's pretend that Cuba: x succeeded in producing all 10 million tons of sugar, but didn't produce anything else else , Cuba traded 6 million tons of x at a relative price of 1 everything sugar x
sugar for 6 million tons of everything else and consumed 4 million tons of sugar and 6 million tons of everything else
So (in this example) Cubans consumed the same amount of sugar, but their consumption of everything else fell from 7 million tons to 6 million tons – a 15 percent decrease.
Page 30
sweet it wasn’t
Q: Would a 15 percent decrease in consumption of everything else a massive disruption in the economy? A: If you could consume the same amount of sugar that you did last year, but your consumption of everything else fell 15 percent, would you be happy?
lesson from Cuba’s experiment x x x
a country should produce at the point along its PPF, where the opportunity cost of producing a good (ex. sugar) equals the relative price of that good Cubans suffered because their country produced at a point where the opportunity cost of producing sugar exceeded the relative price of sugar Similarly, had Cuba allocated all of its resources to producing “everything else” and produced no sugar it also would have suffered o o
because at such a point, the opportunity cost of producing everything else would have been greater than the relative price of everything else (from the opposite perspective…) because at such a point, the opportunity cost of sugar would have been less than the relative price of sugar
Why did Bill and Colleen completely specialize in one good?
x
x
A country should completely specialize in the production of one good o ONLY if the relative price of that good is greater than the country’s opportunity cost of producing it at every point along the PPF o Bill and Colleen’s opportunity cost was constant all along their PPFs the PPF I drew for Cuba assumes increasing opportunity cost –
i.e. Cuba’s opportunity cost of producing sugar increases as it produces more sugar Page 31
Homework #2
problems #3 and 8 from Ch. 2, p. 41–42 of Case/Fair Principles…(6th ed.) and a few of my own problems 3. Kristin and Anna live in the beach town of Santa Monica. They own a small business in which they make wristbands and potholders and sell them to people on the beach. Kristen can make 15 wristbands per hour, but only 3 potholders. Anna is a bit slower and can make only 12 wristbands or 2 potholders in an hour. output per hour Kristin Anna Wristbands 15 12 Potholders 3 2 a. For Kristin and for Anna what is the opportunity cost of a potholder? Who has a comparative advantage in the production of potholders? Explain. b. Who has a comparative advantage in the production of wristbands? Explain. c. Assume that Kristin works 20 hours per week in the business. If Kristin were in business on her own, graph the possible combinations of potholders to wristbands that she could produce in a week. Do the same for Anna. d. If Kristin devoted half of her time (10 out of 20 hours) to wristbands and half of her time to potholders, how many of each would she produce in a week? If Anna did the same, how many of each would she produce? How many wristbands and potholders would be produced in total? e. Suppose that Anna spent all 20 hours of her time on wristbands and Kristin spent 17 hours on potholders and 3 hours on wristbands. How many of each would be produced? f. Suppose that Kristin and Anna can sell all their wristbands for $1 each and all their potholders for $5.50 each. If each of them worked 20 hours per week, how should they split their time between wristbands and potholders? What is their maximum joint revenue. Do this too! Think about problem 3.f. using different relative prices, i.e. How should Kristin and Anna optimally allocate their time if the price of potholders was $4? if it was $5.50? and if it was $7? What is their maximum joint revenue in each case?
Do this too! Suppose that the simple society of Greenville can produce rice and beans. Suppose also that the Greenville’s production possibilities frontier is given by the equation:
1 PPF : rice 18 � beans 2 2 a. Placing beans on the horizontal axis and rice on the vertical axis, graph Greenville’s PPF. rice . Using the Calculus Tricks you learned in the first b. Suppose the relative price of beans is: 2 beans lecture, find the quantities of rice and beans that Greenville should produce at that relative price. rice . Should Greenville produce more or less c. Now suppose the relative price of beans rises to: 4 beans rice? Should Greenville produce more or less beans? What quantities of rice and beans should Greenville produce at that relative price? d. At what relative price of beans should Greenville specialize in the production of beans and produce no rice at all? Page 32
8. A nation with fixed quantities of resources is able to produce any of the following combinations of bread and ovens:
loaves of bread (millions) 75 60 45 30 15 0
ovens (thousands) 0 12 22 30 36 40
These figures assume that a certain number of previously produced ovens are available in the current period for baking bread. a. Using the data in the table, graph the ppf (with ovens on the vertical axis). b. Does the principle of "increasing opportunity cost" hold in this nation? Explain briefly. (Hint: What happens to the opportunity cost of bread -- measured in number of ovens -- as bread production increases?) c. If this country chooses to produce both ovens and bread, what will happen to the ppf over time? Why? Now suppose that a new technology is discovered that allows twice as many loaves to be baked in each existing oven. d. Illustrate (on your original graph) the effect of this new technology on the production possibilities curve. e. Suppose that before the new technology is introduced, the nation produces 22 ovens. After the new technology is introduced, the nation produces 30 ovens. What is the effect of the new technology on the production of bread? (Give the number of loaves before and after the change).
Do this too!
In the story of Colleen and Bill on p. 28–29 of Case/Fair Principles…, there’s an error. The book says Bill and Colleen produce logs and bushels of food at the following rates:
food (bushels) fuel (logs)
Production per day Colleen Bill 10 8 10 5
The book also says that Bill and Colleen value bushels of food and logs equally, so that the price of one bushel equals the price of one log. x
x x
Despite what is written, o Bill gains from trade with Colleen, but o Colleen doesn't gain from trade with Bill. o However, she doesn’t lose by trading with Bill. Why doesn’t Colleen gain from trade? Leaving opportunity costs unchanged, how can the story be rewritten, so that both Bill and Colleen gain from trade?
Hint: How does the assumption that Bill and Colleen value bushels of food and logs equally prevent Colleen from gaining from trade (given the production rates given above)? Page 33
Lecture 3
Supply, Demand and Equilibrium Eric Doviak Principles of Microeconomics
Demand x How many TV sets do you have in your house? x One in the kitchen, one in the bedroom, one in the living room .... x Back in the 1950’s, most families only had one TV, if they had one at all. x Q.: Why do families have so many more TV sets today? x A. # 1: They’re cheaper.
If price of TV sets rises, then, ceteris paribus, the quantity of TV sets demanded will fall, and vice versa.
Page 34
Demand x Q.: Why do families have so many more TV sets today? x A. # 2: Families’ real incomes are larger. x An increase in income changes relationship between price and quantity demanded. x Demand curve shifts out (up and right).
When income rises, but the price of TV sets doesn’t change (i.e. ceteris paribus), there’s more demand for TV sets at every price level.
Movement along Demand Curve vs. Shift of Demand x
Movement along: Only if there is change in the good’s price (shift of supply curve)
Shift of demand, due to changes in: x Income x Accumulated wealth x Tastes and preferences (ex. fewer smokers)
x x
Prices of other goods Expectations (of future income, wealth and prices)
Income – a flow – sum of all earnings (wages, salaries, profits, interest payments, rents, etc.) in a given period of time Wealth – a stock – total value of what household owns minus what it owes Substitutes – when price of good X rises, demand for good Y rises (ex. cigs & rolling tobacco) Complements – when price of good X rises, demand for good Y falls (ex. pasta & sauce) Page 35
Market Demand Sum of all individual demand curves (sum of all individual quantities demanded at each price)
price $4 $2
quantity demanded by: A B C 4 + 0 + 4 8 + 3 + 9
market demand = 8 = 20
Supply x x x x x x
x
If you were offered a job for $3 an hour, how many hours a week would you work? You wouldn’t take a job that pays so little. At $50 an hour, how many hours a week? 40, 50, 60 hours? At $100 an hour, how many hours a week? 40, 50, 60 hours? There’s a limit to how much you can work in a week. Ceteris paribus – ex. if there’s very high inflation, increase in wage reflect inflation and therefore will not increase output (hours worked) Page 36
An increase in price – wage is the price of labor – will ceteris paribus increase the quantity of labor supplied and vice versa.
Firm Supply Total Cost: TC = FC + VC x Fixed costs (FC) – repayment of loans, lump sum taxes, etc. x Variable costs (VC) – labor, raw materials, electricity, etc. Average Cost: AC = AFC + AVC x Average fixed cost (AFC) decreases as output increases x Average variable cost (AVC) increases as output increases (at least at higher output levels) Marginal Cost (MC): x Rate of change in total costs from extra unit of output x Is the supply curve when MC > AC
Movement along Supply Curve vs. Shift of Supply Movement along: x
Only if there is a change in the good’s price (shift of demand curve) Shift of supply,
due to changes in: x Costs: o wages o dividend payments o raw materials x Technology o more productive machines o increased efficiency with which firm uses its inputs into its production Page 37
Market Supply Sum of all individual supply curves (sum of all individual quantities supplied at each price)
price $4 $2
quantity supplied by: A B C 30 + 10 + 25 10 + 5 + 10
market supply = 65 = 25
Market Equilibrium Excess Demand x The absolutely must-have Christmas present x Parents bid up the price of the present, some parents drop out of the market x Factories increase production and ask higher price x Shortage eliminated – “price rationing” Page 38
At equilibrium there is no natural tendency for further adjustment.
Market Equilibrium Excess Supply x Car sales at the beginning of a recession
o Think back to end-2001 o Every other ad on TV/radio was a car commercial
x Buyers know of excess supply, offer lower prices and increase quantity demanded
x Automakers decrease
At equilibrium there is no natural tendency for further adjustment.
production and accept a lower price
Changes in Equilibrium Fall in Supply x Some crops freeze x Initially at equilibrium x After freeze, market supply is more limited x Supply curve shifts in x Shortage at initial price x Price bid up, some drop out of market x Other farms harvest more of frozen crop x New equilibrium Page 39
Scalpers x How much would you pay for the best seats in the house? x Limited supply x Tickets priced below market equilibrium x Excess demand at list price x Arbitrage – whoever obtains tickets at list price, can profit by reselling them
Stupidity If “pro–” is the opposite of “con–,” what’s the opposite of “progress?”
Price ceilings x 1974 – OPEC imposed oil embargo on US x Supply shock x Congress imposed a price cieling on the price of gasoline x Result: long lines and shortage of gasoline
Ways to beat a cieling 1. Queuing – be first in line 2. Favored customers – bribe the retailer 3. Ration coupons – buy coupons from friends
Page 40
What is the Cost of Stupidity? x
x x x x x x
Since a car owner has to wait in line to buy gas, he/she doesn’t just pay the fixed price of gas (denoted: p ). For simplicity, we’ll assume that p is the price per tank of gas. He/She also faces a time cost. But what is the value of time? An hour of an individual’s time is equal to his/her hourly wage (denoted: w ). So if he/she has to wait t hours for a tank of gas effective price he/she pays per tank is: p � wt . qty. demanded at effective price equals qty. supplied at fixed price
Excise Tax x
Now let’s say the government imposes a tax, IJ , on sales: o It could be a sales tax of 8.375%. If so: IJ p 8.375% o It could be a fixed dollar amount – e.g. IJ $2 per gallon of gas o Or it could be a FICA (Social Security) tax on wage income. If so, the wage is the “price” of labor and: IJ wage 15%
x
Again, consumers pay an effective price, p � IJ , which: o is greater than market equilibrium price, p * o is greater than price that producers receive, p Government collects revenue equal to the dollar amount of the tax times the quantity sold
x
Page 41
Tariff x
x
x
x
When US imports good, domestic demand exceeds domestic supply Imposition of tariff drives a wedge between world price and domestic price After tariff imposed, domestic producers can sell more and charge higher price for their product Consumers however pay higher price and cut qty. demanded
x
Page 42
Government receives revenue from tariff
Homework #3
problem #1 from Ch. 3, p. 71 of Case/Fair Principles…(6th ed.) problem #4 from Ch. 3, p. 79 of Krugman/Wells Microeconomics (1st ed.) problem #7, a–c from Ch. 4, p. 98 of Case/Fair Principles…(6th ed.) and one of my own problems 1. Illustrate the following with supply and demand curves: a. In 2000, the economy expanded, increasing the demand for labor and pushing up wages. b. During the year 2000, cranberry growers produced an enormous crop; as a result the price fell from $55 a year earlier to $42. c. As more people bought home computers during the 1990s, the demand for access to the Internet increased sharply. At the same time, new companies like Erol’s began to enter the Internet-access market, competing with older more established services such as America Online. Despite a massive increase in demand, the price of access to the Web actually declined. d. Before economic reforms in the countries of Eastern Europe, regulation held the price of bread substantially below equilibrium. When reforms were implemented, prices were deregulated and they rose dramatically. As a result, the quantity of bread demanded fell and the quantity of bread supplied rose sharply. e. The steel industry has been lobbying for high taxes on imported steel. Russia, Brazil and Japan have been producing and selling steel on world markets at $22 per metric ton, well below what equilibrium would be in the United States with no imports. If no imported steel were permitted in the country, the equilibrium price would be $35 per metric ton. (Show supply and demand curves for the United States assuming no imports; then show what the graph would look like if U.S. buyers could purchase all the rolled steel that they wanted from world markets at $22; show the quantity of imported steel.) On March 3, 2000, the Federal Trade Commission voted 5 to 1 not to impose high import duties (taxes) on imported steel.
4. Show in a diagram the effect on the demand curve, the supply curve, the equilibrium price, and the equilibrium quantity of each of the following events. a. The market for newspapers in your town. Case 1: The salaries of journalists go up. Case 2: There is a big news event in your town, which is reported in the newspapers b. The market for St. Louis Rams cotton T-shirts. Case 1: The Rams win the national championship. Case 2: The price of cotton increases. c. The market for bagels. Case 1: People realize how fattening bagels are. Case 2: People have less time to make themselves a cooked breakfast. d. The market for the Krugman and Wells economics textbook. Case 1: Your professor makes it required reading for all of his or her students. Case 2: Printing costs are lowered by the use of synthetic paper.
(continued on the next page) Page 43
7. Suppose that the world price of oil is $16 per barrel, and suppose that the United States can buy all the oil it wants at this price. Suppose also that the demand and supply schedules for oil in the United States are as follows: price ($ per barrel) 14 16 18 20 22
U.S. quantity demanded 16 15 14 13 12
U.S. quantity supplied 4 6 8 10 12
a. On graph paper, draw the supply and demand curves for the United States. b. With free trade in oil, what price will Americans pay for their oil? What quantity will Americans buy? How much of this will be supplied by American producers? How much will be imported? Illustrate total imports on your graph of the U.S. oil market. c. Suppose the United States imposes a tax of $4 per barrel on imported oil. What quantity would Americans buy? How much of this would be supplied by American producers? How much would be imported? How much tax would the government collect?
Do this too!
Suppose that the market demand for hamburgers is given by: Q D 10 � p and that the market supply is given by: QS 2 � p , where p is the price of a hamburger.
a. What is the equilibrium price of hamburgers? What is the equilibrium quantity of hamburgers supplied and demanded? b. Solve the market demand equation and solve the market supply equation for price. This yields the inverse market demand function and the inverse market supply function. c. Graph the inverse market demand and inverse market supply functions, placing quantity on the horizontal axis and price on the vertical axis. Do they intersect at the point corresponding to the equilibrium price and equilibrium quantity? d. Now suppose that the government imposes an excise tax of $2 per hamburger. What is the new quantity of hamburgers supplied and demanded? Hint: At what quantity is the inverse supply curve $2 higher than the inverse demand curve? e. What is the new effective price that consumers pay per hamburger? What is the new price that producers receive per hamburger?
Page 44
Lecture 4
Elasticity Eric Doviak Principles of Microeconomics
Shape of the Demand Curve x When prices change, change in quantity demanded depends on shape of demand curve x Consumer 1 has a very elastic demand curve x Consumer 2 has a very inelastic demand curve x Elasticity often depends on the good in question: o Elastic: education, alcohol o Inelastic: gas, food, cigarettes, electricity Page 45
Shape of the Supply Curve x When prices change, change in quantity supplied depends on shape of supply curve x Producer 1 has a very elastic supply curve x Producer 2 has a very inelastic supply curve x Elasticity often depends on the good in question: o Elastic: soft drink vendors on a hot day at the beach o Inelastic: housing, labor
slope can be misleading x x
x
Slope can be misleading because it depends on the units of measurement For example, if the price of a British Pound is 2 U.S. Dollars per British Pound, then the demand curve for milk is twice as steep if measured in dollars instead of pounds
If we focus on a ratio of percentage changes, we can eliminate the confusion caused by differences in the units of measurement Page 46
What is elasticity? x x
it’s a unit-free measure of responsiveness the own price elasticity of demand measures the ratio of a percentage change in quantity demanded of good X to a percentage change in the price of good X
İ x x x
% - age ǻQ % - age ǻP
ǻQ Q ǻP P
ǻQ P ǻP Q
notice that the component ǻQ corresponds to the slope of a
ǻP demand function such as: QD 10 � 2P , in which case: ǻQ �2 ǻP ǻQ is also the inverse of the slope of the demand curve (when we ǻP plot price on the vertical axis and quantity of the horizontal axis) the component P corresponds to the current price of the good and Q
the quantity that consumers buy at that price
Milk Example – Dollars vs. Pounds x
As illustrated in the graphs of British and American demand for milk, the demand relationships are: QD, America 10 � PU.S Dollar
x
QD, Britain 10 � 2PBritish Pound
therefore: ǻQD, America �1 ǻPU.S. Dollar
x
If QD, America QD, Britain 6 , then: PU.S Dollar 4
x
and
PBritish Pound 2
So the own-price elasticities of demand in each country must be: İU.S.
ǻQD, America PU.S. Dollar ǻPU.S. Dollar QD, America
İU.S. � 2 3
x
ǻQD, Britain �2 ǻPBritish Pound
İBritain
ǻQD, Britain PBritish Pound ǻPBritish Pound QD, Britain
İBritain �2/3
How much less milk would be demanded in each country if the price rose 1% in each country? 0.67% less Page 47
Why elasticity is so useful İU.S. � 2 3
x x x x x
How much less milk would be demanded in each country if the price rose 1% in each country? 0.67% less Now this result may seem trivial, but that’s the point! You want an easy way to make comparisons. You don’t want to have to convert U.S. Dollars into British Pounds or gallons into liters, etc. So for example, if I told you that: o o
x x
İBritain �2/3
own-price elasticity of demand for gasoline is –0.5 and own-price elasticity of demand for restaurant meals is –2.3
which is more responsive to changes in price? The demand for gasoline or the demand for restaurant meals? the demand for restaurant meals – because for a one percent increase in price, the quantity of restaurant meals demanded falls over four times more than the quantity of gasoline demanded does
Now let’s say you’re selling cream cheese … x
If there are many other companies selling cream cheese, then how responsive will the demand for your cream cheese be to the price? o very responsive o you’d face a very elastic demand – since small changes in the price of your cream cheese would induce consumers to buy your competitors’ cream cheese
x
If you raised your price, your revenue would fall dramatically.
x
Now let’s say you have few competitors in the cream cheese industry and a large group of people are cream cheese addicts. o demand for your cream cheese would not be very responsive to price o you’d face a very inelastic demand If you raised your price, the quantity of cream cheese that you sell would fall, but your revenue would not. Instead your revenue would increase due to the higher selling price and weak demand response.
x
NB: I have only mentioned revenue, not profit! Profit is the difference between your total revenue and your total cost. Page 48
Own-Price Elasticity of Linear Demand
– < İ < –1
İ = –1
–1J@@4@@@� ���� ����������>J@4@@@4�� ����� ��� ���� ��>J@@@����� ����$ ������� ���������7� ����� ��
��
��������� ����� ������>�K4@@@#�� �� 5��� ���'��� �������� ���� ���###�6��� ������ �������*�����4��� �� ��
��������� ����� �������� ������ >�@@@#� �� F����� � �� �������������� ����������L�� ����� ��� ������� ���� ���� �����������* � ���������� ���� �� ��� L�� ����� �� ��� �������*�������� ������������ ����� ��� ��� ����� �� ��#�8������ ��� ���* � ��� ��� �� � �� ��>J@@@4�� ����� ��������� ����������� �������*�������� ������>K@@@� ����� ��������� ��� ������ �� �����*�������� ������>�K4@@@#�� �� � �������� ���� �������� � ���###�6��� ������ �������*�����4��� �� ��
��������� ����� �������� ������ >�@4@@@#� �� 8������ ������ ��� ���������������� �� ������������� ���������4��� ����� ��������� �������*������ �� ������>�@@@� �� ��� ����� ��#�/����Q �����4����� ���������������� ����4��� ��� ���������������� R� ��� ��U�>�@@@������ ����������*������������ ����������#������ ���� ��� ��������*��� ��� ������� �� * � ������ �������*�������� ���� �� ��#� �� � ������������� �������� �������� �� ����� �������� �������*������ ���������������������� ��� �������� ���������� ��V�������� ����������*����������� ������������#� Page 93
�� SRUWIROLR�DOORFDWLRQ� �� 5������'������ ��� ��������� ������������� �� ���� �������� ��������� ����������#�8 � �� ��������� ���� ��� �� ��� ������� ����������Q
�������� � �������Q
�� ��� ��� ��������� ����V��������#� �� �'��������������� ���������4�� ����������� ���������������'�� �� ���� ��� ��� ������������ ��������� ��� �� >�#�� ��� �����������*�������� �� ��������*������������#�� �� � ��������� ����� ���� ��� ���� ��� � � ����������������� ��� ���*������� � ��� �#��'����������� �� ��� � ��� ����*������������� �� ������ ���������� ������� ��� ��������� ���� ������R� ����� ��#U� �� 8�����'��� ���� '���� ��������� ��� ��������� �� ������������������������ �� ����Q
���������#�2��� �� � ��� �������@��������������� �� ���� ���� ��� �� ���� ������X��������� ��� �#�Y �� ��������� ����� �� �;� � ��������� �� �� �� ������ ��4���� �;�Z� '����������� ������ �����'�#� �� 5������'��� ���� � ������ �� �� �����X@������������� ����� ������� ����������� � ��@������������ ��4�� ����� � ������ ����������� � �X������������ ��#�Y �� ��������� ����� �� �;�5������� ���4���� ������������ *�� � ��� ������ ��4������ '��� �� ������������ � #� �� � ��� ��������4���� �;�� �� �@������� ����������� � ��@� ����������� ��� ���>X������� ����������� � �X������������ ��#�\#\"� ����� �� ������ ����� ������� �������� ��� � �X������������ ����� ������>[#[[#�� �� �@���� ���L��� ������ ��� ��� ������� ������� ��� �� �����X@��������� ���� ����� ������� ����������� � ��@������������ ��#� �� �
J 94 Page
� ������������ ������������� ������ ���� ��� ����������������� ������ ���R�����������4U���������� �� �� ���� ����� ����������� ������������� ���������*��� ������ ����� �������� ���� ��4����� ������� ��� ��� �������� � ������������ ������ ��������� ���� ��#� � UHOHYDQFH�RI�SRUWIROLR�DOORFDWLRQ�WR�ODQG�YDOXH�WD[DWLRQ� �� 6��� ��������4��� '������� ��������������� �������������� ������ ������ � ��������� ��� ������������� ��
���� �������� ��������� ����������#�Z� '������� �������������]�R ����� ���� �������������������* ������ � ���* � ��� � ����;U� �� &��������� ����� ������� ����������Q
�������� � �������Q
�� ��� ��� ��������� ����V��������#�� �� &��������� ��� ������� ������ ��������������4� �� ������ ����� ���������� ������������� ���������*��� �� ���� ����� ��������� � ������L���������� ��� ��� ��������� �����#� �� � ������������ �������$� ��������� �� �������7�� �������� ��� ���� ��������������� �� �� ��������� ���� �� �� � ��������������#������������������� ����� ��� ��� ���*��������� ����� ��* � ������ ��4���������� �� � ��� �������������� ������������ ��� �#�� ���'������ ������ ��� ��������L� �R� ��3����U�� ���� ��������� ������� ���������*��� ������ ��� �#� �� ��������������������� �� ���� �������� ������������ ������*��
�'������������L�� ��� ���� ��� �#�$R/ ��� �U� � ��� ������ ���� � ���������� �������7#� �� F����������� ������ ��*�4�� �� � �� ����� ��� � � ����� �� ������ ������ ��4����������� �� ����� �� � ����� ������� �� ���������� ��� ���� ����������������� �� �����$� ���� �������� ���� �������� ��7#� �� � �� �� �������� �� ������ *��������� ����� ���� ����� ������������ ������ ��R����� ������������� �� ���� ��U��������#�� �� ����� � ����������� ������ �����*����������4���'�� ���� ����������� ������������������� ������ ������ ��� � ����������� ��������� ����������� ������������ ��� ��� �� ����������#����� ���� ����� ������������ �� ���� ��4�� ��������������������� � ��� ��'��� �� ����� ����'�������� �������� ����������� ���� � ������ � ������������� ������ ��#� �� � ��� �������� ������ ��� ���� ��� �#� �� ����� �� ���� ������ ����� ������� ���������4��� ���� ����� ������������� � � � �����������>�@@@� � ���� 4�� ������� �� ���� �� ���������� �X@� � ������������ ��� �����������4��� ���� ���������� ������� ������ � � � �����������>X@@�� � #������ �� ���� �� ���������� ��@@@� � �������4��� ������ *����� � ���*��������� ����� �� � ������ �������� � � ���� ����'����� ������������� � � � ������������ � � ������ ��>J@@� ����� #� �� /����Q �����4�� ��� ��$���� ���� ��4�� �� � �������7� ��������� ����� ���� ����� ���#�� ������������ ����
���� �� ��������� �������� � ����������� ����������������#� �� 8���� ���4������ ��������� ������� ������4��� ����������� ����������� ��* � �4�� ��� � � ������� �� �����*��������������� ����� ����� �������� ���#�&��� ������ ��������� ����� ������ ������ ������ � � ������� ��� ������������ ��������� ����������� ��* � ��$� �� 4������ ���4����� ����� ������� ��� �7#���4�
��������� ����������������� ����� �����4��� ������� ��� ������� ��^�� � ������4��� ���� ������������� ��� � ������ ��* � �4�� �����'��������� �� � � �� ������ ��_� � [ 95 Page
�� ��� ���� ��������� ����� ���� ����� ���#������ �� �� �� �������*������� ������ 4��� ���� ����� ���� ��������������� ��/���� ��� ����� �������>�@4@@@� ��� �#���� ���*����� ��� � �� ������� ��� ������ � ����� ��4����'��������������� �������������������>�@4@@@� �� ���_� �� 5������'����� ���������������'������ �������������� �� ���� �������� ��������� ����������4�� ����� �� ������ � ���������� ����� ���� ����� ���#� �� ���� ��/������� ������ ����� ��� ������ ��� �������� ����� ��� ������ ��� �4�� ��������� ������� �������� � ��4�� ����� ��������� ������� ��� �����������#�� �� �������*��
�������� ���� ���� ��� ���������� ������������������� ��� ���� ��� �4�� ������������� ���� ���� ������������ ��� �� �������� ���� ���� ������������ ��� ������ ��������� �������� � � ������ �������� � ��� �Q
�#��������� ���� ����� ��� �� ��������� ������������* ���� ����� �������4������ ������ �������� ��* � ��L� � ����� ������� ��� �#� �� WKH�SUREOHP�ZLWK�ODQG�YDOXH�WD[DWLRQ� �� ���������'��������� ��������� ��� ���������������������� �������������� ��� ���� ��� �#�� ��������� � �� ������� ������������������ �������������� ��� ���� ��� �#�Z� ��������� �� ��� ����� ������������� ��� � � �#�� ������������ ������������������� �������������� ��� ���� ��� ����� ������ ������#� 0
MR1 = p1
when p = AVC Oper. Profit = 0
Shut Down!
Q
x
When total revenue exceeds total cost (p > AC), firm makes positive profits.
x
When total cost exceeds total revenue, but revenues exceed variable cost (AC > p > AVC), firm suffers losses, but its operating profit is still positive. It continues operating in the short-run, but exits industry in the long-run.
x
If revenues are less than variable costs (p < AVC), firm suffers operating losses. Total losses exceed fixed costs. To minimize losses firm shuts down. Page 115
$2000 Fixed Costs 0 Variable Costs $2000 Total Costs
$2000 + 1600 $3600
$1200
+
–$400 –$2400
$0 Total Rev ($1.50x800)
$2000 Fixed Costs + 1600 Variable Costs $3600 Total Costs
Oper. Profit/Loss –$2000 Total Profit/Loss
When TR < VC, the firm’s total loss is lower when it shuts down.
$800 –$1200 Profit/Loss
$2400 Total Rev (Q = 0)
losses minimized by shutting down (TR < VC) shut down operate at p = $1.50
Loss Minimization $0 Total Rev ($3x800) $2000 Fixed Costs 0 Variable Costs $2000 Total Costs
Oper. Profit/Loss –$2000 Total Profit/Loss
+
losses minimized by operating (TR > VC) shut down operate at p = $3 Total Rev (Q = 0) Fixed Costs Variable Costs Total Costs
Profit/Loss
Short Run Condition TR > TC Operating profit (TR VC) Operating loss (TR VC)
Short Run Decision P = MC: operate P = MC: operate (losses fixed costs) Shut down: (losses fixed costs)
Contract firms exit
Contract: firms exit
Long Run Decision Expand: new firms enter
Firm Decisions in the Short and Long Run
When TR > VC, the firm’s total loss is lower when it continues operating – in the short run.
Profits Losses Losses
Page 116
Short-Run Supply Curve of a Perfectly Competitive Firm x x x
In Lecture 3, I wrote that the marginal cost curve is the firm’s supply curve when MC > AC. That simplification is not strictly correct. The short-run supply curve of a competitive firm is the part of its MC curve that lies above its AVC curve. In the long-run, MC must exceed AC or firm will exit the industry.
Entry and Exit from the Industry x x
In the long run, firms can enter and exit. They enter the industry in response to profit opportunities:
o o
x
exit
SM
entry
shifting out the market supply curve and lowering the market price.
They exit when they make losses:
o o
p
contracting the market supply curve and raising the market price.
DM Q
Long-Run Costs: Returns to Scale x x x
x
x
In the short run, firms have to decide how much to produce in the current scale of plant (factory size is fixed). In the long run firms, have to choose among many potential scales of plant (they can expand the factory). Increasing returns to scale (or economies of scale), refers to an increase in a firm’s scale of production, which leads to lower average costs per unit produced. Constant returns to scale refers to an increase in a firm’s scale of production, which has no effect on average costs per unit produced. Decreasing returns to scale (or diseconomies of scale) refers to an increase in a firm’s scale of production, which leads to higher average costs per unit produced. Page 117
Long-Run Average Cost Curve x x
x
The Long-Run Average Cost (LRAC) curve shows the different scales on which a firm can operate in the long-run. Each scale of operation defines a different short-run. The Long-Run Average Cost curve of a firm: o is downward-sloping when the firm exhibits increasing returns to scale. o is upward sloping when the firm exhibits decreasing returns to scale. The optimal scale of plant is the scale that minimizes long-run average cost. LRAC
LRAC, SRAC, SRMC
SRAC SRMC SRMC SRAC SRAC SRMC
Q increasing optimal returns to scale scale
decreasing returns to scale
Long-Run Adjustments to Short-Run Conditions LRAC, SRAC, SRMC
pSR
p*
x x
In the short-run, firms A and B are SRAC LRAC breaking even. firm A firm B In the long run, SRMC SRAC SRMC firms producing at the optimal scale (like firm C) will force firms A and B SRMC to become more firm C SRAC efficient. (Firm C can profit at lower price). Eventually, all firms will produce at Q optimal the optimal scale. scale
In the long run, firms expand when increasing returns to scale are available (and contract when they face decreasing returns to scale). In the long run, the market price will be driven down to the minimum point on the LRAC curve and profits go to zero. Page 118
Long-Run Adjustment Mechanism The central idea behind the discussion of entry, exit, expansion and contraction is: x x
In efficient markets, investment capital flows toward profit opportunities. Investment – in the form of new firms and expanding old firms o will over time tend to favor those industries in which profits are being made, o and over time industries in which firms are suffering losses will gradually contract from disinvestment.
Page 119
Eric Doviak Principles of Microeconomics
Notes on the Zero-Profit Result In Lecture 6, I gave an example of a firm operating in a competitive industry that makes zero profit in the short-run, but I didn’t explain when such a situation would arise. Firms in competitive industries may make positive profits in the short-run, but – if there is free entry into the industry and firms face constant returns to scale over some range of output – then in the long-run, the firms’ profits will be driven to zero. one reason why profits go to zero in the long run Suppose that there is free entry into the industry in which my firm operates, that the technology I use is widely available and that my firm is making positive profits in the short run. Since I’m making positive profits, another person (call him John) will use the same technology that I am using to produce output. John will enter the industry, increase the market supply and lower the market price. This will reduce my profit, but if John and I are still making a positive profit, then yet another person (call her Jane) will enter the industry and use the same technology to produce output. Jane’s output will further increase market supply and lower the market price. This process will continue until there are no more profits to be made. Eventually, John, Jane and I will all be producing output at the minimum point along our long-run average cost curves – this corresponds to the point where our firms all face constant returns to scale.
case where p = $1.30 and where r = w = $0.53 X K L MPL p*MPL profit 17.32 20 13 0.44 0.58 5.06 17.76 20 14 0.42 0.55 5.09 18.17 20 15 0.40 0.52 5.10 18.57 20 16 0.39 0.50 5.09 18.95 20 17 0.37 0.48 5.05 case where p = $1.00 and where r = w = $0.53 X K L MPL p*MPL profit 14.74 20 8 0.61 0.61 -0.08 15.33 20 9 0.57 0.57 -0.02 15.87 20 10 0.53 0.53 0.00 16.39 20 11 0.50 0.50 -0.02 16.87 20 12 0.47 0.47 -0.06 case where p = $0.70 and where r = w = $0.53 X K L MPL p*MPL profit 11.70 20 4 0.97 0.68 -4.51 12.60 20 5 0.84 0.59 -4.41 13.39 20 6 0.74 0.52 -4.39 14.09 20 7 0.67 0.47 -4.42 14.74 20 8 0.61 0.43 -4.50
The table shows that the firm maximizes profit by employing labor up to the point where the wage equals the price times the marginal product of labor. (Here, capital is held fixed since this is the short-run). The graph corresponds to the table and shows that the firm maximizes its profit by producing up to the point where price (marginal revenue) equals marginal cost.
Page 120
returns to scale As we saw in Lecture 8, it’s assumed that firms have a U-shaped long-run average cost curve. At low output levels, firms face increasing returns to scale. At high output levels, they face decreasing returns to scale. At the minimum point on the long-run average cost curve, they face constant returns to scale. If a firm facing constant returns to scale doubles all of its inputs, then its output will exactly double. For example, if a firm’s production function is given by:
then if it doubles its inputs of capital and labor, its output doubles. 2X = (2K)2/3*(2L)1/3 = 22/3*K2/3*21/3*L1/3 2X = 2*K2/3*L1/3
X = K2/3*L1/3
Similarly, you can easily see that when a firm doubles all of its inputs, its output: x more than doubles when it faces increasing returns to scale x less than doubles when it faces decreasing returns to scale. increasing returns to scale:
decreasing returns to scale:
X = K2/3*L2/3 2X < (2K)2/3*(2L)2/3 < 22/3*K2/3*22/3*L2/3 2X < 24/3*K2/3*L2/3
X = K1/3*L1/3 2X > (2K)1/3*(2L)1/3 > 21/3*K1/3*21/3*L1/3 2X > 22/3*K1/3*L1/3
two more reasons why profits go to zero in the long run Since a firm facing constant returns to scale can double its output by doubling each of its inputs, then if it doubled its inputs and output, its profits would also double. Ȇ = p*X – w*L – r*K 2Ȇ = p*(2X) – w*(2L) – r*(2K) But if the firm can double its profit by doubling its inputs and output, then it could also quadruple its profit by quadrupling its inputs and output. So when exactly would a firm ever maximize its profit? The only reasonable assumption to make therefore is that the firm’s profits go to zero in the long run. (Two times zero is zero). There are three reasons why the profits of firms operating in competitive industries go to zero in the long run. The first reason was discussed above – as firms enter they drive down the market price to the point where no firm profits. Another reason is because at very high levels of output, a firm may encounter logistical difficulties. For example, it may have difficulty coordinating the activities of all of its plants. Coordination difficulties at high levels of output are simply an example of decreasing returns to scale. Finally, if the firm were lucky enough to face increasing returns to scale over all ranges of output, then it could always make ever higher profits by growing ever larger. Such a firm would eventually dominate its industry and become a monopolist – thus, the firm no longer operates in a competitive industry. Page 121
Homework #8 modifications of Problems 4, 5, 6, 9 and 11 from Ch. 9, p. 228-29 of Krugman/Wells Microeconomics (1st ed.) 4. Bob produces DVD movies for sale, which requires only a building and a machine that copies the original movie onto a DVD. Bob rents a building for $30,000 per month and rents a machine for $20,000 a month. Those are his fixed costs. His variable cost is given in the accompanying table.
qty. of DVDs 0
fixed cost total avg. $50,000 ––
variable cost total avg. $0 ––
1,000
$50,000
$5,000
2,000
$50,000
$8,000
3,000
$50,000
$9,000
4,000
$50,000
$14,000
5,000
$50,000
$20,000
6,000
$50,000
$33,000
7,000
$50,000
$49,000
8,000
$50,000
$72,000
9,000
$50,000
$99,000
10,000
$50,000
$150,000
total cost total avg. ––
marginal cost ––
a. Calculate Bob’s average variable cost, average total cost, and marginal cost for each quantity of output. b. There is free entry into the industry: anyone who enters will face the same costs as Bob. Suppose that currently the price of a DVD is $23. What will Bob’s profit be? Is this a long-run equilibrium? If not, what will the price of DVD movies be in the long run?
5. Consider Bob’s DVD company described in problem 4. Assume that DVD production is a perfectly competitive industry. In each case, explain your answers. a. What is Bob’s break-even price? What is his shut-down price? b. Suppose the price of a DVD is $2. What should Bob do in the short run? c. Suppose the price of a DVD is $6. What is the profit-maximizing quantity of DVDs that Bob should produce? What will his total profit be? Will he produce or shut down in the short run? Will he stay in the industry or exit in the long run? d. Suppose instead that the price of DVDs is $16. Now what is the profit-maximizing quantity of DVDs that Bob should produce? What will his total profit be now? Will he produce or shut down in the short run? Will he stay in the industry or exit in the long run?
6. Consider again Bob’s DVD company described in problem 4. a. Draw Bob’s marginal cost curve. b. Over what range of prices will Bob produce no DVDs in the short run? c. Draw Bob’s individual supply curve.
Page 122
9. The first sushi restaurant opens in town. Initially people are very cautious about eating tiny portions of raw fish, as this is a town where large portions of grilled meet have always been popular. Soon, however, an influential health report warns consumers against grilled meat and suggests that they increase their consumption of fish, especially raw fish. The sushi restaurant becomes very popular and its profit increases. a. What will happen to the short-run profit of the sushi restaurant? What will happen to the number of sushi restaurants in town in the long run? Will the first sushi restaurant be able to sustain its short-run profit over the long run? Explain your answers. b. Local steakhouses suffer from the popularity of sushi and start incurring losses. What will happen to the number of steakhouses in the long run? Explain your answer.
11. A new vaccine against a deadly disease has just been discovered. Presently, 55 people die from the disease each year. The new vaccine will save lives, but it is not completely safe. Some recipients die from adverse reactions. The projected effects of the inoculation are given in the accompanying table:
percent of the pop. inoculated 0 10 20 30 40 50 60 70 80 90 100
total deaths due to disease 55 45 36 28 21 15 10 6 3 1 0
total deaths due to inoculation 0 0 1 3 6 10 15 20 25 30 35
marginal benefit of inoculation ––
marginal cost of inoculation ––
“profit” of inoculation
a. What are the interpretations of “marginal benefit” and “marginal cost” here? Calculate marginal benefit and marginal cost per each 10 percent increase in the rate of inoculation. Write your answers in the table. b. What proportion of the population should optimally be inoculated? c. What is the interpretation of “profit” here? Calculate the profit for all levels of inoculation.
Page 123
Eric Doviak Principles of Microeconomics Review for Final Exam The final exam will cover Lectures 5, 6, 7 and 8 as well as the memos and notes that I gave you. The exam will require you to define some of the terms listed below and require you to solve some problems. The problems given below were taken from exams that I have given in the past. They are a supplement to the homeworks. They are NOT a substitute for the homeworks.
Terms to know x x x x x x x x x x x x
perfect competition perfect knowledge budget constraint indifference curve isoquant isocost gross complements gross substitutes perfect complements perfect substitutes utility relative price
x x x x x x x x x x x x
real income income effect substitution effect short run long run price taker total cost fixed cost variable cost average cost marginal cost total revenue
x x x x x x x x x x x
marginal revenue economic profit accounting profit total profit/loss operating profit/loss shutdown point entry into industry exit from industry returns to scale long-run average cost short-run average cost
Short answer questions on social “profit” The Americans with Disabilities Act (ADA) requires that institutions like Brooklyn College accommodate individuals with disabilities in such a manor that everyone will have equal access to all facilities. Issues of accessibility include physical entrances to buildings and classrooms as well as the technology that students use (e.g. computers must be fitted with audio output for students with visual impairments). Some interpret the ADA to mean that the disabled have a civil right to full parity in access to resources. Others complain about the costs. 1. 2. 3. 4. 5.
degree of parity 0% 10 % 20 % 30 % 40 % 50 % 60 % 70 % 80 % 90 % 100 %
total benefit 0 36 64 85 100 110 116 119 120 120 120
total cost 0 39 67 86 98 105 109 112 116 123 135
Does the total benefit of parity exhibit diminishing marginal returns? Explain your answer. When does the benefit of parity exceed the cost of parity? To find Brooklyn College’s optimal degree of parity, what condition should you look for? What is Brooklyn College’s optimal degree of parity? In the context of this model, why shouldn’t Brooklyn College strive for full parity? Page 124
Short answer questions on household behavior and consumer choice The scenarios below describe how my consumption of beer and wine changes when my income changes and/or when the price of one or both goods changes. For each scenario, say whether my consumption is affected by: x an income effect, x a substitution effect, x a combined income and substitution effect x or no effect. and explain why! Each scenario is independent of the previous ones and independent of successive ones. In each scenario, I initially consume 50 beers and 50 wines. My initial income is $200. The initial price of beer is $2 and the initial price of wine is $2. 1. The price of wine falls to $1. The price of beer rises to $3. I increase my consumption of wine to 80 wines and decrease my consumption of beer to 40 beers. 2. The price of beer and the price of wine both increase to $4. My income rises to $400. I continue to consume 50 beers and 50 wines. 3. The price of beer and the price of wine both rise to $4. I decrease my consumption to 25 beers and 25 wines. 4. The price of wine falls to $1. I increase my consumption of wine to 150 wines and decrease my consumption of beer to 25 beers. Demand Curves for Beer and Wine For the scenario above where my consumption of beer and wine is affected by a combined income and substitution effect: 5. Draw the initial budget constraint and indifference curve. Place beer on the vertical axis and wine on the horizontal axis. 6. Draw the substitution effect. Be sure to LABEL that substitution effect. 7. Draw the income effect. Be sure to LABEL that income effect. 8. Is wine a gross substitute for beer? OR is wine a gross complement to beer? 9. Draw the demand curve for beer and the demand curve for wine. If a demand curve shifts, then illustrate that shift. If there is movement along a demand curve, then illustrate that movement. ƇƇƇ
Short answer questions on profit-maximization and elasticity A firm in perfect competition faces a perfectly elastic demand for its product (i.e. they are price takers). In reality however, firms usually have some ability to set the price of their product. x What assumptions lead to the result that firms face perfectly elastic demand? x How might real life firm make the demand for its product less elastic? x How would a firm benefit from having a less elastic demand curve? (continued on the next page) Page 125
Short answer questions on perfect competition x x
Economists often talk about firms that operate in a perfectly competitive industry. Describe the three characteristics of a perfectly competitive industry. Discuss the three reasons why economists assume that firms in a perfectly competitive industry make zero profit in the long run. ƇƇƇ
Short answer questions on profit-maximization You are given the following data on a profitmaximizing firm’s production in the short-run (its capital stock is fixed). The quantity of output that it produces (Q) depends on the amount of capital (K) and labor (L) it employs. The firm must pay rent on its capital stock at a rate of about $2 per unit, so its total rent bill is $1000.
Q
K
L
MPL
309.02
500
73
--
310.08
500
74
311.13
500
75
312.17
500
76
313.20
500
77
314.22
500
78
315.23
500
79
It also must pay a wage rate of $5 per unit of labor.
316.23
500
80
Calculate the marginal product of labor for each output level. (NB: the marginal product of labor is the change in output per unit change in labor).
317.22
500
81
318.20
500
82
Up until what point does a profit-maximizing firm hire labor? (Hint: the answer is in Lecture 6) If the firm can sell all of its output on a perfectly competitive market at a price of $5 per unit, then how much should it produce? How many units of labor should it employ? Using your answers to the previous two questions, what will the firm’s profit be? Could it maintain this profit in the long-run? Why or why not?
Page 126