Jul 23, 2018 - Abstract. This paper explains the method used in the segmentation challenge (Task. 1) in the International Skin Imaging Collaboration's (ISIC) ...
Lesion segmentation using U-Net network arXiv:1807.08844v1 [cs.CV] 23 Jul 2018
Adrien Motsch1 , Sébastien Motsch2 , and Thibaut Saguet3 1,3
Virtual Expertise, Clinique pasteur, Toulouse (France) 2 Arizona State University, Tempe (USA) July 25, 2018 Abstract
This paper explains the method used in the segmentation challenge (Task 1) in the International Skin Imaging Collaboration’s (ISIC) Skin Lesion Analysis Towards Melanoma Detection challenge held in 2018. We have trained a U-Net network to perform the segmentation. The key elements for the training were first to adjust the loss function to incorporate unbalanced proportion of background and second to perform post-processing operation to adjust the contour of the prediction.
1
Introduction
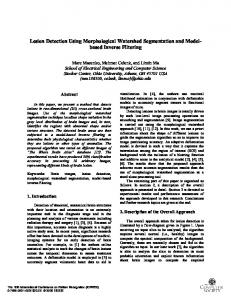
Segmentation is an important task to highlight zone of interests in medical images. In the ISIC 2018 challenge, the goal is to perform lesion boundary segmentation. To perform the segmentation, we have chosen to use a U-Net architecture [2] as it is known to perform well in medical image and without a large data-set. The details of the training is explained below and an example of mask generation is given in figure 1. Our data was extracted from the ISIC 2018: Skin Lesion Analysis Towards Melanoma Detection grand challenge data-sets [3, 4].
2 2.1
Methods Pre-processing
Before the training of the U-Net network [2], we first pre-processed the data-set. The very first statistic consisted in estimating the average pixel by estimating the
2.2
Training
2
Original image
ground truth
prediction
Figure 1: Example of segmentation (image ISIC_0000009.jpg from the training set 2018): the original image is on the left, in the middle the mask manually generated (’ground truth’), and on the right the prediction of our network based on the U-Net architecture. proportion of each color ( hRed, Green, Bluei = (0.708, 0.582, 0.536)) (red is slightly more prominent) and the standard deviation of the data-set (0.0978, 0.113, 0.127). This information was used in the training to re-center the training set. Another important information was the average proportion of the mole in the image which was estimated as: prop. mole =
#pixels ground truth = 0.214. #pixels in image
(2.1)
Masks represent in average only 21% of the image. The loss function was modified to even this ratio. Lastly, we also estimated the position of the mole inside the image. As expected, moles are more likely present in the center (see fig. 2-left). This information can be used as a prior for a Bayesian approach (not used here).
2.2
Training
For the training of the U-net network, we used the cross entropy as loss function and the Adam optimizer to update the parameters. Learning rate was set-up as 10−4 and reduced when the loss function was not decaying. The evolution per epoch of a typical training is given in figure 2-right. The orange curve gives the evolution of the so-called Jaccard index used to rank the method. Usually dataaugmentation methods were used (random flipping and image rotation). The code has been implemented using PyTorch.
2.3
Post-processing
The U-net gives a two scores for each pixel (scores s0 for the background and s1 foreground). These scores (s0 , s1 ) are then transformed into probability (p0 , p1 ) via
2.4
Results
3
average mask (normalized)
probability
Evolution of loss function and Jaccard index Loss Jaccard index learning rate (×10 4)
1.2
(pixels)
1.0 0.8 0.6 0.4 0.2 0.0
(pixels)
0
10
20
30 epochs
40
50
Figure 2: Left: Probability that a pixel is part of a mole for the all training set. The probability at the center is around p = .9 and close to zero at the boundary (p ≈ .005). Right: Evolution of the loss function (blue) and Jaccard index (orange) per epochs. softmax function:
es0 es 1 , p = . (2.2) 1 es0 + es1 es 0 + e s 1 The mask is then taken as the pixel with probability p1 higher than .5. However, we find out that the masks can be further improved using several post-processing methods on the scores (s0 , s1 ). First, we apply a Gaussian filter on both scores (σ = 5). Plotting the difference ∆s = s1 − s0 (see fig. 3-left), we observe three levels: at the boundary the difference is below (∆s < −15), at the center where the mole is, the values are around ∆s > 5, and finally the normal skin the values are in between −10 and 0. The histogram of all these values ∆s (regardless of their position on the image) is given in fig. 3-right. The threshold separating ’skin’ to ’mole’ seems to be around ∆s∗ = 2.5. We use the Otsu algorithm [1] to estimate automatically this threshold. p0 =
2.4
Results
Our method score a Jaccard index of .75 over various test set. For the validation test, the network has a score of .71 due to the metric used (scores below .65 are considered zero). Acknowledgments Authors would like to thank Thomas Laurent and Xavier Bressan for fruitful suggestions. S. Motsch thanks Renate Mittelman, Salil Malik and people at research computing (ASU) for their support during the computation.
REFERENCES
4
scores
background skin
proportion
threshold
(pixels)
(pixels)
mole
scores
Figure 3: Distribution of the score (foreground - background, i.e. ∆s = s1 − s0 ) returns by the U-net network. Rather than taking a zero threshold to determine the mask, we first estimate the threshold separating distribution of scores (Otsu method).
References [1] Nobuyuki Otsu. A threshold selection method from gray-level histograms. IEEE transactions on systems, man, and cybernetics, 9(1):62–66, 1979. [2] Olaf Ronneberger, Philipp Fischer, and Thomas Brox. U-net: Convolutional networks for biomedical image segmentation. In International Conference on Medical image computing and computer-assisted intervention, pages 234–241. Springer, 2015. [3] Philipp Tschandl, Cliff Rosendahl, and Harald Kittler. The HAM10000 Dataset: A Large Collection of Multi-Source Dermatoscopic Images of Common Pigmented Skin Lesions. arXiv preprint arXiv:1803.10417, 2018. [4] Eduardo Valle, Michel Fornaciali, Afonso Menegola, Julia Tavares, Flávia Vasques Bittencourt, Lin Tzy Li, and Sandra Avila. Data, depth, and design: learning reliable models for melanoma screening. arXiv preprint arXiv:1711.00441, 2017.