177 PROCEEDINGS OF THE SCIENTIFIC CONFERENCE QUALITY AND LEADING INNOVATION´2014 KOŠICE – HRADEC KRÁLOVÉ, SEPTEMBER 19 – 20, 2014
LESSON LEARNED FROM USING INTERACTIVE TRAINING SOFTWARE FOR STATISTICAL PROCESS CONTROL DOI: 10.12776/QALI.V1.#14
PETER BOBER
ABSTRACT Purpose: The Statistical process Control (SPC) is sometimes not well understood among industrial practitioners. Therefore, there are attempts to use simulation software for training. This paper describes an evaluation of using SPCSim, web-based Control Charts simulator which enables individuals to attain knowledge and skills through personal or hands-on experiences. Simulator is presently used in teaching of the university degree subject “Statistical Process Control”. Methodology/Approach: Based on experiences with teaching SPC and using SPC techniques in the industry, the simulation software SPCSim was designed to address education challenges. First, the learning objectives were worked out. Then the software specification was created based on the learning objectives. Software platform was chosen with regard to future utilisation in web environment cooperation. Questionnaire was used to evaluate achieved results. Findings: The practical experience shows wide acceptance of the selected method. Running charts that respond to interaction from the user are interesting and keep the attention on the subject. Some drawbacks are mentioned, among them practical issues about the simulation control, simulation speed and platform dependence. Certain drawbacks result from chosen software platform which was HTML/CSS/JavaScript. Research Limitation/implication: The designed software can be used “as is”. However, full potential will be achieved by developing cooperative learning concept that is subject to additional research resources. Originality/Value of paper: SPCSim is originally designed software. Findings are based on one semester teaching experience and students response in the questionnaire.
ISBN 978-80-7435-483-0 (GAUDEAMUS, HRADEC KRÁLOVÉ) ISBN 978-80-553-1815-8 (TECHNICAL UNIVERSITY OF KOŠICE, KOŠICE)
178 PROCEEDINGS OF THE SCIENTIFIC CONFERENCE QUALITY AND LEADING INNOVATION´2014 KOŠICE – HRADEC KRÁLOVÉ, SEPTEMBER 19 – 20, 2014
Keywords: engineering education; statistical process control; control charts; web-based learning; simulation; learning by doing.
1
INTRODUCTION
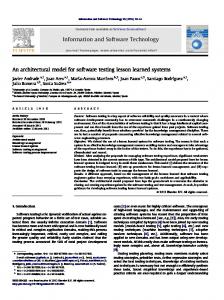
It is a long time that Dr. W. Shewhart created the concept of statistical control in the 1920s. His control charts are standard tools successfully applied to a wide range of production processes. As a basic tool of Statistical Process Control (SPC), Shewhart control charts are taught in many university courses and other training programs. Even though, a large effort is given to research other and more complicated types of control charts (see overview in Bersimis, Psarakis and Panaretos, 2007) the Shewhart Control charts are quite simple to understand. Despite user simplicity of control charts many authors (e.g. McConnell, Nunnally and McGarvey, 2010) highlight the pitfalls and mistakes in their use. The responsible person especially in small firms may lack the necessary knowledge of the pitfalls. Let us show an example from industry. Figure 1 shows the output from the hydraulic press that cuts three steel laminations for rotor and three laminations for stator of the motor in one cutting cycle.
Figure 1 – Output troughs of hydraulic press for motor laminations (source: student project, author: Róbert Krupinský) There is separate output trough for each lamination. Quality control personnel randomly select and measure four to six rotor and the same amount of stator lamination for measurement of several parameters each hour and record data to a spreadsheet to the same column. Even such person finished at least one university course on Statistics and one Quality control course, he/she is not aware that each channel has different statistics because lamination is produced by different part of the cutting tool. The reader can surely find similar cases of error in data processing from his experience. Out of that one can conclude that some learning skills was not achieved during study time.
ISBN 978-80-7435-483-0 (GAUDEAMUS, HRADEC KRÁLOVÉ) ISBN 978-80-553-1815-8 (TECHNICAL UNIVERSITY OF KOŠICE, KOŠICE)
179 PROCEEDINGS OF THE SCIENTIFIC CONFERENCE QUALITY AND LEADING INNOVATION´2014 KOŠICE – HRADEC KRÁLOVÉ, SEPTEMBER 19 – 20, 2014
From our academic experience results following: • Mathematics and especially Statistics and Probability is becoming less popular among students. • There is increasing difficulty to motivate students and keep their attention. A possibility to eliminate the above-mentioned deficiency is a practical activity called “Learning by doing”, the process within which individuals attain knowledge and skills through personal or hands-on experiences (Sabadka, 2005). Learning by doing can be costly, the more so, a more complex the systems involved is (Zgodavova, Kosc and Kekäle, 2001). Therefore, simulation is used to make training cheaper. Any knowledge with high probability of being successfully implemented is mostly attained either through personal experience or with the use of simulations, simulators and other visual aids which are already well-established in education. Another way is using case studies supported by pictures and video recordings of industrial processes, which also attract the attention of students. Such case studies can be a part of the simulation (Tošenovský, 2010). Experiments and simulation have been continually used in explaining different aspects of process control for many years. Symphony Technologies offers at its web pages simulation software for well-known Deming’s Red Bead and Funnel experiments as well as SPC Training Simulator. Deming’s Red Bead experiment shows that mechanical sampling may distort the process average of coloured and white beads. One coloured beads can occur more frequently in selection because of mechanical differences of coloured beads from the white ones (Symphony Technology, 2014a). Deming’s Funnel Experiment Simulator (Symphony Technology, 2014b) shows the undesirable effects of adjusting a process when not required. Frequent adjustment induces more variation in the process than would not occur if a random cause process is left alone. SPC Training Simulator (Symphony Technology, 2013), that is a software replacement of mechanical Quincunx model that drops balls over number of pins. It can be effectively used to demonstrate the concept of variation visually, and control charts. Levinson Productivity Systems develops simulation software for SPC training. They claim that “This interactive training program is designed to teach production workers how to read and interpret statistical process control charts in an hour or even less.” (Levinson Productivity Systems, 2014). Complex software solutions for real-time Statistical Process Control is a different rank of software. It can collect data from any source, monitor processes using real-time SPC charts, and produce reports (e.g. DataNet Quality Systems, 2014). Such software is, of course, too complex to be effectively used in education.
ISBN 978-80-7435-483-0 (GAUDEAMUS, HRADEC KRÁLOVÉ) ISBN 978-80-553-1815-8 (TECHNICAL UNIVERSITY OF KOŠICE, KOŠICE)
180 PROCEEDINGS OF THE SCIENTIFIC CONFERENCE QUALITY AND LEADING INNOVATION´2014 KOŠICE – HRADEC KRÁLOVÉ, SEPTEMBER 19 – 20, 2014
Therefore, the demand for SPC simulator still exists for students and professionals in vocal training. This article describes the SPC simulator SPCSim designed for the web environment and provides experience with using this simulator in teaching of the university degree subject “Statistical Process Control”. The practical experience shows wide acceptance of the selected method.
2
METHODOLOGY
Based on experiences with teaching SPC and using SPC techniques in the industry, the simulation software SPCSim was designed to address education challenges. First, the learning objectives were worked out. Then the software specification was created based on the learning objectives. Software platform was chosen with regard to future utilisation, namely: • Running on different devices, mobile devices including. • Interactivity and cooperative learning in groups (client-server architecture needed). • Integration of simulator and multimedia learning content. Considering the above facts, we chose Web technology: HTML, CSS, JavaScript on the client side and PHP, MySql on the server side. The first standalone version of the simulator was created and used in education. Students were asked to fill a questionnaire to asses achieved results. All findings were recorded including teacher experience.
3
DESCRIPTION OF SIMULATION TOOL
3.1 The learning objectives Out of the above-outlined situations the high-level learning objectives that are expected to be met by employing the simulation are: 1) To grasp the fact that monitored parameters of the process are random variables that can be observed using statistical characteristics and a histogram. 2) To understand the way how the control chart works, as well as the fact that exceeding of the control limits does not necessarily mean that the process is out of control. An unstable process, on the other hand, produces
ISBN 978-80-7435-483-0 (GAUDEAMUS, HRADEC KRÁLOVÉ) ISBN 978-80-553-1815-8 (TECHNICAL UNIVERSITY OF KOŠICE, KOŠICE)
181 PROCEEDINGS OF THE SCIENTIFIC CONFERENCE QUALITY AND LEADING INNOVATION´2014 KOŠICE – HRADEC KRÁLOVÉ, SEPTEMBER 19 – 20, 2014
significantly higher number of “control limits exceeded” signals though absence of such a signal can be occasionally experienced as well. 3) To be able to determine limits of control charts so that the chart has desired properties. 3.2 Achieving learning objectives To achieve the first learning objective, the student is introduced to the simulated process of production of simple parts, where one parameter – the diameter is measured. Actual value of the parameter is random variable. Tolerances were provided therefore number of scrap can be evaluated. Second learning objective is supported by control charts that continuously monitor the running process. Charts statistics as the Average Run Length are displayed to show the current status of process stability. The third objective is not directly supported by simulator but it is possible to get process data from simulator, calculate control limits in a spreadsheet and set this new control limits to see, how it affect process stability monitoring. The student is led by task assignments and instructions: A. Learning objective: To understand the fact that monitored parameters of a process are random variables. Task: Production process monitoring. Instructions: • Run the process with the pre-set parameters. • Observe the process characteristics (mean value, standard deviation, number of nonconforming products and the histogram) when the process is stable. • Modify the process parameters and monitor altered characteristics. B. Learning objective: To understand how the control chart works. Task: Observing the behaviour of Control Charts. Instructions: • Observe how control charts work when the process is in control. • Modify the process parameters and observe functioning of control charts when the process is unstable. • Determine probabilities of false and missing signals for each case.
ISBN 978-80-7435-483-0 (GAUDEAMUS, HRADEC KRÁLOVÉ) ISBN 978-80-553-1815-8 (TECHNICAL UNIVERSITY OF KOŠICE, KOŠICE)
182 PROCEEDINGS OF THE SCIENTIFIC CONFERENCE QUALITY AND LEADING INNOVATION´2014 KOŠICE – HRADEC KRÁLOVÉ, SEPTEMBER 19 – 20, 2014
C.
Learning objective: To be able to determine limits of control charts.
Task: Calculation of control chart parameters. Instructions: • Select the unknown process parameters and run the process. • Based on the measured data calculate the control chart parameters (control limits, central line). • Observe functioning of charts and determine probabilities of false and missing signals for the case of both stable and unstable process. A part of the learning process is a feedback in the form of questions that the student is to answer upon completion of each task. Through correct answers s/he will learn if s/he proceeded correctly. Further parts of the simulator are a glossary and textbook covering pieces of theoretical knowledge necessary to master the tasks. The simulator can be used from self-learning and distance web based learning up to face to face and collaborative learning. 3.3 Simulator architecture and user interface SPCSim uses HTML, JavaScript and Cascading Style Sheets (CSS). It opens in a web browser either from the computer’s local disc or the web site on the Internet. The simulator structure is presented in Figure 1. User Interface
Home Production Process
Simulator Engine
Control Charts Instructions Glossary
Random Data
Figure 1 – SPCSim structure Simulator engine behind user interface generates random process measurements that are displayed in tabular form, histogram and control charts. User has an opportunity to change random data characteristics. The Home page provides basic information on purpose of the simulator (Figure 2). The Production Process page illustrates a production process. The process can be started and its parameters altered (mean and standard deviation). ISBN 978-80-7435-483-0 (GAUDEAMUS, HRADEC KRÁLOVÉ) ISBN 978-80-553-1815-8 (TECHNICAL UNIVERSITY OF KOŠICE, KOŠICE)
183 PROCEEDINGS OF THE SCIENTIFIC CONFERENCE QUALITY AND LEADING INNOVATION´2014 KOŠICE – HRADEC KRÁLOVÉ, SEPTEMBER 19 – 20, 2014
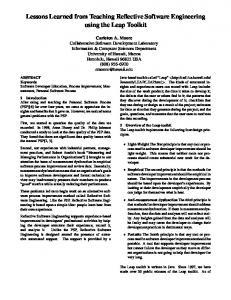
Statistical characteristics of process data are monitored and shown in the histogram (Figure 3). Control Charts page shows X-bar and R control charts. If the process is running than the data in control charts are running as well. It allows continuously monitoring the data with respect to control limits and recording the number of cases beyond limits. User can alter the control limits and follows number of beyond limit signals. Average Run Length (ARL) is continuously calculated. After each change, a new line in the charts statistics table is displayed so that behaviour of control charts can be compared prior to and after change (Figure 4). Instruction page describes tasks to be performed, including correct answers (Figure 5). Glossary page contains an explanation of basic terms (Figure 6).
Figure 2 – SPCSim homepage
ISBN 978-80-7435-483-0 (GAUDEAMUS, HRADEC KRÁLOVÉ) ISBN 978-80-553-1815-8 (TECHNICAL UNIVERSITY OF KOŠICE, KOŠICE)
184 PROCEEDINGS OF THE SCIENTIFIC CONFERENCE QUALITY AND LEADING INNOVATION´2014 KOŠICE – HRADEC KRÁLOVÉ, SEPTEMBER 19 – 20, 2014
Figure 3 – The page with parameters and statistical characteristics of the Production process.
Figure 4 – The Control Charts page
ISBN 978-80-7435-483-0 (GAUDEAMUS, HRADEC KRÁLOVÉ) ISBN 978-80-553-1815-8 (TECHNICAL UNIVERSITY OF KOŠICE, KOŠICE)
185 PROCEEDINGS OF THE SCIENTIFIC CONFERENCE QUALITY AND LEADING INNOVATION´2014 KOŠICE – HRADEC KRÁLOVÉ, SEPTEMBER 19 – 20, 2014
Figure 5 – Part of the Instructions page, right answers are hidden
Figure 6 – Part of the Glossary page
4
FINDINGS
This section contains findings from using the simulator SPCSim in teaching of the university degree subject “Statistical Process Control”. Students were asked to fill a questionnaire to asses achieved results. The questionnaire consists of
ISBN 978-80-7435-483-0 (GAUDEAMUS, HRADEC KRÁLOVÉ) ISBN 978-80-553-1815-8 (TECHNICAL UNIVERSITY OF KOŠICE, KOŠICE)
186 PROCEEDINGS OF THE SCIENTIFIC CONFERENCE QUALITY AND LEADING INNOVATION´2014 KOŠICE – HRADEC KRÁLOVÉ, SEPTEMBER 19 – 20, 2014
three Scaled questions and two Open-ended questions. Questions, scores, and summary of answers of open-ended questions are in Table 1. Table 1 – Questionnaire Question
Score (0-no, 5-definitely yes) / Answers
Is user interface intuitive? Is chart function understandable? Can tasks be finished quickly?
4.07 4.07 4.57
What do you like on SPCSim?
• good graphics, nice design • easy to use • illustrative
What changes/improvements do you suggest?
• remove bug in key function • collaborate more easily with Excel • add Slovak language, solve decimal point/comma problem • enhance calculating speed • more modules / settings
Table 2 contains condensed findings and experiences from the teacher point of view and software development point of view. Table 2 – Pros and Cons: teaching experience and used software platform Pros
Cons Teaching experience
• Simulator draws student attention. • Control Chart understanding is faster. • Less resistance to accept the theoretical background.
• Not exact results from tasks due to randomness. • Language preferences. • Limited number of tasks.
Software platform • Platform independent (Windows, Lynux, Mac Os). • No installation (needs only web browser). • Online / Off line. • Easy to update (if running online from the web).
• JavaScript speed (IE is very slow). • Non deterministic loading of multiple scripts (sometimes page reload is needed). • Algorithm for random number generator must be programed.
The findings agree with author’s experience with using simulation in education (Lengyel, Zgodavová and Bober, 2012; Zgodavova et. al, 2012.). It is easy to draw the attention of students. Well-designed virtual environment is selfexplanatory even without an intricate description. Moreover, it supports accelerated understanding and storing-up of the theme.
ISBN 978-80-7435-483-0 (GAUDEAMUS, HRADEC KRÁLOVÉ) ISBN 978-80-553-1815-8 (TECHNICAL UNIVERSITY OF KOŠICE, KOŠICE)
187 PROCEEDINGS OF THE SCIENTIFIC CONFERENCE QUALITY AND LEADING INNOVATION´2014 KOŠICE – HRADEC KRÁLOVÉ, SEPTEMBER 19 – 20, 2014
During software development, it has shown that more attention must be pay to the choice of the random generator for the normal distribution. It is important that the generator is “good” because of experimental verification of theoretical properties of the control chart (e.g. ARL for process in control should be 370.4). R chart is more sensitive to random generator properties than X-bar chart. Programmed simulator has no extensive functionalities, but the chosen set of function in the actual stage of development confirmed the usefulness in education. Stated learning objectives were achieved and results encourage to further development that depends on the extension of usage and available resources. Ideas for further development are: • Extending the interactivity: o different of control charts, o different production processes / parameters. • Extending the number of tasks: o construction of operating characteristics, o selection of appropriate control chart, o identification of different causes of out of control signal. • Process capability assessment. • Case studies / Problem-based learning / Collaborative learning. • Linking to Course teaching materials. • Multi language environment.
5
CONCLUSION
The simulator SPCSim allows to monitor the way the control charts identify the out of control state of the production process. Students investigate properties of control charts through experiments where statistical properties of the production process are changed. Running simulation and possibility to explore and control draws students attention. These practical activities result in deeper understanding and unforced learning of the subject Statistical process Control. Evaluation of teaching experiences and student feedback shows that simulators similar to SPCSim have a clear justification in education.
ISBN 978-80-7435-483-0 (GAUDEAMUS, HRADEC KRÁLOVÉ) ISBN 978-80-553-1815-8 (TECHNICAL UNIVERSITY OF KOŠICE, KOŠICE)
188 PROCEEDINGS OF THE SCIENTIFIC CONFERENCE QUALITY AND LEADING INNOVATION´2014 KOŠICE – HRADEC KRÁLOVÉ, SEPTEMBER 19 – 20, 2014
ACKNOWLEDGEMENT This work was supported by project KEGA 011TUKE-4/2013 of the Ministry of Education, Science, Research and Sport of the Slovak Republic.
REFERENCES Bersimis, S., Psarakis, S. and Panaretos, J., 2007. Multivariate statistical process control charts: an overview. Quality and Reliability Engineering International, Volume 23, Issue 5, pages 517–543, doi: 10.1002/qre.829. DataNet Quality Systems, 2014. WinSPC, Real-Time Statistical Process Control Software [online] Available at: http://www.winspc.com [Accessed 10 September 2014]. Lengyel, L., Zgodavová, K. and Bober, P., 2012. Modeling and Simulation of Relocation of a Production in SIMPRO-Q Web Based Educational Environment. International Journal of Advanced Corporate Learning, 5(1), pp. 26-31, [online] Available at: http://dx.doi.org/10.3991/ijac.v5i1.1878 [Accessed 10 September 2014] Levinson Productivity Systems, 2014. P.C. Control Chart Simulator [online] Available at: http://www.ct-yankee.com/spc/chartsim.html [Accessed 10 September 2014]. McConnell, J., Nunnally, B. and McGarvey, B., 2010. Analysis and Control of Variation: The Dos and Don’ts of Control Charting—Part II. The Journal of Validation Technology, 16(4) [online] Available at: http://www.ivtnetwork.com/sites/default/files/The%20Dos%20and%20Don%E2 %80%99ts%20of%20Control%20Charting%E2%80%94Part%20II%20%281%2 9.pdf [Accessed 12 September 2014]. PQ Systems, Inc., 2014. Basic SPC Training [online] Available at: http://www.pqsystems.com/training/training-software/Basic-SPC-Training/ [Accessed 10 September 2014]. Sabadka, D., 2005. Vzdelávanie na báze skúseností – Learning by Doing, Transfer inovácií, 2005(8), pp. 87-89 Symphony Technology, 2013. SPC Training Simulator [online] Available at: http://www.symphonytech.com/quincunx.htm [Accessed 11 June 2013]. Symphony Technology, 2014a. Red Bead Experiment Simulator [online] Available at: http://www.symphonytech.com/redbeadexp.htm [Accessed 10 September 2014].
ISBN 978-80-7435-483-0 (GAUDEAMUS, HRADEC KRÁLOVÉ) ISBN 978-80-553-1815-8 (TECHNICAL UNIVERSITY OF KOŠICE, KOŠICE)
189 PROCEEDINGS OF THE SCIENTIFIC CONFERENCE QUALITY AND LEADING INNOVATION´2014 KOŠICE – HRADEC KRÁLOVÉ, SEPTEMBER 19 – 20, 2014
Symphony Technology, 2014b. Deming's Funnel Experiment Simulator [online] Available at: http://www.symphonytech.com/funnelexp.htm [Accessed 10 September 2014]. Tošenovský, F., 2010. A mathematical model for process cycle time – theory and case study. Quality Innovation Prosperity, Volume 14, No 1-2, pp. 64-71, DOI: 10.12776/qip.v14i1-2.27 Zgodavova, K., Kosc, P. and Kekäle, T., 2001. Learning before doing: utilising a co-operative role play for quality management in a virtual organisation, Journal of Workplace Learning, 2001, 13(3), pp. 113 – 119. Zgodavova, K., Palfy, P., Horvath, M. and Bober, P., 2012. Integrated Management Systems web-based collaborative learning: (Interactive lesson presentation). In: 15th International Conference on Interactive Collaborative Learning (ICL), 26 - 28 September 2012, Villach, Austria, pp.1-3, DOI: 10.1109/ICL.2012.6402166
ABOUT THE AUTHOR Peter Bober, PhD. is assistant professor at the Faculty of Electrical Engineering and Informatics, Technical University of Kosice, Slovakia, e-mail:
[email protected].
ISBN 978-80-7435-483-0 (GAUDEAMUS, HRADEC KRÁLOVÉ) ISBN 978-80-553-1815-8 (TECHNICAL UNIVERSITY OF KOŠICE, KOŠICE)