Lessons Learned from Using a Web-based Interactive Landform Simulation Model (WILSIM) in a General Education Physical Geography Course Wei Luo
Department of Geography, Northern Illinois University, DeKalb, IL 60115,
[email protected]
Jay A. Stravers
Department of Geology and Environmental Geosciences, Northern Illinois University, DeKalb, IL 60115
Kirk L. Duffin
Department of Computer Science, Northern Illinois University, DeKalb, IL 60115
ABSTRACT This paper presents the results of testing a Web-based Interactive Landform Simulation Model (WILSIM) in a general education physical geography course. The goal was to determine whether the simulation exercise improved students' scores on tests administered before and after the exercise. Although the mean of post-test scores were slightly higher than that of the pre-test, the difference was not statistically significant. Further analysis of the tests questions suggests that the specifics of the design of the questions are very important to accurate assessment of student learning. Questionnaire results, however, strongly showed that students felt that WILSIM helped them learn. They particularly liked its capability to visualize and animate landform evolution processes, its interactiveness in exploring different scenarios, and its ease of use. We also conclude that more preparation work such as instructor-led introductions, demonstrations, better questions, and simulation scenarios designed with specific objectives in mind and in the context of real world landforms would help in achieving the full potential of WILSIM.
INTRODUCTION Background on visualization and simulation in education - Recent years have witnessed an impressive increase in use of computer visualization and simulation to enhance education in almost all science fields (e.g., Jensen et al., 2002; Khoo and Koh, 1998). Examples are numerous web sites maintained by universities or book publishers that contain multimedia features, and textbooks that provide visual and animated graphics in accompanied CD-ROMs to enhance traditional text. Visualization and simulation offer great promise for education (Gordin and Pea, 1995) because they exploit the power of the human visual system for discerning patterns and observing processes that are otherwise difficult to conceptualize. Visualization and simulation provide not only a fast and effective way of communicating information and ideas but also an opportunity to engage students in authentic inquiry as part of their learning process and thus enhance their understanding (Edelson and Gordin, 1998; Edelson et al., 1999). However, studies on the effectiveness of visualization and animation in improving learning have been mixed (e.g., Jensen et al., 2002; Tversky et al., 2002; Anglin et al., 2004). The facilitative effects of visualization and animation are not readily apparent across all learning situations (Anglin et al., 2004). In the cases where student performance did increase, some common components of visualization and simulation were: 1) the use of specific
learning objectives to guide development of the visualization and simulation; 2) the use of student feedback to create updated versions; 3) the use of open ended problems; 4) the high interactivity and quality of the visualization and simulation; and 5) the fact that hands-on exercises often supplemented the material (Jensen et al., 2002). Although we still know very little about the effect of animated visual displays on student learning (Anglin et al., 2004), most researchers agree that interactivity may be the key to maximizing its advantages (Anglin et al., 2004; Tversky et al., 2002). Background on landform evolution and WILSIM - The landforms we observe today are the result of a variety of interacting physical processes operating over geological time. These include erosion and deposition and their interplay with underlying rock structures, tectonic history, surficial rock types, climate and climatic changes, and even recent human activities. Present day landforms provide a window through which we can infer past processes that led to the current landscape. Thus landform evolution models are an ideal means for training students of the earth sciences in using the systems approach to studying the Earth, an approach that treats Earth as a system involving complex interactions among many different processes. Because of the short human life span, long-term landform evolution cannot be observed directly. Furthermore, the interaction of differing physical processes involved are difficult to infer from the limited temporal observations of present day forms. Computer simulation is an ideal tool for understanding the complex effects of a variety of physical and geological processes that interact to influence landform evolution over geologic time scales. Yet the simulation models and the visualization and animation that they demand usually require specialized software that is not easily accessible to students and teachers (Edelson et al., 1999). The Web-based Interactive Landform Simulation Model (WILSIM) gives teachers a powerful tool to help students better understand landform evolution through interactive exploration. The only requirement is an Internet connection and a standard Java-enabled web browser and thus it can be accessed anywhere and anytime at http://www.niu.edu/landform. By manipulating different parameters/variables such as rock erodibility, rainfall intensity, climatic change, and tectonic uplift in WILSIM, students are able to explore and observe in interactive animation how landforms evolve through geologic time. Although the model does not simulate every aspect of the real world, it does allow students to interactively explore different scenarios or combination of variables and thus better understand the interaction between different processes
Lou et al. - Web Based Interactive Landform Simulation Model
489
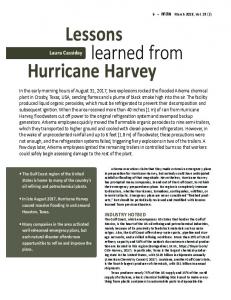
Figure 1. Snapshots of scenario 3 (uniform erodibility, constant climate, with tectonic uplift) at 4 intervals of the landform evolution. Branching channel networks are developing and extending headward in the stable lower portion of the terrain. Alluvial fans are developing along the boundary between the stable and uplifting parts of the terrain. Branching channel networks are also developing and extending headward on the uplifted plateau.
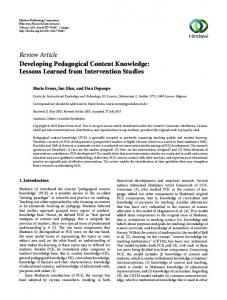
Mean Standard Deviation
Pre-test 6.78
Post-test 6.844
1.66
1.88
Table 1. Comparison of mean score between pre- and post-tests. (Dependent t-test result: n=55; t = 0.2287; tcrit=1.6736; p=0.41, one-tail)
and their relationships to resulting forms. The details of how WILSIM works are described in Luo et al. (2004).
class of 82 to participate in an experiment to test the effectiveness of WILSIM in enhancing students' learning about landform evolution. The experiment was self-guided/self-paced, conducted outside of the classroom, but at about the same time as landform evolution topics were covered in class. Participants were given two weeks to complete the exercise and nominal extra credit points were offered as incentive for completion. Participating students were asked to (1) take the pre-test, (2) use WILSIM to simulate landform evolution under 3 different scenarios as described in the tutorial, (3) answer questions after each scenario, and (4) take the post-test and relevant questionnaires. The physical parameters for the three modeling scenarios were:
Purpose of this paper - Given the apparent advantages of interactive visual simulation (particularly as it applies to landform simulation), and yet the mixed results of its effect in facilitating learning reported in the literature, (1) constant erodibility everywhere across the landscape (model grid), constant climate throughout the purpose of this paper is to present the results of using the simulation duration, and no tectonic uplift, WILSIM in a general education undergraduate course. The primary aim of the WLISIM exercise in this course is (2) different erodibility (one part of the grid is easier to erode than the rest of the grid), constant climate to determine whether the interactive simulation exercise throughout the simulation duration, and no tectonic improved students' scores on tests administered before uplift, and after the exercise. By analyzing the results, we draw some lessons and conclusions learned from this process. (3) constant erodibility everywhere across the landscape (model grid), constant climate throughout the simulation duration, but with tectonic uplift THE COURSE AND EXPERIMENT across one part of the model grid. The course involved was GEOG101 (Survey of Physical Geography), which is a general education course and covers many aspects of physical geography, emphasizing a systems approach in studying earth's physical surface and landform evolution. During the spring semester of 2004, we recruited 55 students from a 490
The pre- and post-tests were exactly the same and consisted of 9 questions intended to test students' general understanding of landform evolution processes and associated basic terminology. The test questions for each scenario (model run) were geared specifically to that
Journal of Geoscience Education, v. 53, n. 5, November, 2005, p. 489-493
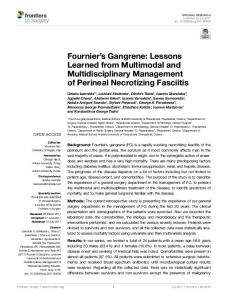
Questions 1. What is the definition of a drainage network or drainage system? 2. How long does it take a complex integrated drainage system such as those seen on the surface of the Earth and Mars to develop? 3. Concerning the time frame over which drainages develop, why are numerical models such as WILSIM so valuable? 4. When flowing water erodes the land surface to create a drainage network, do these drainages always develop at the same rate everywhere in nature or in a computer model? 5. The term “Tectonics” refers to which of the following? 6. What do you think the best definition for “erodibility” would be? 7. When a stream leaves a tectonically uplifted mountain and debouches onto an adjacent plain, what type of landform is most likely to form at the mountain front (where the mountain meets the plain)? 8. Which of the following do you think would control the rate of drainage network development? 9. Where in the landscape do you think the deposition (accumulation of eroded and transported sediments) would most unlikely to occur? Mean Stamdard Deviation
Pre83.05%
Post78.18%
64.41%
69.09%
81.36%
74.55%
98.31%
92.73%
94.92% 77.97%
87.27% 83.64%
37.29%
67.27%
93.22%
87.27%
47.46%
43.64%
75.33% 21.44%
75.96% 14.88%
Table 2. Questions and percentages of correct answers in pre- and post-tests. (Dependent t-test result: n-9; t=0.1570; tcrit=1.8595; p=0.4396, one tail)
scenario. The questionnaires were designed to gauge the students' perception of, and response to the model. All tests and questionnaires were administered through the BlackBoard online learning system. The majority of the participants were sophomores (49.1%), followed by seniors (23.6%), juniors (20%) and freshmen (7.3%). The overwhelming majority of the participants were non-geoscience majors (96.36%). Only two were geography majors.
RESULTS AND DISCUSSION Pre- and Post-tests - There is a slight increase in the average scores in the post-test compared to the pre-test (Table 1). To determine if this difference was significant, we conducted a t-test for related (or dependent) samples (e.g., Heiman, 1992). The null hypothesis is that the means of pre- and post-test scores are the same: H0: µpre = µpost and the alternative hypothesis is that the post-test mean will be larger than the pre-test mean: H1: µpre < µpost. The computed t value is 0.2287 and the critical value for rejecting the null hypothesis at α =0.05 and with a degree of freedom of 54 is tcrit = 1.6736. Since t < tcrit, we cannot reject the null hypothesis and the difference is not statistically significant. We were disappointed at the pre- and post-test results, so we examined more closely the individual questions and the percentage of correct answers to each question (Table 2). The average of the correct answer percentage in post-test is still slightly higher than that in the pre-test, but the difference is not statistically significant. However, the post-test standard deviation is smaller than the pre-test. Of the 9 questions, 6 show a decrease in the percentage of correct answers from preto post-test, and 3 show an increase. Of the 6 that show a decrease, two of them (#1 and #5) are related to definitions of terminology, which the non-geoscience majors may not have had exposure to previously. Three of them (#3, #8, and #9) may not have been well designed as they contain "both A and B", "all of the above" in the choices (#3 and #8) and "unlikely" in the question (#9). This format may have made them more difficult to
answer, especially for 100-level general education students. The last of the 6 (#4) is a simple true or false question, which is more likely to give a higher correct answer percentage, however, the post-test still shows a slight decrease. Perhaps this is because it is less directly related to the simulation scenarios and/or running the model may have confused some students or changed their perception of geologic time and process. In contrast, the three questions that show increases in correct answer percentages from pre- to post-tests are those that students directly dealt with in their modeling scenarios [model time (#2, in all scenarios), erodibility (#6, in scenario 2) and alluvial fans (#7, in scenario 3)]. It is interesting to note that the largest jump in correct answer percentage was #7 (from 37.29% to 67.27%, about 30% increase). Obviously the dramatic visual effect of the animation that the students observed in scenario 3, as alluvial fans built outward from the edge of an uplifted plateau, must have contributed to this dramatic increase (see Figure 1 for four snapshots of this scenario). Questions Specific to Simulation Scenarios - Table 3 summarizes the percentage of correct answers to the questions specific to each simulation scenario. Overall the majority of the students answered the questions correctly with 4 of the 9 questions reaching a correct answer percentage of over 80%. This is a substantial achievement for a group of mostly non-geoscience majors. In addition, the standard deviation is also smaller than those in the pre- and post- tests. Again students performed more poorly on questions dealing with terminology (#3 and #9). This is understandable given that most of them were non-geoscience majors. Difference Btween Participants and Non-participants - We also conducted statistical tests on the overall performance in the course between those who participated in the exercise (excluding the nominal extra credit points) and those who did not. The average score of the participants are slightly higher than the non-participants but the difference is not statistically significant (see Table 4). This is probably to be expected
Lou et al. - Web Based Interactive Landform Simulation Model
491
Scenario
(1)
(2)
(3)
Questions 1. What do different colors in the animation represent? 2. Which general direction is the drainage network extending? 3. What is the geomorphology term describing the direction of drainage network development? 4. Compare your result with the one shown in the Tutorial. Are they exactly the same? Why or why not? 5. The channels in the soft part of the terrain appear to be ___ than those in hard part of the terrain because it is ____ to erode. 6. Do all the channels extend into the softer part of the terrain? Why or why not? 7. Where does erosion mostly occur? 8. Where does deposition mostly occur? 9. What are developed at the base of the escarpment (where the uplifted part meets the lower plain)? Mean Standard Deviation
% correct 85.45% 67.27% 58.18% 85.45% 81.82% 85.45% 67.27% 70.91% 65.45% 74.14% 10.48%
Table 3. Questions specific to the exercise.
Mean Standard deviation
Non-participants (n=20) 74.425 9.757959
Participants (n=51) 74.64706 10.37318
Table 4. Comparison of overall course performance between participants and non-participants. (Independent t-test result: t=0.0825; tcrit=1.6672; p=0.4672, one-tail, assuming equal variance, missing data removed)
understand the material better and clearer. I now have a better and fuller understanding about landforms. Students Feedback from Questionnaire - Students Hands on learning is best for a lot of students, and this gives them a chance to understand it better. were also asked to self-assess whether WILSIM had helped enhance their understanding of landform Negative responses and suggestions for evolution at the end of the exercise. They were given three statements and asked to answer the degree to improvement include: slow on some computers; too which they agree with the statement (Table 3). The much text; having to switch between windows to read majority of students who participated in this exercise instructions and manipulate the model; not very clear agreed or strongly agreed that WILSIM enhanced their about the meaning of each parameter; more explanations learning of landform evolution (>66%) and increased of what is happening; letting student know the correct answer. Some representative comments are excerpted their interests and curiosity about nature (>55%). Finally, they were also asked to provide feedback below: about the model at the end of the exercise. The most positive responses include: ready access, simple The animations took longer than expected to load. More interface, easy to follow instruction in the tutorial, and explanations of what is happening need to be provided. the visual, dynamic and interactive nature of the model. Some representative comments are listed here: The model did not seem to accurately represent what really happens. I liked that I was able to visually see how that land I didn't like the terms that were used in the place where changes. you change the parameters. It seemed a little hard to It was easy to learn and use. It was fun. understand what the decimals really meant. I like how I can see what happens over many centuries in I'm not good with computers. Having to do all the opening and closing wasn't easy for me. If someone just a matter of moments. Using WILSIM allows me to understand how mother nature works and the had presented this I would have enjoyed it more. way our world is changing. That I had to go back and forth between two and three That you can see what you learn in class visually. windows. I didn't know what questions I got right and what I got I enjoyed watching how these landforms are formed. I really liked that I could actually see what happens wrong. It helps me learn better when I know what through animation, and that I could change things to got wrong and right so I can look over the information again. see what happens. I really enjoyed the great graphics and that it was easy to There was a lot of text on the page. It might discourage understand. some of the people to leave the page due to all the reading and instructions. Also, maybe if there were I liked the animations that showed the different types of scenarios. I think that really helped me to better to be separate animations that were already set to the understand the landforms and the formation of it. I parameters of the simulation, might have been really enjoyed being able to see it visually, since I am better. a visual learner. I think that helped me the most to because landform evolution is only a small part of the content covered in the entire course.
492
Journal of Geoscience Education, v. 53, n. 5, November, 2005, p. 489-493
Statement Strongly Agree Agree Neutral Disagree St .Disagree A 24.43% 48.21% 26.79% 3.57% 0.00% B 19.64% 46.43% 25.00% 8.93% 0.00% C 7.14% 48.21% 32.14% 8.93% 3.57% A. Being able to visualize landform evolution over time in WILSIM enhances my understanding of the processes involved B. Being able to interactively change different parameters in WILSIM and observe what happens to the landform enhances my understanding of the effects of different factors (such as erodibility and tectonics) on landform evolution. C. WILSIM increases my interests and curiosity about nature and I want to learn more about how nature works. Table 5. Results from the self-assessment questionnaires.
I would actually like more scenarios and examples. I clearly and visually demonstrate one or two specific would like more explanation of what happened, concepts, clearly stating the objective and expectation of the exercise, and putting the simulation scenarios in the maybe after I answered the questions. real world landform context would also improve students understanding of those concepts. These lessons SUMMARY learned are being incorporated into a new version of the The mean of post-test scores was slightly higher than that exercise and pre- and post-tests, which will be tested of the pre-test, although the difference was not during the spring semester of 2005. statistically significant. Close examination of the pre- and post-test questions suggests that the poor design of some ACKNOWLEDGEMENTS of the questions might have contributed to the decrease in the percentage of correct answers for those questions The WILSIM project is supported by the National Science in the post-test. In contrast, the questions that show Foundation under Grant No. 0127424. Any opinions, increases in correct answer percentages from pre- to findings, and conclusions or recommendations post-test are those that are directly related to the expressed in this paper are those of the author(s) and do modeling scenarios and with dramatic visual effects. not necessarily reflect the views of the National Science Qualitative feedback from students showed that they did Foundation. like the model and the majority of them agreed or strongly agreed that the model enhanced their learning. REFERENCES They seemed to particularly like its capability to visualize and animate landform evolution processes, its Anglin, G. J., H. Vaez, K. L. Cunningham, 2004, The Role interactivity in exploring different scenarios, and its ease of Static and Animated Graphics, in: Jonassen, D.H., of use. The student-centered exploratory approach editor, Handbook of research for educational appeared to enhance students' understanding of communications and technology (2nd edition). concepts that are directly related to the simulation Bloomington, IN, AECT. p. 865-916. scenarios. These findings are consistent with the Edelson, D. C., and Gordin, D., 1998, Visualization for common components of successful cases where student learners: A framework for adapting scientists' tools, performance did increase as a result of using Computers and Geosciences, v. 24, p. 607-616. visualization and simulation reported in the literature Edelson, D. C., M. Brown, D. N. Gordin, D. A. Griffin, and summarized in the Introduction. 1999, Making visualization accessible to students, GSA Today, Februray 1999, p. 8-10. Lessons Learned and Future Work - For a general Gordin, D. N., and Pea, R. D., 1995, Prospects for education course with a majority of non-geosciences scientific visualization as an educational technology, majors, much more could be done to exploit the full Journal of the Learning Sciences, v. 4, p. 249-279. potential of WILSIM. Although all the necessary Heiman, G. W., 1992, Basic statistics for the behavioral information was given in the introductory pages of the sciences, Boston, Houghton Mifflin, 567 p. website, not all students would read them before they Jensen, D., B. Self, D. Rhymer, J. Wood, and M. Bowe, started the simulation. Clearly, in this classroom context 2002, A rocky journey toward effective assessment of some explanation and/or demonstration in class by the visualization modules for learning enhancement in instructor before they start the experiment would be Engineering Mechanics, Educational Technology & helpful and would likely reduce the negative comments Society, v. 5, n. 3, p. 150-162. concerning the meaning of model parameters and model Khoo, G. S. and T. S. Koh, 1998, Using Visualization and procedures. Also emphasizing the difference between Simulation Tools in Tertiary Science Education, the model and the real world, and the value and Journal of Computers in Mathematics and Science limitation of modeling by the instructor would also Teaching, v. 17, n. 1, p. 5-20. eliminate some of the confusion experienced by students Luo, W., K.L. Duffin, E. Peronja, J.A. Stravers, and G.M. in answering the post-test questions. Constructing Henry, 2004, A Web-based Interactive Landform well-designed questions that are closely related to the Simulation Model (WILSIM), Computers and simulation scenarios, and taking full advantage of the Geosciences, v. 30, n. 3, p. 215-220. visual effect of the model animation, would certainly Tversky, B., J. Morrison, M. Betrancourt, 2002, enhance students learning, as demonstrated in 3 of the Animation: Can It Facilitate? International Journal of pre- and post-test questions. Along this same line of Human Computer Studies, v. 57, p. 247-262. reasoning, designing appropriate model scenarios that Lou et al. - Web Based Interactive Landform Simulation Model
493