Lessons from the PSTN for Dependable Computing A Study of FCC disruption reports
Patricia Enriquez Mills College
Aaron Brown UC Berkeley
David Patterson UC Berkeley
1021 Warden Ave San Leandro, CA 94577 (510) 638-1435
477 Soda Hall #1776 Berkeley, CA 94720 (510) 642-1845
635 Soda Hall #1776 Berkeley, CA 94720 (510) 642-6587
[email protected]
[email protected]
[email protected]
Abstract: The Public Switched Telephone Network (PSTN) is a large, complex, distributed system with strong dependability guarantees. As users come to expect greater dependability from computer systems, looking at similar systems like the PSTN can provide valuable insight into failure modes and dependability techniques. In this paper, we present the failure reporting methodology used by the PSTN, consider different metrics for reporting availability, and discover that human error is the most significant cause of PSTN unavailability. Designers of computer systems can learn from the failure data to gain quantitative information to predict why computer systems fail. More importantly, they can learn from seeing how the PSTN failure data is collected and how to measure the impact of failures. General Terms: Measurement, Documentation, Reliability, Human Factors Key Words: availability, dependability, metrics, failure data, PSTN
1. Introduction Currently, computer systems experience many reliability issues especially with the rise of e-commerce and highly used Internet services. E-commerce presents a demand for highly functional systems that can offer services 24 by 7. From online auctions, such as eBay, to online brokerages, the demand for reliable systems has become much more intense. Although high availability is important, meeting the demand is very difficult. For example, in an informal study using eBay’s published outage reports, we found that the eBay site was fully available for less than ninety percent of the time over a two and a half week period [1]. The lack of availability experienced by companies such as eBay demonstrates the need to further understand computer systems and their flaws so that the high demand for service can be met. In
an attempt to identify the components that need to be improved upon, we analyze the Public Switched Telephone Network (PSTN) as a comparison point of a highly-reliable and carefully controlled system. The PSTN is a widely used, highly- reliable, fault tolerant system. Much of its dependability comes from highly-reliable hardware and software, and from redundancy in the network design. In many ways, this technology platform can be directly compared to a modern distributed computer system. The telephone network is composed in part of switches, which can be directly compared to the computers that make up a computer system. A switch, much like a computer, includes redundant hardware and extensive self-checking and recovery software [2]. Both systems also require human intervention to maintain their functionality.
While the protocols and applications may be different, the structure, components, and complexity are similar. In some sense, we can view the highly- dependable PSTN as an upper bound on the dependability of computer systems, making it an ideal case study for understanding techniques and metrics for dependability. In this paper, we present an analysis of the dependability of the PSTN using actual outage data from the year 2000. We focus on the techniques and metrics used to report dependability and on the failure modes of the PSTN. Our study was inspired by a more limited initial study performed by Richard Kuhn [2]. We update his results with more recent data
and extend his work with more analysis, new metrics, and greater consideration of reporting techniques. In the remainder of this paper we will present the reporting techniques applied by the Federal Communications Commission (FCC) for outages along the telephone network and present three metrics for analyzing the data. We will then use these metrics to study the sources of non-dependability in the PSTN. We offer this analysis in hopes that it will provide a template for documenting and evaluating outages experienced by computer systems, leading to better computer system evaluation and availability improvement.
Company Date Place Time
Number of Customers affected Blocked Calls Duration
Explanation
Cause
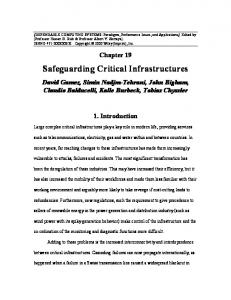
Figure 1. Outage Report. The FCC requires that outages along the Public Switched Telephone Network be reported if they affect at least 30000 people or last at least thirty minutes. The outage reports contain information such as company name, time, explanation of the event, outage cause, date of the outage, the geographic area affected by the outage (place), customers affected, blocked calls, and outage duration.
2
2. Reporting Unlike traditional computer systems, the outages that occur on the PSTN are well documented, as required by the FCC. By law, telephone service providers are required to report outages that affect at least thirty thousand customers or that last at least thirty minutes [3]. Telephone service disruption reports generally include company name, outage duration, outage time, date, event description, direct cause, root cause, number of customers affected, and blocked calls (Figure 1). The number of customers affected that are reported by the companies pertain to the number of lines along which service was disrupted. The number of customers affected does not accurately report the actual number of customers that attempted to use the phone lines, but rather accounts for all customers regardless of their attempt to use the service during the outage. Blocked Calls, on the other hand, report the
Number of Outages
number of phone calls that were interrupted by the outage. Commonly, blocked calls are accurately reported by the software provided on the network, but the number that is reported may at times be an estimate based on the call load that is expected during the outage time. This number reflects the actual number of the customers that were affected by the outage because it accounts for the number of customers who attempted to use the service during the outage. Using blocked calls to distinguish the actual number of customers affected from the potential number allows data analysis to become much more meaningful and easily comparable. Although being able to compare these two values is interesting, we believe that only data that is more telling of reality (i.e., blocked calls) should be reported to give a more accurate understanding of the outage’s effects. The outage reports provide a broad
Customer Minutes
Hardware 25%
Hardware 19%
Human-Co 33%
Human-Co 38%
Blocked Calls
Hardware 30%
Vandalism 1%
Vandalism 1%
Software 8%
Software 7%
Overload 1%
Vandalism 1%
Human-Ext 16%
Nature 8%
Software 7% Overload 1% Nature 7%
Overload 2% Nature 1%
Human-Co 40%
Human-Ext 30%
Human-Ext 24%
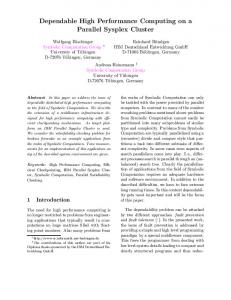
Figure 2. Metrics: Number of Outages, Customer Minutes, and Blocked Calls. The three pie charts above demonstrate the different aspects of the data that are captured by the three distinct metrics. The data set represented includes PSTN outage reports for the year 2000, as required by the FCC, but excludes outages that were inconsistent with the rest of the data as well as outages that did not report blocked calls or number of customers affected. We only analyzed outages that allowed for analysis under all three metrics, leaving a total of 179 outages.
3
understanding of the event by reporting a root cause and a direct cause. The root cause identifies the problem that sparked the potential for an outage, while the direct cause is the immediate trigger of the outage. For example, the root cause of an outage may be a latent software error while the direct cause may be a human error during maintenance. This classification of an outage’s cause allows for more accurate analysis of the outage’s origin. The description of the event also allows the analyzer to understand the occurrence and categorize it for more useful analysis, without having to completely understand the workings of the PSTN. The reporting techniques required by the FCC for the telephone network would be highly beneficial for computer operators to follow in order to gain further knowledge about the weaknesses of the systems and their components. Being able to pinpoint these system vulnerabilities would allow for more robust systems.
3. Metrics The various values and elements of the outage reports allow for various forms of analysis. Categorization of the outages according to their cause can be easily done by analyzing the description of the outage. We have collected and analyzed the FCC outage reports for the year 2000. The outages commonly fall into one of seven categories: human-company, human-external, software, hardware, acts of nature, vandalism, and overload. Human-company includes failures caused by humans that are in any way involved with the telephone company including company contractors and company vendors who are in contact with the network equipment. Some of the errors that a company-related human can cause include procedural errors, accidental cable cuts, and erroneous hardware replacement. The category of human-external includes errors made by humans who are in no way affiliated with the telephone company and would not
normally come in contact with the network equipment. The errors that fall into this category primarily include cable cuts due to unreported digging. Software includes errors that are directly related to faults in the software such as corrupt or incorrect communication software. Hardware failures include failure in network components such as switches as well as power outages and cable corrosion. Acts of nature include damages caused by rain, snow, lightning, fire, wind, and floods. Outages caused by intentional harm to the telephone network are categorized as vandalism. Overload is used to categorize the failures caused by exceeding network capacity. Outage categorization is facilitated by the detail provided in the outage reports. Having categorized the outages, analysis can be made. The first metric that is used is number of outages. The outages are simply counted and categorized so that the major causes of failure are clearly observed. Although knowing what the major causes of failure are is important and can be very informative, there is more indicative information about the outages such as its duration and blocked calls, than simply how many occurred under each category. By combining the number of customers affected (number of working lines) and the duration of the outage by multiplying the two, an interesting and more telling metric is formed. Customer minutes capture the aggregate experience of telephone users during the outage. This new metric tells how many total minutes were experienced as a whole by adding the total minutes that all affected users or lines experienced. For example, an outage affecting 20 000 customers and lasting 25 minutes results in 500 000 customer minutes, assuming that all affected customers tried to make a call. Although customer minutes depict the overall customer experience, they also include the assumption that all customers attempted to use telephone lines during the outages, which may not be realistic or true for
4
all outages. Therefore, a third metric arises which does not make this assumption. Blocked calls, the number of calls that were interrupted as a result of the outage, is less assuming of customer use because this value gives the calls that were actually made or would have been made at that time of day, which reflects actual end user experience. When measuring availability it is best to measure it according to the users whose service was disrupted. Further, a customer who may depend on the service that has experienced an outage may not care about the system’s unavailability if they do not happen to find out about the outage or if one of their transactions is not disrupted. Availability may have to be measured according to direct user effect rather than by overall system functionality so that a clearer picture of who was affected by the system’s unavailability can be presented, as it is done by blocked calls. Finally, notice that the three pie charts in Figure 2 show significantly different breakdowns depending on which metric is used to analyze the failure data. We will return to this point in the next section, but it is worth noting now how important it is to choose the right metric for reporting unavailability. In the PSTN case, the most relevant metric to the end user, blocked calls, puts significantly different weights on the various failure sources than do the other metrics.
4. The PSTN’s Availability We have conducted analysis of the outage reports for the year 2000, which include 203 outage reports, from which we have eliminated 24. Four of the outages that we have excluded from the analysis were inconsistent with the rest of the data, making them outliers. We are unclear as to whether the numbers reported for the specific outages were over estimated or if there was an error in the report. To eliminate doubt, we have decided to exclude these outages from the analysis. We eliminated an additional 20 reports because they did not have enough
information to include them in the analysis of customer minutes and blocked calls. We decided that only reports that could be included under all three metrics should be analyzed to provide a more realistic portrayal of the PSTN’s reliability. Therefore, the data set that we analyzed consists of 179 reports. When using number of outages as a metric (Figure 2), we are able to observe that that the humans working for the companies and those outside of the companies amount to 54 percent of all reported outages. With 54 percent of the outages pertaining to human error, humans caused exactly 98 of the outages for the year 2000. Humans caused more than half of the outages, bringing forth significant proof that human-error is a major component of failure. A majority of these human-induced-errors were caused by company employees operating the network equipment or attempting to repair one of the components. Of the 98, humans within the company were accountable for 70 of them. The second most dominant cause of outages was hardware failure. Even within a system such as the telephone network, which is regarded as being highly fault-tolerant, hardware continues to inhibit the possibility of total availability. Hardware was accountable to 30 percent of the failures. Customer minutes (Figure 2) offers a collective overview of the customer experience. This metric, which assumes that all telephone lines were in use during the outage, reports that humans were accountable for 63 percent of the outages. Company employees were responsible for 33 percent, while humans from outside of the company were responsible for the remaining 30 percent. Hardware was accountable for an additional 19 percent. Customer minutes reflect the time required to repair the outage since it considers the duration of the outage, which includes the repair time. This indicates that human-induced errors are not only the larger part of the outages, but are also require more time to repair, leaving the end user without service for longer periods of time.
5
The next and final metric to be used is blocked calls, which also allows for aggregate analysis. The quality of the service being offered becomes the more important component of the outage as availability and dependability are seen as a goal. The end user experience was greatly affected by human errors. Humancompany and Human-external combined accounted for 64 percent of the blocked calls. Humans within the company were responsible for 40 percent of the outages, leaving the remaining 24 percent to humans outside of the company. This indicates that humans also have a great effect on the actual end user experience. Each one of the metrics conveys an important aspect of the data analysis. As a concrete example, we will examine the percentages that hardware accounted for under each of the metrics (Figure 2). Under number of outages, hardware was accountable for 30 percent of the total outages. Specifically, hardware failures caused 54 of the outages. Customer Minutes presented hardware as being less significant by causing only 19 percent of the customer minutes. This difference between number of outages and customer minutes indicates that hardware caused a significant number of outages, but the outages were either quickly repaired or did not affect very many people. We can extrapolate that this is due to redundant hardware along the PSTN, which shrinks the effects of the hardware failures. Similarly, blocked calls notes hardware is responsible for 25 percent, indicating that the end users are not greatly affected by all hardware failures.
4.1 Related Work Even though our analysis has shown that PSTN failures were dominated by human error, one might question whether this result only pertains to the outage reports for the year 2000. We can address this by comparing our results to published results, which analyzed outage reports between April 1992 and March 1994.
In a study published in 1997, Richard Kuhn studied PSTN failures using the simplistic number of outages and customer minutes metrics, and observed similar trends [2]. In Kuhn’s data, 49% of the outages were due to human error, compared to 54% of our year-2000 data. Not only did human error remain dominant, it also increased by 6% demonstrating that human error is highly influential in system dependability. Unfortunately, Kuhn did not use the more significant blocked calls metric, so direct comparison using this most useful metric is impossible.
5. Conclusion Results show that human error is an important cause of failure for the Public Switched Telephone Network during the year 2000 (Figure 2). This suggests that humans may be the leading cause of failure in computer systems as well, which opens a new area for improvement. Since humans constantly interact with computer systems, something must be done to prevent humans from causing system failure. This insight on the importance of human error in high-dependability computer systems has been a prime motivator for the Recovery Oriented Computing (ROC) project, which is attempting to build dependable computer systems that expect and tolerate human error [4]. Our analysis of the PSTN failure data has demonstrated that the actual end user experience is of utmost importance, making blocked calls the most significant metric of the three that we considered. This becomes particularly important when business and customer satisfaction are put at risk. End users will complain about the lack of service and may be pushed to either end service or switch carriers creating an economic loss for the provider. Capturing the end-user experience becomes far more important when measuring system dependability since we are attempting to pinpoint the areas in which our system must be improved. The metrics should capture what the users see so that the changes
6
that we make to improve the system help the users rather than hurt them. This is a lesson that should be learned by the designers of highly dependable computer systems: systems should incorporate instrumentation for collecting blocked-call-like availability metrics so that their failures can be evaluated from the perspective of the all-important end user experience. Finally note that our analysis was possible because of the thorough reporting of outages required by the FCC. If computer outages were well documented, similar analysis would be possible for computer systems. This would allow us to understand, pinpoint, and work on the systems’ weaknesses, resulting in the creation of more reliable computer systems.
References [1]
Enriquez, P. “Ebay Availability.” June 2001.
Outages
and
[2] D. R. Kuhn. Sources of Failure in the Public Switched Telephone Network. IEEE Computer 30(4), April 1997. [3] Personal Communication, Whitey Thayer, FCC, July 2001. [4] Patterson, D.A., A. Brown, P. Broadwell, G. Candea, M. Chen, J. Cutler, P. Enriquez, A. Fox, E. Kiciman, M. Merzbacher, D. Oppenheimer, N. Sastry, W. Tetzlaff, J. Traupman, N. Treuhaft. Recovery-Oriented Computing (ROC): Motivation, Definition, Techniques, and Case Studies, UC Berkeley Computer Science Technical Report UCB//CSD02-1175, March 15, 2002.
7


![([PDF]) Fundamentals of Dependable Computing for ... - Google Sites](https://m.moam.info/img/260x300/pdf-fundamentals-of-dependable-computing-for-googl_64774b23097c4786708b8cbd.jpg)

