Lessons learned from moving Earth System Grid data sets over a 20 Gbps wide-area network. Raj Kettimuthu,1,2 Alex Sim,3 Dan Gunter,3 Bill Allcock,1 ...
Lessons learned from moving Earth System Grid data sets over a 20 Gbps wide-area network Raj Kettimuthu,1,2 Alex Sim,3 Dan Gunter,3 Bill Allcock,1 Peer-Timo Bremer,5 John Bresnahan,1,2 Andrew Cherry,1 Lisa Childers,1,2 Eli Dart,3 Ian Foster,1,2 Kevin Harms,1 Jason Hick,3 Jason Lee,3 Michael Link,1,2 Jeff Long,4 Keith Miller,5 Vijaya Natarajan,3 Valerio Pascucci,6 Ken Raffenetti,1 David Ressman,1 Dean Williams,4 Loren Wilson,1 Linda Winkler1 1
Argonne National Laboratory, Argonne, IL 2 The University of Chicago, Chicago, IL 3 Lawrence Berkeley National Laboratory, Berkeley, CA 4 Lawrence Livermore National Laboratory, Livermore, CA 5 Data Direct Networks, Chatsworth, CA 6 The University of Utah, Salt Lake City, UT
ABSTRACT In preparation for the Intergovernmental Panel on Climate Change (IPCC) Fifth Assessment Report, the climate community will run the Coupled Model Intercomparison Project phase 5 (CMIP-5) experiments, which are designed to answer crucial questions about future regional climate change and the results of carbon feedback for different mitigation scenarios. The CMIP-5 experiments will generate petabytes of data that must be replicated seamlessly, reliably, and quickly to hundreds of research teams around the globe. As an end-to-end test of the technologies that will be used to perform this task, a multidisciplinary team of researchers moved a small portion (10 TB) of the multimodel Coupled Model Intercomparison Project, Phase 3 data set used in the IPCC Fourth Assessment Report from three sources—the Argonne Leadership Computing Facility (ALCF), Lawrence Livermore National Laboratory (LLNL) and National Energy Research Scientific Computing Center (NERSC)—to the 2009 Supercomputing conference (SC09) show floor in Portland, Oregon, over circuits provided by DOE’s ESnet. The team achieved a sustained data rate of 15 Gb/s on a 20 Gb/s network. More important, this effort provided critical feedback on how to deploy, tune, and monitor the middleware that will be used to replicate the upcoming petascale climate datasets. We report on obstacles overcome and the key lessons learned from this successful bandwidth challenge effort.
1. INTRODUCTION A number of science applications—including climate, highenergy physics, astrophysics, combustion, nanoscience, and genomics—can generate multiple gigabytes to terabytes of data every day. Frequently, this data must be disseminated to remote collaborators or advanced computational centers capable of running the complex, CPU-intensive applications needed to analyze the data. For example, the experiments run for the IPCC Fifth Assessment Report [1] will generate petabytes of data that must be replicated seamlessly, reliably, and quickly to hundreds of research teams around the globe. High-bandwidth, high-latency, long-haul optical networks are becoming increasingly available to researchers and scientists. The DOE ESnet has established a Science Data Network (SDN) that is logically separate from the production IP core network and can provide user-driven bandwidth allocation via dynamic virtual circuits. These dedicated links can be allocated on demand by
bandwidth-hungry applications, providing dedicated network capacity. The networks enable scientific applications to transfer data sets ranging from tens of megabytes to petabytes. In this paper, we report on obstacles overcome and the key lessons learned in moving a small portion (10 TB) of the multimodel Coupled Model Intercomparison Project, Phase 3 data set used in the IPCC Fourth Assessment Report from three sources—the Argonne Leadership Computing Facility (ALCF), Lawrence Livermore National Laboratory (LLNL), and National Energy Research Scientific Computing Center (NERSC)—to the 2009 Supercomputing conference (SC09) show floor in Portland, Oregon. The rest of the paper is organized as follows. In Section 2, we describe our SC09 Bandwidth Challenge demonstration. In Section 3, we provide details on the tuning that was done to get good performance. In Section 4, we present the important lessons learned, and in Section 5, we summarize our conclusions.
2. BANDWIDTH CHALLENGE Data sets were stored at the ALCF, LLNL, and NERSC. Network bandwidth on the SC09 show floor to the GridFTP [2] servers was 20 Gb/s. Circuits were reserved from each site to the SC09 show floor over the ESnet SDN using the On-demand Secure Circuits and Advance Reservation System (OSCARS) [3]. With full network utilization, this configuration is capable of moving 10 TB in about 1.2 hours. Figure 1 shows the configuration of the infrastructure and data flow. During the SC09 Bandwidth Challenge period, we achieved a mean of ~15 Gb/s, or ~75% utilization, and moved about 7 TB of data in an hour from three data sources. The Green Data Oasis (GDO) [4] at LLNL has over 600 TB of spinning disk and serves 45 TB of CMIP-3 multimodel data. Three GridFTP server nodes with Solaris 10 running ZFS on AMD-64 hardware were used with access to the 10 Gb/s ESnet network. Between LLNL and the SC09 show floor, ESnet reserved a 5 Gb/s SDN through OSCARS. Two NERSC Data Transfer Nodes [5] were used to transfer data located on NERSC storage units to the SC09 show floor. Between NERSC and the SC09 show floor, ESnet reserved a 10 Gb/s SDN through OSCARS. Twenty GridFTP servers at the ALCF were used to transfer data located on the ALCF General Parallel File System to the SC09 show floor. These transfer nodes had 1 Gb/s connections to the 10 Gb/s ESnet Science Data Network. Between the ALCF and the SC09 show floor, ESnet reserved a 10 Gb/s SDN through
OSCARS. Data Direct Networks high-performance storage S2A9900 was used at the SC09 show floor to store the transferred data and enable further processing. The Parallel Virtual File System was used initially to allow parallel access to the disk subsystem from the GridFTP servers. Four Intel Nehalem machines with 10 Gb/s Ethernet cards at the SC09 show floor were used to drive the data transfers. The 10 Gb/s Ethernet on these machines was connected to the SC09 network (SCinet) [6] through a switch with a 20 Gb/s uplink to the ESnet SDN circuits.
Figure 1 SC09 Bandwidth Challenge data and network setup diagram
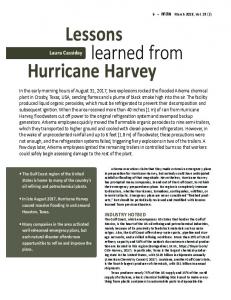
One reason remote users may want to transfer this data set is to visualize it. At SC09, in collaboration with the SciDAC Visualization and Analytics Center for Enabling Technologies [7] team, the transferred CMIP-3 data was used as input to highquality 3D visualizations, which animated 200 years of multimodel averaged surface temperatures and 16 levels of atmospheric temperatures, as shown in Figure 2.
Figure 2 Temperature change from 1900 to 2100
The GridFTP clients’ globus-url-copy [8] and Bulk Data Mover (BDM) [11] were used to drive the data transfers. globus-url-copy supports multiple TCP streams, concurrent transfers, data channel caching, pipelining, and so forth, to achieve high performance. BDM, a data transfer management component developed under the Earth Science Grid project [12], is built on top of Globus GridFTP Java client library. It achieves high performance through a variety of techniques, including multithreaded concurrent transfer connection management, transfer queue management, and single control channel management for multiple data transfers. The transfer management features of BDM and the newly added reliability and load-balancing capabilities in globus-url-copy both played a key role in the challenge. In preparation for the
challenge, 10 TB of source data at LLNL and NERSC was replicated at the ALCF using globus-url-copy and Globus.org [9], a hosted data movement service being developed by the SciDAC Center for Enabling Distributed Petascale Science [10]. The NetLogger toolkit [13] was used to collect, normalize, and analyze the monitoring information from all GridFTP servers. Transfers were visualized in near-real time. A web interface was provided to explore both current and historical data.
3. BULK DATA TRANSFER BASICS Almost all attempts to perform bulk data transfer should attend to some basic considerations: • Enabling Jumbo Frames – Enabling jumbo (Ethernet) frames with up to 9000-byte maximum transmission units (MTUs), as opposed to the default 1500-byte MTUs, can improve WAN performance significantly [14]. Although highperformance science networks and most modern networking gear support 9000-byte MTUs, one should still first check that the end-to-end path supports jumbo frames with a command such as ping -M do -s 9000 dtn01.nersc.gov. In our setup, jumbo frames were enabled end to end from the ALCF and NERSC to the SC09 show floor. However, jumbo frames could not be used on the LLNL-to-SC09 link because of firewall limitations at LLNL. • TCP Buffer Sizes and Limits – In wide-area data movement, performance problems are often caused by small TCP windows. Although TCP autotuning implementations (available on the Linux systems at NERSC and the ALCF, but not on the Solaris systems at LLNL) make manual configuration of buffer sizes unnecessary in most situations, it is still important to set the maximum (system-wide) buffer sizes high enough to enable the TCP autotuning mechanisms to be useful; for details, see [15]. TCP autotuning allows data transfer applications to achieve high performance without requiring the configuration of per-destination TCP parameters. For the Bandwidth Challenge, hosts were configured with at least a 16 MB maximum TCP buffer. • Testing for Packet Loss – Even small amounts of packet loss can significantly affect data transfers over the WAN. One can test for packet loss by capturing tcpdump [16] output with a command such as tcpdump -n -i eth0 -s 96 -w output.dump dtn01.nersc.gov and then analyzing that dump file with a tool such as tcptrace [17]. The graphs created by tcptrace can be viewed with xplot [18]; the time sequence graph, which plots packets sent over time, can be particularly helpful. • Tuning the Network to Prevent Packet Loss – A network administrator can check interface counters for CRC errors and packet drops and check the CPU utilization to make sure that packets are not being switched by the router CPU. CRC errors are often caused by dirty fiber optics, faulty optical transceivers, or failing hardware. If packet drops are found in the output queue, often the router interface queues are undersized and should be increased. Performance problems can also be caused by using router features that are beyond the capabilities of the router’s forwarding hardware, forcing the router to process packets in software.
4. LESSONS LEARNED This section describes key lessons learned from the Bandwidth Challenge effort.
4.1 Checkpointing and Reliability Server bugs and race conditions, file system failures, and network timeouts may cause a client to hang rather than fail. We ran into such issues several times during tests before the challenge, and in response we added a new feature in globus-url-copy to cancel or restart transfers that perform no data movement for a specified period of time. In addition to handling exceptional conditions, transfer checkpoint/restart allows mid-transfer performance tuning; this feature was used a number of times during the Bandwidth Challenge.
Figure 3 Boxplot showing distribution of bandwidth due to load balancing among the GridFTP servers at ALCF
4.2 Load Balancing The parallel file system at the ALCF is optimized for highperformance local access, typically massively parallel local access; this follows directly from the architecture of most modern supercomputers. Specifically, while GPFS can be optimized for single-node I/O of up to 2 GB/s, the GPFS servers at the ALCF are limited to 500–600 MB/s each. Local simulations on the ALCF Blue Gene/P use 128 GPFS fileservers, but for WAN transfers there were only 2 GridFTP servers, and the observed disk I/O rate was much less than 500-600 MB/s from each server. To saturate the available WAN bandwidth, we added more servers: we temporarily allocated 20 “spare” hosts from the ALCF Eureka visualization cluster to run GridFTP. When more than one GridFTP server is used at the endpoints, balancing the load among them is key for optimal utilization of the resources and for good performance. We added new functionality to globus-url-copy that allows concurrent transfers to be spread across multiple hosts rather than multiple connections to the same host; previously this was possible only with changes to the domain name system. This functionality was critical to maximize the throughput. Figure 3 shows how the transfer was load balanced among the 20 nodes.
4.3 Optimal Transfer Queue Management Transfer queue management and concurrency management contribute to more transfer throughput, including both network and storage. When many small files are in the dataset, continuous data flow from the storage into the network can be achieved by prefetching data from storage on to the transfer queue of each concurrent transfer connection. This overlapping of storage I/O with the network I/O helps improve the performance. NetLogger analyses provided valuable information on time-varying patterns in the overlap between multiple concurrent transfers for tuning the BDM queue and concurrency management algorithms. Figure 4 shows the results from the effect of transfer queue and
concurrency management. When the transfer queue and concurrency are well managed), the number of concurrent data transfers shows consistent over time, compared to the ill- or nonmanaged data transfers, and it contributes to the higher overall throughput performance.
4.4 Concurrent Transfers Using parallel TCP streams improves the performance of datasets with large files. The pipelining technique in GridFTP improves
Figure 4 Transfer queue management and concurrency algorithms affect throughput over time on data transfers from LLNL to NERSC, showing poorly managed queue and concurrency in the top row and optimized queue and concurrency in the bottom, for the number of overlapping concurrent transfers on the left and the transfer throughput over time on the right. (image generated by NetLogger)
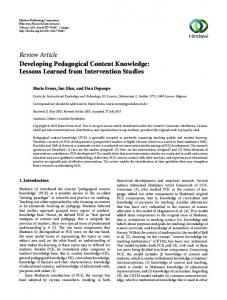
the performance of datasets with lots of small files. Parallel TCP streams can hurt the performance of files whose size is less than a certain threshold based on the available network bandwidth. When the data set consists of a mix of large and small files, like the climate data set used for the challenge, it is tricky to use a combination of parallel streams and pipelining to maximize the performance. Figure 5 shows the file size distribution from the 10 TB dataset in IPCC CMIP-3. Most of the data files have less than 200 MB of file size, and among those smaller files, 10-20 MB file size range has the biggest portion. So, in most climate datasets, about one-fourth of a dataset has less than 20 MB in file sizes. Concurrent transfers are known to improve the performance of data sets with lots of small files. As in Figure 6, BDM manages a DB queue for balanced access to DB from the concurrent transfer connections, and manages the transfer queues for concurrent file transfers. Each transfer queue checks a configurable threshold for the queued total files size and gets more files to transfer from the DB queue when the queued total files size goes below the configured threshold. Our experiences both before and during the challenge show that concurrent transfers are effective in maximizing the throughput for data sets comprising a mix of large and small files.
4.5 Transfer Performance Estimation The NetLogger toolkit collected the GridFTP logs, which contained one set of values for each file transferred. Many files were transferred from each GridFTP server in parallel, so NetLogger calculated the approximate total bandwidth by summing the mean bandwidth of overlapping transfers. For the Bandwidth Challenge, we had the router’s view of these same transfers. We found that NetLogger’s estimation is consistently lower than the (time-averaged) packet rates reported by the SCinet
Figure 5 File size distribution of the 10TB climate dataset in IPCC CMIP-3, showing majority of dataset file sizes less than 200MB (shown left), and majority of smaller files are around 10-20MB range (shown right)
routers, as one can see in Figure 7; there are also several subfeatures that differ. We plan to run experiments with detailed monitoring (i.e., packet traces) to evaluate other models.
4.6 Performance Tuning on Solaris Several diagnostic tools under Solaris 10 were useful for debugging and tuning performance issues. While network bandwidth was a focal area, other aspects of the system needed to be reviewed in concert. The average service time for disk requests was a good indicator of overall performance; seeing the value ascv_t in single digits when running “iostat -xnz 3” was the goal. Memory status was monitored with vmstat. Looking for dropped network packets was done with “netstat -sP tcp.” Local bandwidth was monitored via kernel statistics through the kstat program: “kstat myri10ge | grep dma.” In addition, we found that the fault management services (CAM) daemon had a noticeable impact on performance. When the daemon was in the running state I/O rates went down; when the daemon was idle, I/O rates went up. After killing the process, I/O rates stayed consistently high. This behavior was likely due to the back-end storage system being in a suboptimal state. The lack of TCP autotuning under Solaris made it difficult to get optimal performance. Various TCP buffer settings were used to
Figure 7 NetLogger estimated (left) and SCinet reported (right) cumulative bandwidth for the Bandwidth Challenge run. For SCinet, major y-axis lines are from 0 to 17.5 Gb/s in increments of 2.5 Gb/s.
numbers of clients (compute hosts) over extremely low-latency networks with strong delivery guarantees; whereas wide area data transfers involve a few servers connected to relatively small numbers of clients (with relatively small parallelism per client) over large bandwidth-delay product networks with nontrivial packet loss. This situation makes it clear why the DOE supercomputer centers have been installing dedicated hosts, referred to as data transfer nodes, for wide area transfers. Dedicated resources allow user facilities to provide significantly higher wide area data transfer performance to scientific users and applications, with corresponding increases in scientific productivity. When coupled with the bandwidth and service guarantees provided by virtual circuit services such as those offered by today’s high-performance networks (e.g., ESnet’s SDN), dedicated data transfer resources provide a foundation for building high-performance science infrastructure for multiple disciplines, including climate science.
ACKNOWLEDGMENTS This work was funded in part by the Office of Advanced Scientific Computing Research, Office of Science, U.S. Department of Energy, under contracts DE-AC03-76SF00098 and DE-AC02-05CH11231.
REFERENCES [1] http://www.ipcc.ch/index.htm [2] Allcock, W., Bresnahan, J., Kettimuthu, R., Link, M., Dumitrescu,
Figure 6 Transfer queue and concurrency design in the BDM
improve WAN performance, but results varied depending on the size of files being transferred and the number of connections open.
5. SUMMARY This challenge highlighted the importance of higher-level transfer management abilities to add parallelism and reliability on top of high-performance data movers (i.e., GridFTP). The challenge also showed the usefulness of monitoring for performance tuning. Even with these tools, end-host tuning issues arose, particularly at the interface between the GridFTP host and local parallel file system. This result should not be surprising because most of the aspects of a parallel filesystem that contribute to high performance of local transfers are either unavailable or counterproductive to bulk data transfer over a WAN: local transfers involve large numbers of servers connected to huge
[3] [4] [5] [6] [7] [8] [9] [10] [11] [12] [13] [14] [15] [16] [17] [18]
C., Raicu, I., and Foster, I. 2005. The Globus Striped GridFTP Framework and Server. In Proceedings of the 2005 ACM/IEEE Conference on Supercomputing (November 12 - 18, 2005). http://www.es.net/OSCARS/ https://computing.llnl.gov/resources/gdo/ http://www.nersc.gov/nusers/systems/datatran/ https://scinet.supercomputing.org/ http://www.vacet.org/ http://www.globus.org/toolkit/docs/5.0/5.0.0/data/gridftp/user/#glob us-url-copy http://dev.globus.org/images/e/e1/SC09-globusDotOrg-datasheet.pdf http://www.cedps.net/ https://sdm.lbl.gov/bdm/ http://www.earthsystemgrid.org/ B. Tierney and D. Gunter. "NetLogger: A Toolkit for Distributed System Tuning and Debugging". IFIP/IEEE Intl Symposium on Integrated Network Management Colorado Springs, CO, 2003 http://staff.psc.edu/mathis/MTU/ http://fasterdata.es.net/ http://www.tcpdump.org/ http://www.tcptrace.org/ http://www.xplot.org