PHYSICAL REVIEW E 79, 041920 共2009兲
Levels of complexity in scale-invariant neural signals Plamen Ch. Ivanov,1,2,3,* Qianli D. Y. Ma,2,4 Ronny P. Bartsch,2 Jeffrey M. Hausdorff,5,6 Luís A. Nunes Amaral,7 Verena Schulte-Frohlinde,1 H. Eugene Stanley,1 and Mitsuru Yoneyama8 1
Department of Physics and Center for Polymer Studies, Boston University, Boston, Massachusetts 02215, USA Harvard Medical School and Division of Sleep Medicine, Brigham and Women’s Hospital, Boston, Massachusetts 02115, USA 3 Institute of Solid State Physics, Bulgarian Academy of Sciences, Sofia 1784, Bulgaria 4 Nanjing University of Posts and Telecommunications, Nanjing 210003, China 5 Tel-Aviv Sourasky Medical Center and Tel-Aviv University, Tel-Aviv 69978, Israel 6 Harvard Medical School, Boston, Massachusetts 02115, USA 7 Department of Chemical Engineering, Northwestern University, Evanson, Illinois 60208, USA 8 Mitsubishi Chemical Group, Science and Technology Center Inc., Yokohama 227-8502, Japan 共Received 5 May 2004; revised manuscript received 3 January 2009; published 21 April 2009兲
2
Many physical and physiological signals exhibit complex scale-invariant features characterized by 1 / f scaling and long-range power-law correlations, indicating a possibly common control mechanism. Specifically, it has been suggested that dynamical processes, influenced by inputs and feedback on multiple time scales, may be sufficient to give rise to 1 / f scaling and scale invariance. Two examples of physiologic signals that are the output of hierarchical multiscale physiologic systems under neural control are the human heartbeat and human gait. Here we show that while both cardiac interbeat interval and gait interstride interval time series under healthy conditions have comparable 1 / f scaling, they still may belong to different complexity classes. Our analysis of the multifractal scaling exponents of the fluctuations in these two signals demonstrates that in contrast to the multifractal behavior found in healthy heartbeat dynamics, gait time series exhibit less complex, close to monofractal behavior. Further, we find strong anticorrelations in the sign and close to random behavior for the magnitude of gait fluctuations at short and intermediate time scales, in contrast to weak anticorrelations in the sign and strong positive correlation for the magnitude of heartbeat interval fluctuations—suggesting that the neural mechanisms of cardiac and gait control exhibit different linear and nonlinear features. These findings are of interest because they underscore the limitations of traditional two-point correlation methods in fully characterizing physiological and physical dynamics. In addition, these results suggest that different mechanisms of control may be responsible for varying levels of complexity observed in physiological systems under neural regulation and in physical systems that possess similar 1 / f scaling. DOI: 10.1103/PhysRevE.79.041920
PACS number共s兲: 87.10.⫺e, 87.19.Hh, 05.45.Tp, 05.40.⫺a
I. INTRODUCTION
Many dynamic systems generate outputs with fluctuations characterized by 1 / f-like scaling of the power spectra, S共f兲, where f is the frequency. These fluctuations are often associated with nonequilibrium dynamic systems possessing multiple degrees of freedom 关1,2兴, rather than being the output of a classic “homeostatic” process 关3–5兴. It is generally assumed that the presence of many components interacting over a wide range of time or space scales could be the reason for the 1 / f spectrum in the fluctuations 关6,7兴. Fluctuations exhibiting 1 / f-like behavior are often termed “complex,” since they obey a scaling law indicating a hierarchical fractal organization of their frequency 共time scale兲 components rather than being dominated by a single frequency. 1 / f behavior is common in a variety of physical, biological, and social systems 关7–15兴. The ubiquity of the 1 / f scaleinvariant phenomenon has triggered in recent years the development of generic mechanisms describing complex systems, independent of their particular context, in order to understand the “unifying” features of these systems 关16–19兴. To evaluate whether fluctuations in signals generated by integrated physiological systems exhibit the same level of
*Corresponding author;
[email protected] 1539-3755/2009/79共4兲/041920共12兲
complexity, we analyze and compare the time series generated by two physiologic control systems under multiplecomponent integrated neural control—the human gait and the human heartbeat. We chose these two particular examples because human gait and heartbeat control share certain fundamental properties, e.g., both originate in oscillatory centers. In the case of the heart, the pacemaker is located in the sinus node in the right atrium 关20兴. For gait, pacemakers called central pattern generators are thought to be located in the spinal cord 关21兴. However, these two systems are distinct suggesting possible dynamical differences in their output. For example, heartbeat fluctuations are primarily controlled by the involuntary 共autonomic兲 nervous system. In contrast, while the spontaneous walking rhythm is an automaticlike process, voluntary inputs play a major role. Further, gait control resides in the basal ganglia and related motor areas of the central nervous system, while the heartbeat is controlled by the sympathetic and parasympathetic branches of the autonomic nervous system 关20,22兴. Previous studies show comparable two-point linear correlations and 1 / f power spectra in heart rate 关23–27兴 and human gait 关28–31兴 suggesting that differences in physiologic control may not be manifested in beat-to-beat and interstride interval fluctuations. Recent studies focusing on higher order correlations and nonlinear properties show that the human
041920-1
©2009 The American Physical Society
PHYSICAL REVIEW E 79, 041920 共2009兲
IVANOV et al.
heartbeat exhibits not only 1 / f fractal but also multifractal properties 关32兴. Since multifractal signals require many scaling indices to fully characterize their scaling properties, they may be considered to be more complex than those characterized by a single fractal dimension such as classical 1 / f noise. Although the origins of the multifractal features in heartbeat dynamics are not yet understood, there is evidence that they relate to the complex intrinsic neuroautonomic regulation of the heart 关32,33兴. Human gait, e.g., free unconstrained walking, is also a physiological process regulated by complex hierarchical feedback mechanisms involving supraspinal inputs 关21兴. Moreover, recent findings indicate that the scaling properties of gait fluctuations relate to neural centers on the higher supraspinal level rather than to lower motor neurons or environmental inputs 关34,35兴. Thus, it would be natural to hypothesize that the fluctuations in healthy unconstrained human gait exhibit similar fractal and multifractal features as heartbeat fluctuations, and that human gait dynamics may belong to the same “complexity class” as cardiac dynamics. We employ two techniques—magnitude and sign decomposition analysis 关36,37兴, and multifractal analysis 关38,39兴—to probe long-term nonlinear features, and to compare the levels of complexity in heartbeat and interstride interval fluctuations. To this end, we analyze interstride interval time series from ten young healthy men 共mean age 22 years兲 with no history of neuromuscular disorders 关40兴. Subjects walked continuously for 1 h at a self-selected usual pace on level ground around a flat, obstacle-free, approximately oval, 400 m long path. The interstride interval was measured using a ground reaction force sensor—ultrathin force-sensitive switches were taped inside one shoe and data were recorded on an ambulatory recorder using a previously validated method 关41兴. We compare the results of our gait analysis with results we have previously obtained 关32,36,42,43兴 from 6-h-long heartbeat interval records from 18 healthy individuals 共13 female and 5 male, mean age 34 years兲 during daily activity 共12:00 to 18:00兲 关40兴. As described below, we systematically compare the scaling properties of the fluctuations in human gait with those in the human heartbeat using power spectral analysis, detrended fluctuation analysis 共DFA兲, magnitude, and sign decomposition analysis, and wavelet-based multifractal analysis, and we quantify linear and nonlinear features in the data over a range of time scales.
共i兲 Given the original signal s共i兲, where i = 1 , . . . , Nmax and Nmax is the length of the signal, we first form the profile k 关s共i兲 − 具s典兴, where 具s典 is the mean. One function y共k兲 ⬅ 兺i=1 can consider the profile y共k兲 as the position of a random walk in one dimension after k steps. 共ii兲 We divide the profile y共k兲 into nonoverlapping segments of equal length n. 共iii兲 In each segment of length n, we fit y共k兲, using a polynomial function of order ᐉ which represents the polynomial trend in that segment. The y coordinate of the fit line in each segment is denoted by y n共k兲. Since we use a polynomial fit of order ᐉ, we denote the algorithm as DFA-ᐉ. 共iv兲 The profile function y共k兲 is detrended by subtracting the local trend y n共k兲 in each segment of length n. In DFA-ᐉ, trends of order ᐉ − 1 in the original signal are eliminated. Thus, comparison of the results for different orders of DFA-ᐉ allows us to estimate the type of polynomial trends in the time series s共i兲. 共v兲 For a given segment of length n, the root-mean-square 共rms兲 fluctuation for this integrated and detrended signal s共i兲 is calculated: F共n兲 ⬅
冑
Nmax
F共n兲 ⬃ n␣ .
共1兲
共2兲
Thus, the DFA method can quantify the temporal organization of the fluctuations in a given signal s共i兲 by a single scaling exponent ␣—a self-similarity parameter which represents the long-range power-law correlation properties of the signal. If ␣ = 0.5, there is no correlation and the signal is uncorrelated 共white noise兲; if ␣ ⬍ 0.5, the signal is anticorrelated; if ␣ ⬎ 0.5, the signal is correlated. The larger the value of ␣, the stronger the correlations in the signal. For stationary signals with scale-invariant temporal organization, F共n兲 is related to the Fourier power spectrum S共f兲 and to the autocorrelation function C共n兲. For such signals, S共f兲 ⬃ f −,
The DFA method was developed because conventional fluctuation analyses such as power spectral, R/S and Hurst analysis cannot be reliably used to study nonstationary data 关44–48兴. One advantage of the DFA method is that it allows the detection of long-range power-law correlations in noisy signals with embedded polynomial trends that can mask the true correlations in the fluctuations of a signal. The DFA method has been successfully applied to a wide range of research fields in physics 关49–52兴, biology 关53–56兴, and physiology 关57–60兴. The DFA method involves the following steps 关44兴:
关y共k兲 − y n共k兲兴2 . 兺 k=1
共vi兲 Since we are interested in how F共n兲 depends on the segment length, the above computation is repeated for a broad range of scales n. A power-law relation between the average root-meansquare fluctuation function F共n兲 and the segment length n indicates the presence of scaling:
II. METHODS A. DFA
Nmax
1
where 关 = 2␣ − 1兴
共3兲
and ␣ is the DFA scaling exponent 关Eq. 共2兲兴 关44兴. Thus, signals with 1 / f scaling in the power spectrum 共i.e.,  = 1兲 are characterized by DFA exponent ␣ = 1. If 0.5⬍ ␣ ⬍ 1, the correlation exponent ␥ describes the decay of the autocorrelation function: C共n兲 ⬅ 具s共i兲s共i + n兲典 ⬃ n−␥,
where 关␥ = 2 − 2␣兴. 共4兲
B. Magnitude and sign decomposition method
Fluctuations in the dynamical output of physical and physiological systems can be characterized by their magnitude 共absolute value兲 and their direction 共sign兲. These two
041920-2
LEVELS OF COMPLEXITY IN SCALE-INVARIANT …
PHYSICAL REVIEW E 79, 041920 共2009兲
quantities reflect the underlying interactions in a given system—the resulting “force” of these interactions at each moment determines the magnitude and the direction of the fluctuations. To assess the information contained in these fluctuations, the magnitude and sign decomposition method was introduced 关36,37兴. This method involves the following steps: 共i兲 Given the original signal s共i兲 we generate the increment series, ⌬s共i兲 ⬅ s共i + 1兲 − s共i兲. 共ii兲 We decompose the increment series into a magnitude series 兩⌬s共i兲兩 and a sign series sign关⌬s共i兲兴. 共iii兲 To avoid artificial trends we subtract from the magnitude and sign series their average. 共iv兲 We then integrate both magnitude and sign series, because of limitations in the accuracy of the DFA method for estimating the scaling exponents of anticorrelated signals 共␣ ⬍ 0.5兲. 共v兲 We perform a scaling analysis using second-order detrended fluctuation analysis 共DFA-2兲 on the integrated magnitude and sign series. 共vi兲 To obtain the scaling exponents for the magnitude and sign series, we measure the slope of F共n兲 / n on a log-log plot, where F共n兲 is the root-mean-square fluctuation function obtained using DFA-2 and n is the scale. Fluctuations following an identical 1 / f scaling law can exhibit different types of correlations for the magnitude and the sign—e.g., a signal with anticorrelated fluctuations can exhibit positive correlations in the magnitude. Positive correlations in the magnitude series indicate that an increment with large magnitude is more likely to be followed by an increment with large magnitude. Anticorrelations in the sign series indicate that a positive increment in the original signal is more likely to be followed by a negative increment. Further, positive power-law correlations in the magnitude series indicate the presence of long-term nonlinear features in the original signal, and relate to the width of the multifractal spectrum 关37兴. In contrast, the sign series relates to the linear properties of the original signal 关37兴. The magnitude and sign decomposition method is suitable to probe nonlinear properties in short nonstationary signals, such as 1 h interstride interval time series.
The multifractal approach, a concept introduced in the context of multiaffine functions 关78–81兴, has the potential to describe a wide class of signals more complex than those characterized by a single fractal dimension. The singular behavior of a signal s共t兲 at time t0 — 兩s共t兲 − Pn共t兲兩 ⬃ 兩t − t0兩h共t0兲 for t → t0—is characterized by the local Hurst exponent h共t0兲 where n ⬍ h共t0兲 ⬍ n + 1 and Pn共t兲 is a polynomial fit of order n. To avoid an ad hoc choice of the range of time scales over which the local Hurst exponent h is estimated, and to filter out possible polynomial trends in the data which can mask local singularities, we implement a wavelet-based algorithm 关39兴. Wavelets are designed to probe time series over a broad range of scales and have recently been successfully used in the analysis of physiological signals 关82–90兴. In particular, recent studies have shown that the wavelet decomposition reveals a robust self-similar hierarchical organization in heartbeat fluctuations, with bifurcations propagating from large to small scales 关43,91,92兴. To quantify hierarchical cascades in gait dynamics and to avoid inherent numerical instability in the estimate of the local Hurst exponent, we employ a “mean-field” approach—a concept introduced in statistical physics 关1兴—which allows us to probe the collective behavior of local singularities throughout an entire signal and over a broad range of time scales. We study the multifractal properties of interstride interval time series by applying the wavelet transform modulus maxima 共WTMM兲 method 关38,39,93兴 that has been proposed as a mean-field generalized multifractal formalism for fractal signals. We first obtain the wavelet coefficient at time t0 from the continuous wavelet transform defined as N
Wa共t0兲 ⬅ a
−1
s共t兲关共t − t0兲/a兴, 兺 t=1
where s共t兲 is the analyzed time series, is the analyzing wavelet function, a is the wavelet scale 共i.e., time scale of the analysis兲, and N is the number of data points in the time series. For we use the third derivative of the Gaussian, thus filtering out up to second-order polynomial trends in the data. We then choose the modulus of the wavelet coefficients at each point t in the time series for a fixed wavelet scale a. Next, we estimate the partition function Zq共a兲 ⬅ 兺 兩Wa共t兲兩q ,
C. Wavelet-based multifractal analysis
Previously, analyses of the fractal properties of physiologic fluctuations revealed that the behavior of healthy, free-running physiologic systems may often be characterized as 1 / f-like 关19,23–27,29,35,41,61–72兴. Monofractal signals 共such as classical 1 / f noise兲 are homogeneous, i.e., they have the same scaling properties throughout the entire signal 关73–75兴. Monofractal signals can therefore be indexed by a single exponent: the Hurst exponent H 关76兴. On the other hand, multifractal signals are nonlinear and inhomogeneous with local properties changing with time. Multifractal signals can be decomposed into many subsets characterized by different local Hurst exponents h, which quantify the local singular behavior and relate to the local scaling of the time series. Thus, multifractal signals require many exponents to fully characterize their properties 关77兴.
共5兲
共6兲
i
where the sum is only over the maxima values of 兩Wa共t兲兩, and the powers q take on real values. By not summing over the entire set of wavelet transform coefficients along the time series at a given scale a but only over the wavelet transform modulus maxima, we focus on the fractal structure of the temporal organization of the singularities in the signal 关93兴. We repeat the procedure for different values of the wavelet scale a to estimate the scaling behavior Zq共a兲 ⬃ a共q兲 .
共7兲
Analogous to what occurs in scale-free physical systems, in which phenomena controlled by the same mechanism over multiple time scales are characterized by scale-independent measures, we assume that the scale-independent measures,
041920-3
PHYSICAL REVIEW E 79, 041920 共2009兲
(a)
0
10
Healthy Gait
β=-1.1
-1
1.3
Healthy Heartbeat Healthy Gait
10
S(f)
Interbeat Interval [s] Interstride Interval [s]
IVANOV et al.
1.2
-2
10
-3
10
-4
1.1 (b)
-5
Healthy Heartbeat
10
0.7
-3
10
-2
10
-1
-1
10
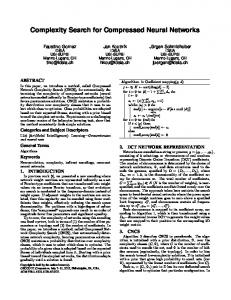
f [index ] FIG. 2. 共Color online兲 Power spectra of the gait ISI series 共䉱兲 and heartbeat RR series 共쎲兲 displayed in Fig. 1, indicating a similar 1 / f-type behavior.
0.6 0.5
β=-1
10
0
1000
2000
3000
index FIG. 1. Representative records of 共a兲 interstride interval 共ISI兲 time series from a healthy subject and 共b兲 consecutive heartbeat 共RR兲 intervals from a healthy subject.
共q兲, depend only on the underlying mechanism controlling the system. Thus, by studying the scaling behavior of Z共a , q兲 ⬃ a共q兲 we may obtain information about the selfsimilar 共fractal兲 properties of the mechanism underlying gait control. For certain values of the powers q, the exponents 共q兲 have familiar meanings. In particular, 共2兲 is related to the scaling exponent of the Fourier power spectra, S共f兲 ⬃ 1 / f , as  = 2 + 共2兲 关39兴. For positive q, Zq共a兲 reflects the scaling of the large fluctuations and strong singularities in the signal, while for negative q, Zq共a兲 reflects the scaling of the small fluctuations and weak singularities 关74,77,94兴. Thus, the scaling exponents 共q兲 can reveal different aspects of the underlying dynamics. In the framework of this wavelet-based multifractal formalism, 共q兲 is the Legendre transform of the singularity spectrum D共h兲 defined as the Hausdorff dimension of the set of points t in the signal s共t兲 where the local Hurst exponent is h. Homogeneous monofractal signals—i.e., signals with a single local Hurst exponent h —are characterized by linear 共q兲 spectrum: 共q兲 = qH − 1,
共8兲
where H ⬅ h = d共q兲 / dq is the global Hurst exponent. On the contrary, a nonlinear 共q兲 curve is the signature of nonhomogeneous signals that display multifractal properties—i.e., h共t兲 is a varying quantity that depends upon t. III. RESULTS
In Fig. 1 we show two example time series: 共i兲 an interstride interval time series from a typical healthy subject during ⬇1 h 共N = 3000 steps兲 of unconstrained normal walking on a level, obstacle-free surface 关Fig. 1共a兲兴 关40兴; 共ii兲 consecutive heartbeat intervals from ⬇1 h 共N = 3000 beats兲 record of
a typical healthy subject during daily activity 关Fig. 1共b兲兴 关40兴. Both time series exhibit irregular fluctuations and nonstationary behavior characterized by different local trends; in fact it is difficult to differentiate between the two time series by visual inspection. We first examine the two-point correlations and scaleinvariant behavior of the time series shown in Fig. 1. Power spectra S共f兲 of the gait and heartbeat time series 共Fig. 2兲 indicate that both processes are described by a power-law relation S共f兲 ⬃ 1 / f  over more than 2 decades, with exponent  ⬇ 1. This scaling behavior indicates self-similar 共fractal兲 properties of the data over a broad range of time scales, suggestive of an identical level of complexity as quantified by this linear measure. We obtain similar results for the interstride interval time series from all subjects in our gait database:  = 0.9⫾ 0.08 共group mean ⫾ std. dev.兲 in agreement with previous results 关35兴. A. DFA
Next, to quantify the degree of correlation in the interstride and heartbeat fluctuations we apply the DFA method, which also provides a linear measure: plots of the root-meansquare fluctuation function F共n兲 vs time scale n 共measured in stride or beat number兲 from a second-order DFA analysis 共DFA-2兲 关44–46兴 indicate the presence of long-range powerlaw correlations in both gait and heartbeat fluctuations 关Fig. 3共a兲兴. The scaling exponent ␣ ⬇ 0.95 for the heartbeat signal, shown in Fig. 1共b兲, is very close to the exponent ␣ ⬇ 0.9 for the interstride interval signal, shown in Fig. 1共a兲, estimated over the scaling range 6 ⬍ n ⬍ 600, where nmax ⬇ N / 5 = 600 is the maximal time scale for which the DFA scaling analysis is reliable 关45,46兴. We obtain similar results for the remaining subjects: ␣ = 0.87⫾ 0.03 共group mean ⫾ std. dev.兲 for the gait data 共in agreement with 关35兴兲 and ␣ = 1.01⫾ 0.06 for the heartbeat data 共in agreement with 关42兴兲. The results of both power spectral analysis and the DFA method indicate that gait and heartbeat time series have similar scale-invariant properties suggesting certain parallels in the underlying mechanisms of neural regulation. B. Magnitude and sign decomposition method
To probe for long-term nonlinear features in the dynamics of interstride intervals we employ the magnitude and sign
041920-4
LEVELS OF COMPLEXITY IN SCALE-INVARIANT …
PHYSICAL REVIEW E 79, 041920 共2009兲
(a) Original Signal 0
10
α=0.95
F(n)
-1
10
α=0.9
-2
10
Heartbeat: phase-randomized data Gait: phase-randomized data
-3
10
1
2
10
(a)
3
10
10
time scale n
(b) Magnitude of Increments αmag=0.7
F(n)/n
-2
10
-3
αmag=0.5
10
1
2
10
(b)
3
10 time scale n
10
0
F(n)/n
10
-1
(c) Sign of Increments 1 =0.45 sign
α
3 =0.45 sign
α
2 =0.2 sign
α
10
2 =0.45 sign
α
-2
10
(c)
1 =0.05 sign
α
1
10
2
10 time scale n
3
10
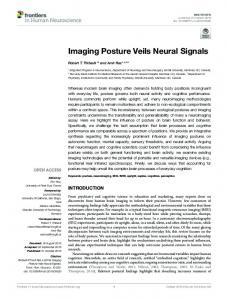
FIG. 3. 共Color online兲 Plots of the root-mean-square fluctuation function F共n兲 vs time scale n 共measured in interstride or heartbeat number兲 from second-order DFA-2 analysis for 共a兲 the gait ISI 共䉱兲 and heartbeat RR 共쎲兲 time series, 共b兲 the magnitude series, and 共c兲 sign series of the interstride and heartbeat increments ⌬ISI and ⌬RR. The results shown in 共a兲, 共b兲, and 共c兲 are obtained for the gait and heartbeat signals displayed in Figs. 1共a兲 and 1共b兲. While both gait and cardiac dynamics exhibit similar power-law and correlations, the magnitude and sign series of interstride and heartbeat increments in 共b兲 and 共c兲 follow significantly different scaling relations. Open symbols 共䉭, 䊊兲 represent the results of a Fourier phase-randomization test indicating high degree of nonlinearity 共␣mag ⬇ 0.7⬎ 0.5兲 in cardiac dynamics, in contrast to a linear behavior 共␣mag ⬇ 0.5兲 for gait dynamics.
decomposition analysis 关36,37兴. Previous studies have demonstrated that information about the nonlinear properties of heartbeat dynamics can be quantified by long-range powerlaw correlations in the magnitude of the increments in heartbeat intervals 关36兴. Further, positive correlations in the mag-
nitude are associated with nonlinear features in the underlying dynamics. In contrast, linear signals are characterized by an absence of correlations 共random behavior兲 in the magnitude series. To quantify the correlations in the magnitude of the interstride increments we apply the DFA-2 method to the gait data displayed in Fig. 1共a兲. Our results show that the magnitude series of the interstride increments exhibits close to random behavior with correlation exponent ␣mag ⬇ 0.5 关denoted by 共䉱兲 in Fig. 3共b兲兴 suggesting linear properties of the underlying dynamics. In contrast, for the heartbeat data displayed in Fig. 1共b兲, we find that the magnitude series of the interbeat interval fluctuations exhibits strong positive correlations over more than two decades characterized by exponent ␣mag ⬇ 0.7 关denoted by 共쎲兲 in Fig. 3共b兲兴 suggesting nonlinear features in cardiac control. Thus, the striking difference in the magnitude correlations of gait and heartbeat dynamics 共both of which are under multilevel neural control兲 raises the possibility that these two physiologic processes belong to different classes of complexity whereby the neural regulation of the heartbeat is inherently more nonlinear, over a range of time scales, than the neural mechanism of gait control. Our observation of a low degree of nonlinearity in the gait time series is supported by the remaining subjects in the group: over time scales 6 ⬍ n ⬍ 600, we obtain exponent ␣mag = 0.51⫾ 0.03 共group mean ⫾ std. dev.兲 for the gait time series, which is significantly lower than the corresponding exponent ␣mag = 0.71⫾ 0.09 obtained for the heartbeat data 共p = 2.7⫻ 10−7, by the Student’s t test兲. We note however, in the short-range region for time scales 6 ⬍ n ⬍ 16 we obtain a group average exponent ␣mag = 0.62⫾ 0.05 for the gait data, and ␣mag = 0.57⫾ 0.12 for the heartbeat data 共Table I兲, indicating a very similar 共and relatively low兲 degree of nonlinearity in both gait and cardiac dynamics at short time scales of up to ⬇15 s 共with p − value= 0.16 by the Student’s t test兲. This nonlinear behavior changes significantly at intermediate and large time scales, where cardiac dynamics is characterized by a high degree of nonlinearity 共␣mag ⬇ 0.8兲, in contrast to gait dynamics which exhibits practically linear behavior 共␣mag ⬇ 0.5兲 共see Table I兲. To further test for nonlinear features in the mechanisms of neural control generating heartbeat and gait dynamics we perform a Fourier phase-randomization surrogate test 关95,96兴. We first perform a Fourier transform of the original data. Next we eliminate the nonlinearity in the data by randomizing the Fourier phases while preserving the Fourier coefficients, and thus keeping the linear properties 共power spectrum and correlation兲 of the original signal unchanged. An inverse Fourier transform leads to a linearized surrogate signal with identical correlations as in the original data. The results of Fourier phase-randomization test for gait and heartbeat data are shown in Fig. 3. While the DFA scaling curves remain as expected, unchanged after the test for both gait and heartbeat signals 关Fig. 3共a兲, open symbols兴, the scaling curve for the magnitude of heartbeat fluctuations changes dramatically to ␣ ⬇ 0.5, in contrast to the gait data, where the magnitude scaling curve remains practically unchanged 关Fig. 3共b兲, open symbols兴. These findings confirm our results from the magnitude analysis indicating that the multilevel neural control mechanism of gait surprisingly generates close to linear dynamics.
041920-5
PHYSICAL REVIEW E 79, 041920 共2009兲
IVANOV et al.
Original
␣ ␣1 ␣2 ␣3
0.87⫾ 0.03 0.71⫾ 0.08 0.84⫾ 0.06 0.89⫾ 0.06
Magnitude Gait 0.51⫾ 0.03 0.62⫾ 0.05 0.53⫾ 0.07 0.50⫾ 0.08
0.41⫾ 0.05 0.05⫾ 0.03 0.40⫾ 0.03 0.48⫾ 0.12
␣ ␣1 ␣2 ␣3
Heartbeat 1.01⫾ 0.06 0.71⫾ 0.09 1.34⫾ 0.22 0.57⫾ 0.12 0.97⫾ 0.12 0.67⫾ 0.09 1.02⫾ 0.10 0.80⫾ 0.12
0.35⫾ 0.03 0.45⫾ 0.13 0.23⫾ 0.08 0.45⫾ 0.05
(a) Human Gait: All Subjects
-1
α=0.9
-2
αmag=0.5
10
10
ISI
|∆ISI|
sign(∆ISI) -3
10
2
-4
Sign
10
α
-1
α
1 =0.05 sign 1
=0.45
sign
2
10
(a)
3
10
10
time scale n
(b) Human Gait: Individual Subject ISI Six 10-min segments
10
F(n)
Measure
0
10
F(n)
TABLE I. Results of the DFA analysis of the original gait ISI and heartbeat RR interval signals, and the magnitude and sign of interstride and heartbeat interval increments, ⌬ISI and ⌬RR for 1 h gait recordings from ten healthy subjects and 6 h ECG recordings from 18 healthy subjects. We calculate the scaling exponents ␣ over a broad range of time scales 6 ⬍ n ⱕ 600, as well as in three different regions: 共i兲 the short-range regime for time scales 6 ⬍ n ⬍ 16 with scaling exponent ␣1, 共ii兲 the intermediate regime for time scales 16ⱕ n ⱕ 64 with scaling exponent ␣2, 共iii兲 and the long-range regime for time scales 64⬍ n ⱕ 600 with scaling exponent ␣3. For each measure, the group average ⫾1 standard deviation is presented.
α=0.9 |∆ISI|
αmag=0.5
-2
10
sign(∆ISI) -3
10
Previous studies have shown that the time series composed of the sign of the consecutive increments in the original signal contain information about the underlying dynamics which is complementary and independent from the original and the magnitude series 关36,37,97,98兴. Our DFA scaling analysis of the sign series shows a complex and significantly different behavior for heartbeat and gait dynamics. A very strong anticorrelated behavior at small time scales with ␣sign ⬇ 0.05 is followed by a crossover to much weaker anticorrelations with ␣sign ⬇ 0.45 as shown in Fig. 3共c兲 for the gait data displayed in Fig. 1共a兲. This is in contrast to the scaling behavior of the heartbeat sign series, which exhibits weak anticorrelations 共␣sign ⬇ 0.45兲 at both short and long time scales with a crossover region at intermediate scales 关Fig. 3共c兲兴. These observations are supported by the remaining subjects in the group: over time scales 6 ⬍ n ⬍ 16, we obtain exponent ␣sign = 0.05⫾ 0.03 共group mean ⫾ std. dev.兲 for gait, which is significantly different from the corresponding exponent ␣sign = 0.45⫾ 0.13 for heartbeat data 共p − value = 10−9 by the Student’s t test兲. At long time scales of n ⬎ 100 both interstride and heartbeat intervals are characterized by a group average exponent ␣sign = 0.45 with a p − value= 0.46 by the Student’s t test 共see Table I兲. Further, our analysis of the sign series from surrogate data obtained after Fourier phase randomization of the original gait and heartbeat signals indicates no change in the scaling behavior 关Fig. 3共c兲, open symbols兴, suggesting that, in contrast to the magnitude series, correlations in the sign series reflect linear properties in the original data. Our DFA, and magnitude and sign decomposition analyses show a consistent scaling behavior of gait dynamics for all 10 subjects in our database. All individual scaling curves
2
α
1 =0.05 sign
α
(b)
1
10
=0.45
sign
2
time scale n
10
FIG. 4. 共Color online兲 DFA-2 analysis of the gait interstride intervals 共ISI兲 series, the magnitude series 兩⌬ISI兩 and the sign series sign共⌬ISI兲 for 共a兲 all ten subjects in our database and 共b兲 six 10 min segments of a 1 h recording from one individual subject. A consistent scaling behavior is observed for all subjects as well as for different segments from individual recordings despite certain differences in the average and standard deviation of ISI among subjects and across segments.
for the interstride interval signals, magnitude and sign series practically collapse onto a single curve 关Fig. 4共a兲兴. To further test the validity of our results for gait dynamics, and that they indeed represent the internal mechanics of gait control, and are not an artifact of external/random factors of the environment, we have segmented each 1 h gait recording into 10 min segments, and have separately analyzed each segment. While the average gait rate and standard deviation change for different segments with some subjects reporting a certain degree of fatigue or tiredness near the end of the recording, our results demonstrate a remarkable stability of the scaling results with no statistically significant change in the exponent ␣, ␣mag, and ␣sign for different segments 关Fig. 4共b兲兴. C. Wavelet-based multifractal analysis
To further test the long-term nonlinear features in gait dynamics we study the multifractal properties of interstride
041920-6
LEVELS OF COMPLEXITY IN SCALE-INVARIANT …
PHYSICAL REVIEW E 79, 041920 共2009兲
log10 Zq(a)
10
(a)
Healthy Gait
τ(q=-3)
q=-3 5
q=0 0
q=3 0.5
(a)
log10 Zq(a)
10
1.0
log10 a
(b)
1.5
2.0
Healthy Heatbeat
q=-3
τ(q=-3)
5
q=0 0
q=3 1
(b)
2
3
log10 a
(c) Individual -1
τ(q)
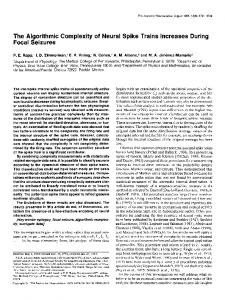
time series. We apply the WTMM method 关39,93兴—a “mean-field” type approach to quantify the fractal organization of singularities in the signal. We characterize the multifractal properties of a signal over a broad range of time scales by the multifractal spectrum 共q兲. Gait and heartbeat time series contain densely packed, nonisolated singularities which unavoidably affect each other in the time-frequency decomposition. Therefore, rather than evaluating the distribution of the inherently unstable local singularity exponents 关14,43兴兲, we estimate the scaling of an appropriately chosen global measure: the q moments of the probability distribution of the maxima of the wavelet transform Zq共a兲 共using the third derivative of the Gaussian function as the analyzing wavelet兲. We first examine the time series shown in Fig. 1. For the gait time series, we obtain a 共q兲 spectrum which is practically a linear function of the moment q suggesting that the gait dynamics exhibit monofractal properties 关Figs. 5共a兲 and 5共c兲兴. This is in contrast with the nonlinear 共q兲 spectrum for the heartbeat signal 关Figs. 5共b兲 and 5共c兲兴 which is indicative of nonlinear multifractal behavior 关38,39兴. Further, when analyzing the remaining interstride interval recordings, we find close to linear 共q兲 spectra for all subjects in the gait group 关Fig. 6共a兲兴. Calculating the group averaged 共q兲 spectra we find clear differences: multifractal behavior for the heartbeat dynamics and practically monofractal behavior for the gait dynamics 关Fig. 6共b兲兴. Specifically, we find significant differences between the gait and heartbeat 共q兲 spectra for negative values of the moment q; for positive values of q, the scaling exponents 共q兲 take on similar values. This is in agreement with the similarity in power spectral and DFA scaling exponents for gait and heartbeat data, which correspond to 共q = 2兲 共Fig. 3兲. However, the heartbeat 共q兲 spectrum is visibly more curved for all moments q compared with the gait 共q兲 spectrum which may be approximately fit by a straight line, indicative of a low degree of nonlinearity in the interstride time series. Thus, our results show consistent differences between the nonlinear and multifractal properties of gait and heartbeat time series. Previous studies have shown that reducing the level of physical activity under a constant routine protocol does not change the multifractal features of heartbeat dynamics, while blocking the sympathetic or parasympathetic tone of the neuroautonomic regulation of the heart dramatically changes the multifractal spectrum, thus suggesting that the observed features in cardiac dynamics arise from the intrinsic mechanisms of control 关33兴. Similarly, by eliminating polynomial trends in the interstride interval time series corresponding to changes in the gait pace using DFA and wavelet analyses, we find scaling features which remain invariant among individuals. Therefore, since different individuals experience different extrinsic factors, the observed lower degree of nonlinearity 共as measured by the magnitude scaling exponent兲 and the close-to-monofractal behavior (characterized by practically linear 共q兲 spectrum) appear to be a result of the intrinsic mechanisms of gait regulation. These observations suggest that while both gait and heartbeat dynamics arise from layers of neural control with multiple component interactions, and exhibit temporal organization over multiple time scales, they nonetheless belong to different complexity classes. While
Healthy Gait Healthy Heartbeat -2
(c)
-2
0
q
2
FIG. 5. 共Color online兲 Multifractal analysis: Scaling of the partition function Zq共a兲 of the wavelet-transform modulus maxima obtained using the third derivative of the Gaussian as a wavelet function for 共a兲 an individual ISI gait recording, and 共b兲 an individual RR heartbeat recording. 共c兲 Multifractal spectrum 共q兲 for the individual records shown in 共a兲 and 共b兲, where is a scaling index associated with different moments q 关Eq. 共7兲兴. A monofractal signal corresponds to a straight line for 共q兲, while for multifractal signals 共q兲 is a nonlinear function of q. Thus, our results indicate multifractal/nonlinear behavior in heartbeat dynamics in contrast to monofractal/linear behavior in gait. Note that the values of 共q = 2兲 for both gait and heartbeat time series are very close, in agreement with our findings based on DFA-2 correlation analysis 关Fig. 3共a兲兴.
041920-7
PHYSICAL REVIEW E 79, 041920 共2009兲
IVANOV et al.
(a) Individual Subjects
τ(q)
-1
Human Gait
-2
(a)
-2
0
q
2
(b) Group Average
τ(q)
-1
Healthy Gait Healthy Heartbeat -2
(b)
-2
0
q
2
FIG. 6. 共Color online兲 Multifractal analysis: 共a兲 Multifractral spectra 共q兲 for all ten subjects in our gait database 关40兴 exhibit close to linear dependence on the moment q, suggesting monofractal behavior, in contrast to the nonlinear 共q兲 spectra reported for heartbeat recordings 关99兴. 共b兲 Group average multifractal spectra 共q兲 for the gait and heartbeat subjects in our database 关40兴. The results show a consistent monofractal 共almost linear兲 behavior for the gait time series, in contrast with the multifractal behavior of the heartbeat data.
both gait and heartbeat dynamics may be a result of competing inputs interacting through multiple feedback loops, differences in the nature of these interactions may be imprinted in their nonlinear and multifractal features: namely, our findings suggest that while these interactions in heartbeat dynamics are of a nonlinear character and are represented by Fourier phase correlations encoded in the magnitude scaling and the multifractal spectrum, feedback mechanisms of gait dynamics lead to decreased interactions among the Fourier phases. D. Further validation of gait results
These findings are supported by our analysis of a second group of gait subjects. We analyze interstride intervals from
an additional group of seven young healthy subjects 共six male, one female, mean age 28 years兲 recorded using a portable accelerometer 关100兴. Subjects walked continuously for ⬇1 h at a self-selected pace on an unconstrained outdoor walking track in a park environment allowing for slight changes in elevation and obstacles related to pedestrian traffic. The stride interval time series in this case were obtained from peak-to-peak intervals in the accelerometer signal output in the direction of the subjects’ vertical axis. The accelerometer device we used 共9 ⫻ 6 ⫻ 2 cm, weight 140 g兲 was developed by Sharp Co. The device, attached to subjects’ back, measures the vertical and anteroposterier acceleration profile during walking. The output signals are digitized at a sampling frequency of 103 Hz, and are stored on a memory card. When the subjects’ heel strikes the ground, a clear peak in the acceleration along the vertical axis is recorded. The positions of these peaks in time are also verified independently through matching steepest points in the anteroposterier acceleration signal output. Our analysis indicates a compatibility of the ground reaction force sensor, used for the gait recordings of the first group 关40,41兴, with the accelerometer device used for the second group 关100兴, as well as a strong correlation between the outputs of the two devices. We find that for the second gait group the two-point correlation exponent ␣ = 0.90⫾ 0.1 共group mean ⫾ std. dev.兲, as measured by the DFA-2 method in the range of time scales 6 ⬍ n ⬍ 600 is similar to the group average exponent of the first gait group 共␣ = 0.87⫾ 0.03兲 and also to the heartbeat data 共␣ = 1.01⫾ 0.08兲. In contrast, we find again a significantly lower degree of nonlinearity, as measured by the group average magnitude exponent ␣mag = 0.57⫾ 0.04 in the range of time scales 6 ⬍ n ⬍ 600 and by the 共q兲 spectrum, compared with heartbeat dynamics ␣mag = 0.71⫾ 0.06 共p = 1.3⫻ 10−3, by the Student’s t test兲. On the other hand, the group averaged value of ␣mag = 0.57⫾ 0.04 for the second gait group is slightly higher compared to ␣mag = 0.51⫾ 0.03 for the first gait group, and this is associated with slightly stronger curvature in the 共q兲 spectrum for the second gait group. This may be attributed to the fact that the second group walked in a natural park environment where obstacles, changes in elevation and pedestrian traffic may possibly require the activation of higher neural centers of gait control. To test to what extent our results depend on the order of polynomial detrending used in the DFA method, we have repeated our analyses using different orders DFA: DFA-1 which removes constant trends in the analyzed signal, DFA-2 which removes both constant and linear trends, and DFA-3 removing constant, linear and quadratic trends. While there is a measurable difference in the results for the scaling exponent ␣ obtained from DFA-1 compared to DFA-2 共⬇3% difference, with higher values for ␣ from DFA-1兲, we find practically identical results for the exponent ␣ obtained from DFA-2 and DFA-3 共⬇1% difference in ␣兲, suggesting that removing polynomial trends of second and higher order in the recordings does not lead to significantly different scaling results 共see Fig. 7兲. The same is also valid when wavelets with higher than third-order derivatives of the Gaussian are used for the multifractal analysis in Sec. III C. The present results are related to a physiologically-based model of gait control where specific interactions between
041920-8
LEVELS OF COMPLEXITY IN SCALE-INVARIANT …
PHYSICAL REVIEW E 79, 041920 共2009兲
0
10
(a) Gait: Individual Subject
-1
DFA-1 DFA-2 DFA-3
10
F(n)
-2
10
ISI
α=0.9 |∆ISI|
αmag=0.5 -3
10
sign(∆ISI)
-4
10
1
α -5
10
1
10
(a)
2 =0.45 sign
α
=0.05 sign
2
3
10 time scale n
10
0
10
-1
F(n)
10
(b) Heart: Individual Subject DFA-1 DFA-2 DFA-3
-2
10
α=0.9 |∆RR|
αmag=0.7
-3
sign(∆RR)
10
αsign=0.4
-4
10
(b)
RR
1
10
2
10 time scale n
3
10
FIG. 7. 共Color online兲 Results of DFA-l analysis with different order l = 1 , 2 , 3 of polynomial detrending for 共a兲 gait and 共b兲 heartbeat data. Note that DFA-l removes trends of order up to 共l − 1兲 in the time series. Considering the group average 具⌬␣典i of the differences ⌬␣i1,2 ⬅ ␣i共DFA− 1兲 − ␣i共DFA− 2兲, where i indicates different subjects, we obtain the following: for the original interstride signal 具⌬␣1,2典i = 0.03⫾ 0.03 and 具⌬␣2,3典i = 0.007⫾ 0.009, indicating that the results obtained from DFA-2 and DFA-3 are not significantly different. Thus, using higher order of polynomial detrending does not change the scaling result, i.e., compared to constant and linear trends, quadratic trends do not contribute significantly to the nonstationarity of gait. These observations remain valid also for the magnitude and sign scaling analysis as shown in 共a兲 and 共b兲.
neural centers are considered 关12,13兴. In this model a lower degree of nonlinearity (and close-to-linear monofractal 共q兲 spectrum) reflects increased connectivity between neural centers, typically associated with maturation of gait dynamics in adults. The present results are also consistent with studies that used a different approach to quantify the dynamics of gait, based on estimates of the local Hurst exponents, and reported only weak multifractality in gait dynamics 关14,15兴. IV. SUMMARY
In summary, we find that while the fluctuations in the output of both gait and heartbeat processes are characterized
by similar two-point correlation properties and 1 / f-like power spectra, they belong to different classes of complexity—human gait fluctuations exhibit practically linear 共q兲 spectrum and close to monofractal properties characterized by a single scaling exponent, while heartbeat fluctuations exhibit nonlinear multifractal properties, which in physical systems have been connected with turbulence and related multiscale phenomena 关32,38,43,80,81,101兴. Our analyses indicate that while two systems—cardiac and locomotion, both under integrated neural control and with multicomponent feedback interactions over a range of time scales—can be characterized by long-range power-law correlations of 1 / f-type, other linear and nonlinear scaling features of their dynamics can be markedly different. This study demonstrates that different combinations of scaling behavior for the magnitude and sign of the fluctuations can lead to similar scaling behavior over a broad range of time scales in the correlations of the fluctuations in the output of these systems. Specifically, we find strong anticorrelations in the sign and close to random behavior for the magnitude of gait fluctuations at short and intermediate time scales, in contrast to weak anticorrelations in the sign and strong positive correlation for the magnitude of heartbeat interval fluctuations—suggesting that, despite certain similarities, these physiologic systems belong to different subclasses of complexity. We note that, our observations of higher than 0.5 values for the gait magnitude exponent ␣mag ⬇ 0.6 at short time scales of up to 15 s 共Table I兲 are in agreement with earlier reports of slightly nonlinear/multifractal behavior in gait dynamics based on estimates of the local Hölder exponents 关14兴. This slightly multifractal behavior at short time scales—which may result from 共i兲 the inherent instability of nonisolated local singularities in gait fluctuations as quantified by the local Hölder exponents or 共ii兲 may be intrinsically related to local nonlinear Fourier-phase correlations in gait dynamics—appears to be lost at time scales above 15 s, where the global scaling exponent ␣mag ⬇ 0.5 共Table I兲, and the multifractal spectrum 共q兲 appears linear for different moments q 共Fig. 5兲. Our observation of a transition in gait dynamics from slightly nonlinear 共at short time scales兲 to linear/monofractal behavior 共at long time scales兲 relates to earlier empirical and modeling studies reporting 共i兲 a decrease in long-term gait nonlinearity, as measured by ␣mag, with maturation from childhood to adulthood, and 共ii兲 that this decrease in nonlinearity/multifractality with age may be related to increased connectivity 共i.e., ability to operate over a broader range of frequency/time scales兲 among the central pattern generators responsible for gait control at different frequency modes 关13兴. We further note that different mechanisms may be involved in various aspects of locomotor control. For example, in contrast to gait dynamics where we observe ␣mag ⬇ 0.5 indicating linear behavior, our prior studies of forearm motion 关102,103兴 show ␣mag ⬇ 0.8, indicating high degree of nonlinearity in wrist activity dynamics, although both gait and wrist dynamics are characterized by identical long-range power-law correlations with an exponent ␣ ⬇ 0.9 关12,13,102,103兴. Thus, comparing the “mosaic” of scaling, nonlinear, and multifractal measures of gait interstride inter-
041920-9
PHYSICAL REVIEW E 79, 041920 共2009兲
IVANOV et al.
vals with similar measures of other physiologic systems is necessary for better understanding the dynamics of these systems and for further developing more adequate models of integrated neural control 关104–106兴. The findings reported here are of interest because they underscore the limitations of traditional two-point correlation methods in characterizing physiological and physical time series. In addition, these results suggest that feedback on multiple time scales is not sufficient to explain different types of 1 / f scaling and scale invariance, and highlight the need for the development of new models 关107–110兴 that
could account for the scale-invariant outputs of different types of feedback systems.
This work was supported by grants from Mitsubishi Chemical Co., Yokahama, Japan, NIH/National Center for Research Resources 共Grants No. P41 RR13622 and AG14100兲 and NIH 共Grant No. HL071972兲. We thank Yosef Ashkenazy and Ainslie Yuen for helpful discussions.
关1兴 H. E. Stanley, Introduction to Phase Transitions and Critical Phenomena 共Oxford University Press, New York, 1971兲. 关2兴 P. Bak and M. Creutz, Fractals in Science, edited by A. Bunde and S. Havlin 共Springer-Verlag, Berlin, 1994兲. 关3兴 C. Bernard, Leçons sur les Phénoménes de la Vie Communs aux Animaux et aux Végétaus 共Baillière, Paris, 1878兲, Vols. 1 and 2. 关4兴 B. van der Pol and J. van der Mark, Philos. Mag. 6, 763 共1928兲. 关5兴 W. B. Cannon, Physiol. Rev. 9, 399 共1929兲. 关6兴 J. B. Johnson, Phys. Rev. 26, 71 共1925兲. 关7兴 P. Dutta and P. M. Horn, Rev. Mod. Phys. 53, 497 共1981兲. 关8兴 Ninth International Symposium on Noise in Physical Systems, edited by C. M. Van Vliet 共World Scientific, Singapore, 1987兲. 关9兴 M. B. Weissman, Rev. Mod. Phys. 60, 537 共1988兲. 关10兴 T. Musha and H. Higuchi, Jpn. J. Appl. Phys. 15, 1271 共1976兲. 关11兴 Y. Liu, P. Gopikrishnan, P. Cizeau, M. Meyer, C.-K. Peng, and H. E. Stanley, Phys. Rev. E 60, 1390 共1999兲. 关12兴 J. M. Hausdorff, Y. Ashkenazy, C.-K. Peng, P. Ch. Ivanov, H. E. Stanley, and A. L. Goldberger, Physica A 302, 138 共2001兲. 关13兴 Y. Ashkenazy, J. M. Hausdorff, P. Ch. Ivanov, and H. E. Stanley, Physica A 316, 662 共2002兲. 关14兴 N. Scafetta, L. Griffin, and B. J. West, Physica A 328, 561 共2003兲. 关15兴 B. J. West and N. Scafetta, Phys. Rev. E 67, 051917 共2003兲. 关16兴 M. F. Shlesinger, Ann. N. Y. Acad. Sci. 504, 214 共1987兲. 关17兴 M. F. Shlesinger and B. J. West, Random Fluctuations and Pattern Growth: Experiments and Models, edited by H. E. Stanley and N. Ostrowsky 共Kluwer Academic, Boston, 1988兲. 关18兴 B. J. West and M. F. Shlesinger, Int. J. Mod. Phys. B 3, 795b 共1989兲. 关19兴 J. B. Bassingthwaighte, L. S. Liebovitch, and B. J. West, Fractal Physiology 共Oxford University Press, New York, 1994兲; L. S. Liebovitch and T. I. Toth, Ann. N.Y. Acad. Sci. 591, 375 共1990兲. 关20兴 R. M. Berne and M. N. Levy, Cardiovascular Physiology, 6th ed. 共C.V. Mosby, St. Louis, 1996兲. 关21兴 V. T. Inman, H. J. Ralston, and F. Todd, Human Walking 共Williams and Wilkins, Baltimore, 1981兲. 关22兴 M. N. Levy, Circ. Res. 29, 437 共1971兲. 关23兴 M. Kobayashi and T. Musha, IEEE Trans. Biomed. Eng. BME-29, 456 共1982兲. 关24兴 Y. Yamamoto and R. L. Hughson, J. Appl. Physiol. 71, 1143 共1991兲.
关25兴 Y. Yamamoto and R. L. Hughson, Physica D 68, 250 共1993兲. 关26兴 C.-K. Peng, J. Mietus, J. M. Hausdorff, S. Havlin, H. E. Stanley, and A. L. Goldberger, Phys. Rev. Lett. 70, 1343 共1993兲. 关27兴 Heart Rate Variability, edited by M. Malik and A. J. Camm 共Futura, Armonk, NY, 1995兲. 关28兴 M. P. Kadaba, H. K. Ramakrishnan, M. E. Wootten, J. Gainey, G. Gorton, and G. V. B. Cochran, J. Orthop. Res. 7, 849 共1989兲. 关29兴 J. M. Hausdorff, C.-K. Peng, Z. Ladin, J. Y. Wei, and A. L. Goldberger, J. Appl. Physiol. 78, 349 共1995兲. 关30兴 H. Yang, F. Zhao, Y. Zhuo, X. Wu, and Z. Li, Physica A 312, 23 共2002兲. 关31兴 J. M. Hausdorff, Hum. Mov. Sci. 26, 555 共2007兲. 关32兴 P. Ch. Ivanov, L. A. N. Amaral, A. L. Goldberger, S. Havlin, M. G. Rosenblum, Z. Struzik, and H. E. Stanley, Nature 共London兲 399, 461 共1999兲. 关33兴 L. A. N. Amaral, P. Ch. Ivanov, N. Aoyagi, I. Hidaka, S. Tomono, A. L. Goldberger, H. E. Stanley, and Y. Yamamoto, Phys. Rev. Lett. 86, 6026 共2001兲. 关34兴 J. J. Collins and I. Stewart, Biol. Cybern. 68, 287 共1993兲. 关35兴 J. M. Hausdorff, P. L. Purdon, C.-K. Peng, Z. Ladin, J. Y. Wei, and A. L. Goldberger, J. Appl. Physiol. 80, 1448 共1996兲. 关36兴 Y. Ashkenazy, P. Ch. Ivanov, S. Havlin, C.-K. Peng, A. L. Goldberger, and H. E. Stanley, Phys. Rev. Lett. 86, 1900 共2001兲. 关37兴 Y. Ashkenazy, S. Havlin, P. Ch. Ivanov, C.-K. Peng, V. Schulte-Frohlinde, and H. E. Stanley, Physica A 323, 19 共2003兲. 关38兴 J. F. Muzy, E. Bacry, and A. Arneodo, Phys. Rev. Lett. 67, 3515 共1991兲. 关39兴 J. F. Muzy, E. Bacry, and A. Arneodo, Int. J. Bifurcat. Chaos 4, 245 共1994兲. 关40兴 Gait Database available at http://www.physionet.org/; MITBIH Normal Sinus Rhythm Database available at http:// www.physionet.org/physiobank/database/ecg 关41兴 J. M. Hausdorff, Z. Ladin, and J. Y. Wei, J. Biomech. 28, 347 共1995兲. 关42兴 P. Ch. Ivanov, A. Bunde, L. A. N. Amaral, S. Havlin, J. Fritsch-Yelle, R. M. Baevsky, H. E. Stanley, and A. L. Goldberger, Europhys. Lett. 48, 594 共1999兲. 关43兴 P. Ch. Ivanov, L. A. N. Amaral, A. L. Goldberger, S. Havlin, M. G. Rosenblum, H. E. Stanley, and Z. Struzik, Chaos 11, 641 共2001兲. 关44兴 C.-K. Peng, S. V. Buldyrev, S. Havlin, M. Simons, H. E. Stan-
ACKNOWLEDGMENTS
041920-10
LEVELS OF COMPLEXITY IN SCALE-INVARIANT …
PHYSICAL REVIEW E 79, 041920 共2009兲
ley, and A. L. Goldberger, Phys. Rev. E 49, 1685 共1994兲. 关45兴 K. Hu, P. Ch. Ivanov, Z. Chen, P. Carpena, and H. E. Stanley, Phys. Rev. E 64, 011114 共2001兲. 关46兴 Z. Chen, P. Ch. Ivanov, K. Hu, and H. E. Stanley, Phys. Rev. E 65, 041107 共2002兲. 关47兴 L. Xu, P. Ch. Ivanov, K. Hu, Z. Chen, A. Carbone, and H. E. Stanley, Phys. Rev. E 71, 051101 共2005兲. 关48兴 Z. Chen, K. Hu, P. Carpena, P. Bernaola-Galvan, H. E. Stanley, and P. Ch. Ivanov, Phys. Rev. E 71, 011104 共2005兲. 关49兴 N. Vandewalle, M. Ausloos, M. Houssa, P. W. Mertens, and M. M. Heyns, Appl. Phys. Lett. 74, 1579 共1999兲. 关50兴 K. Ivanova and M. Ausloos, Physica A 274, 349 共1999兲. 关51兴 A. Montanari, R. Rosso, and M. S. Taqqu, Water Resour. Res. 36, 1249 共2000兲. 关52兴 B. D. Malamud and D. L. Turcotte, J. Stat. Plan. Infer. 80, 173 共1999兲. 关53兴 S. V. Buldyrev, A. L. Goldberger, S. Havlin, C.-K. Peng, H. E. Stanley, and M. Simons, Biophys. J. 65, 2673 共1993兲. 关54兴 S. M. Ossadnik, S. B. Buldyrev, A. L. Goldberger, S. Havlin, R. N. Mantegna, C.-K. Peng, M. Simons, and H. E. Stanley, Biophys. J. 67, 64 共1994兲. 关55兴 M. S. Taqqu, V. Teverovsky, and W. Willinger, Fractals 3, 785 共1995兲. 关56兴 S. Havlin, S. V. Buldyrev, A. L. Goldberger, R. N. Mantegna, C.-K. Peng, M. Simons, and H. E. Stanley, Fractals 3, 269 共1995兲. 关57兴 D. T. Schmitt and P. Ch. Ivanov, Am. J. Physiol. 293, R1923 共2007兲. 关58兴 T. H. Makikallio, J. Koistinen, L. Jordaens, M. P. Tulppo, N. Wood, B. Golosarsky, C.-K. Peng, A. L. Goldberger, and H. V. Huikuri, Am. J. Cardiol. 83, 880 共1999兲. 关59兴 A. Bunde, S. Havlin, J. W. Kantelhardt, T. Penzel, J. H. Peter, and K. Voigt, Phys. Rev. Lett. 85, 3736 共2000兲. 关60兴 T. T. Laitio, H. V. Huikuri, E. S. H. Kentala, T. H. Makikallio, J. R. Jalonen, H. Helenius, K. Sariola-Heinonen, S. Yli-Mayry, and H. Scheinin, Anesthesiology 93, 69 共2000兲. 关61兴 R. I. Kitney and O. Rompelman, The Study of Heart-Rate Variability 共Oxford University Press, London, 1980兲. 关62兴 R. I. Kitney, D. Linkens, A. C. Selman, and A. A. McDonald, Automedica 4, 141 共1982兲. 关63兴 L. S. Liebovitch, Adv. Chem. Ser. 235, 357 共1994兲. 关64兴 J. Kurths, A. Voss, P. Saparin, A. Witt, H. J. Kleiner, and N. Wessel, Chaos 5, 88 共1995兲. 关65兴 A. L. Goldberger, Lancet 347, 1312 共1996兲. 关66兴 Y. Q. Chen, M. Z. Ding, and J. A. S. Kelso, Phys. Rev. Lett. 79, 4501 共1997兲. 关67兴 B. J. West and L. Griffin, Fractals 6, 101 共1998兲. 关68兴 S. B. Lowen, L. S. Liebovitch, and J. A. White, Phys. Rev. E 59, 5970 共1999兲. 关69兴 S. Havlin, S. V. Buldyrev, A. Bunde, A. L. Goldberger, P. Ch. Ivanov, C.-K. Peng, and H. E. Stanley, Physica A 273, 46 共1999兲. 关70兴 L. Griffin, D. J. West, and B. J. West, J. Biol. Phys. 26, 185 共2000兲. 关71兴 H. E. Stanley, L. A. N. Amaral, P. Gopikrishnan, P. Ch. Ivanov, T. H. Keitt, and V. Plerou, Physica A 281, 60 共2000兲. 关72兴 L. A. Protsmman, H. Meeuwsen, P. Hamilton, B. J. West, and J. Wilkerson, J. Sport Exerc. Psychol. 23, S67 共2001兲. 关73兴 Fractals and Disordered Systems, 2nd ed., edited by A. Bunde and S. Havlin 共Springer-Verlag, Berlin, 1996兲.
关74兴 H. Takayasu, Fractals in the Physical Sciences 共Manchester University Press, Manchester, UK, 1997兲. 关75兴 S. Stoev, V. Pipiras, and M. S. Taqqu, Signal Process. 82, 1873 共2002兲. 关76兴 H. E. Hurst, Trans. Am. Soc. Civ. Eng. 116, 770 共1951兲. 关77兴 J. Feder, Fractals 共Plenum, New York, 1988兲. 关78兴 T. Vicsek and A.-L. Barabási, J. Phys. A 24, L845 共1991兲. 关79兴 A.-L. Barabasi, P. Szepfalusy, and T. Vicsek, Physica A 178, 17 共1991兲. 关80兴 J. Nittmann, G. Daccord, and H. E. Stanley, Nature 共London兲 314, 141 共1985兲. 关81兴 C. Meneveau and K. R. Sreenivasan, Phys. Rev. Lett. 59, 1424 共1987兲. 关82兴 C. Li and C. Zheng, Engineering in Medicine and Biology Society., Proceedings of the 15th Annual International Conference of the IEEE, edited by A. Y. J. Szeto, and R. M. Rangayyan共IEEE, New York,1993兲, Vol. 15, p. 330. 关83兴 O. Meste, H. Rix, P. Caminal, and N. V. Thakor, IEEE Trans. Biomed. Eng. 41, 625 共1994兲. 关84兴 L. Senhadji, G. Carrault, J. J. Bellanger, and G. Passariello, IEEE Eng. Med. Biol. Mag. 14, 167 共1995兲. 关85兴 M. Karrakchou, C. V. Lambrecht, and M. Kunt, IEEE Eng. Med. Biol. Mag. 14, 179 共1995兲. 关86兴 N. V. Thakor, X. R. Guo, Y. C. Sun, and D. F. Hanley, IEEE Trans. Biomed. Eng. 40, 1085 共1993兲. 关87兴 D. Morlet, J. P. Couderc, P. Touboul, and P. Rubel, Int. J. Biomed. Comput. 39, 311 共1995兲. 关88兴 D. Morlet, F. Peyrin, P. Desseigne, P. Touboul, and P. Rubel, J. Electrocardiol. 26, 311 共1993兲. 关89兴 L. Reinhardt, M. Mäkijärvi, T. Fetsch, J. Montonen, G. Sierra, A. Martínez-Rubio, T. Katila, M. Borggrefe, and G. Breithardt, J. Am. Coll. Cardiol. 27, 53 共1996兲. 关90兴 M. Karrakchou and M. Kunt, Ann. Biomed. Eng. 23, 562 共1995兲. 关91兴 P. Ch. Ivanov, M. G. Rosenblum, C.-K. Peng, J. Mietus, S. Havlin, H. E. Stanley, and A. L. Goldberger, Nature 共London兲 383, 323 共1996兲. 关92兴 P. Ch. Ivanov, M. G. Rosenblum, C.-K. Peng, J. Mietus, S. Havlin, H. E. Stanley, and A. L. Goldberger, Physica A 249, 587 共1998兲. 关93兴 J. F. Muzy, E. Bacry, and A. Arneodo, Phys. Rev. E 47, 875 共1993兲. 关94兴 T. Vicsek, Fractal Growth Phenomena, 2nd ed. 共World Scientific, Singapore, 1993兲. 关95兴 D. Panter, Modulation, Noise and Spectral Analysis 共McGrawHill, New York, 1965兲. 关96兴 J. Theiler, S. Eubank, A. Longtin, B. Galdrikian, and D. J. Garmer, Physica D 58, 77 共1992兲. 关97兴 J. W. Kantelhardt, Y. Ashkenazy, P. Ch. Ivanov, A. Bunde, S. Havlin, T. Penzel, J. H. Peter, and H. E. Stanley, Phys. Rev. E 65, 051908 共2002兲. 关98兴 R. Karasik, N. Sapir, Y. Ashkenazy, P. Ch. Ivanov, I. Dvir, P. Lavie, and S. Havlin, Phys. Rev. E 66, 062902 共2002兲. 关99兴 H. E. Stanley, L. A. N. Amaral, A. L. Goldberger, S. Havlin, P. Ch. Ivanov, and C.-K. Peng, Physica A 270, 309 共1999兲. 关100兴 N. Tanaka, S. Sonoda, Y. Muraoka, Y. Tomita, and N. Chino, Jpn. J. Rehabil. Med. 33, 549 共1996兲. 关101兴 U. Frisch, Turbulence 共Cambridge University Press, Cambridge, UK, 1995兲. 关102兴 K. Hu, P. Ch. Ivanov, Z. Chen, M. F. Hilton, H. E. Stanley,
041920-11
PHYSICAL REVIEW E 79, 041920 共2009兲
IVANOV et al. and S. A. Shea, Physica A 337, 307 共2004兲. 关103兴 P. Ch. Ivanov, K. Hu, M. F. Hilton, S. A. Shea, and H. E. Stanley, Proc. Natl. Acad. Sci. U.S.A. 104, 20702 共2007兲. 关104兴 R. Bartsch, M. Plotnik, J. W. Kantelhardt, S. Havlin, N. Giladi, and J. M. Hausdorff, Physica A 383, 455 共2007兲. 关105兴 K. Ohgane and K. I. Ueda, Phys. Rev. E 77, 051915 共2008兲. 关106兴 V. B. Kokshenev, Phys. Rev. Lett. 93, 208101 共2004兲. 关107兴 P. Ch. Ivanov, L. A. N. Amaral, A. L. Goldberger, and H. E.
Stanley, Europhys. Lett. 43, 363 共1998兲. 关108兴 D. C. Lin and R. L. Hughson, Phys. Rev. Lett. 86, 1650 共2001兲. 关109兴 P. V. E. McClintock and A. Stefanovska, Physica A 314, 69 共2002兲. 关110兴 R. Yulmetyev, P. Hanggi, and F. Gafarov, Phys. Rev. E 65, 046107 共2002兲.
041920-12