MARINE ECOLOGY PROGRESS SERIES Mar Ecol Prog Ser
Vol. 545: 35–47, 2016 doi: 10.3354/meps11630
Published March 8
Light and O2 microenvironments in two contrasting diatom-dominated coastal sediments Paulo Cartaxana1,*, Lourenço Ribeiro2, 3, Johannes W. Goessling1, Sónia Cruz1, 4, Michael Kühl1, 5 1
Marine Biological Section, Department of Biology, University of Copenhagen, Strandpromenaden 5, 3000 Helsingør, Denmark 2 Université de Nantes, Mer Molécules Santé EA2160, Faculté des Sciences et des Techniques, 44322 Nantes Cedex 3, France 3 Centro de Ciências do Mar e Ambiente (MARE), Faculdade de Ciências da Universidade de Lisboa, Campo Grande, 1749-016 Lisboa, Portugal 4
Departamento de Biologia & CESAM − Centro de Estudos do Ambiente e do Mar, Universidade de Aveiro, Campus de Santiago, 3810-193 Aveiro, Portugal 5 Plant Functional Biology and Climate Change Cluster, University of Technology Sydney, Sydney, NSW 2007, Australia
ABSTRACT: The close coupling of photosynthesis and light was studied in 2 contrasting diatomdominated coastal sediments (sand and mud flats) using O2 microelectrodes and fiber-optic microprobes for scalar irradiance. The diatom community of the muddy sediment was composed almost exclusively of motile epipelic species, whereas in the sandy sediment similar contributions of epipsammic and epipelic diatoms were observed. The attenuation coefficient of scalar irradiance (K0) was significantly higher in the mud, where light was attenuated exponentially with depth from the sediment surface. In the sand, scalar irradiance levels increased in the first 0.1–0.2 mm due to high scattering and low absorption. Attenuation of scalar irradiance was highest for wavelengths of absorption by major diatom photopigments (chlorophylls and carotenoids). Higher areal and volumetric rates of O2 respiration were found in illuminated sediments than those in the dark, resulting from an increase in both O2 concentration and penetration depth and a direct stimulation of heterotrophic processes. A lower light acclimation index (Ek) was observed for the muddy sediment community, indicating lower light acclimation compared to the sandy sediment community. Areal and volumetric rates of photosynthesis were ~3 times higher in the muddy sediment. We conclude that higher photosynthetic rates in the finer sediment were determined by (1) a thinner and more densely populated photic zone, where the contribution of active photopigments to total light absorption relative to that of photosynthetically inactive components was higher, and (2) differences in diatom species composition and dominant life-strategies, specifically the capacity of cells to actively search for optimal light microenvironments in the fine-grained sediment. KEY WORDS: Microsensors · Diatoms · Migration · Photosynthesis · Respiration · Scalar irradiance Resale or republication not permitted without written consent of the publisher
Microphytobenthic communities inhabiting the intertidal and shallow subtidal mud and sand flats of estuaries and coastal zones are largely dominated by diatoms and/or cyanobacteria. These organisms have been identified as some of the most important pri-
mary producers in coastal ecosystems (MacIntyre et al. 1996), playing a significant role as (1) facilitators of carbon transfer among trophic levels (Bellinger et al. 2009), (2) mediators of nutrient cycling and exchange across the sediment−water interface (Sundbäck et al. 2000) and (3) efficient sediment stabilizers (Underwood & Paterson 2003).
*Corresponding author:
[email protected]
© Inter-Research 2016 · www.int-res.com
INTRODUCTION
36
Mar Ecol Prog Ser 545: 35–47, 2016
The microenvironment of these densely populated microphytobenthic communities is complex and characterized by steep physical and chemical gradients, including very strong light attenuation. Microenvironmental heterogeneity in benthic communities is more pronounced than in planktonic systems, at a spatial scale comparable to the size and distance between the individual organisms (Underwood & Kromkamp 1999). Therefore, studies of microphytobenthic photosynthesis require specialized tools to assess the distribution of light and photosynthetic activity at relevant spatial scales. The use of fiberoptic scalar irradiance microprobes in combination with O2 microsensors is an ideal way to resolve how the steep gradients of light intensity and spectral composition in sediments affect microbenthic photosynthesis and other aspects of the photobiology of microphytobenthos in their natural environments (Kühl et al. 1996, Kühl 2005). Microphytobenthos colonizing sediments live in a diffuse light field with a strong component of scattered light that is harvested from all directions (Kühl & Jørgensen 1992, 1994); thus, measurements of downwelling irradiance can significantly underestimate the light availability for photosynthesis in such communities (Kühl et al. 1994). It is therefore of paramount importance to relate photosynthesis at a given point to scalar irradiance, i.e. the integral of radiance incident from all directions around a point in space (Lassen et al. 1992, Kühl & Jørgensen 1994). Light in sedimentary environments is subject to intense absorption but also to a high degree of scattering due to the high density of microalgae, detritus and sediment particles. This has several important consequences that may impact microphytobenthic photosynthesis, namely (1) strong light attenuation resulting in an extremely narrow photic zone, (2) local enhancement of scalar irradiance at the sediment surface due to intense scattering, and (3) rapid change in light quality with depth resulting from differential absorption: a decrease of the wavelengths coinciding with photopigment absorption maxima compared to other wavelengths in the light spectrum (Lassen et al. 1992, Ploug et al. 1993, Kühl & Jørgensen 1994, Kühl et al. 1994, 1996). Benthic diatom communities have traditionally been divided into 2 main groups with regard to the life-strategies they exhibit: the epipelon and the epipsammon (e.g. Round 1965, Admiraal 1984). The epipelon consists of motile diatoms that can move freely between sediment particles and usually dominate in muddy sediments, whereas the epipsammon mostly comprises smaller, non-motile diatoms that
are attached to sand grains, and therefore are found more commonly in sandy substrata. As this nomenclature represents an oversimplification, a more refined classification has recently been proposed, uncoupling motility or attachment from sediment type (e.g. Ribeiro et al. 2013, Barnett et al. 2015). This includes differentiation within the epipsammic group between non-motile species, firmly attached (either stalked or adnate) to sand particles, and motile forms that can move within the sphere of individual sand grains. Motile epipelic diatoms may actively search for optimal light microenvironments, exhibiting vertical migratory rhythms determined by diurnal and tidal cycles (Round & Palmer 1966, Pinckney & Zingmark 1991, Underwood et al. 2005) and irradiance levels (Kromkamp et al. 1998, Perkins et al. 2010, Vieira et al. 2011). Epipsammon-dominated sand flat communities do not show such migratory patterns and photoregulate exclusively through physiological mechanisms (Jesus et al. 2009, Cartaxana et al. 2011). Although several studies have characterized light and/or O2 microenvironments in benthic systems dominated by cyanobacteria and/or diatoms (e.g. Lassen et al. 1992, Ploug et al. 1993, Kühl et al. 1996, Glud et al. 2002, Brotas et al. 2003, Hancke & Glud 2004, Al-Najjar et al. 2010, 2012), such measurements have never been done together in fine muddy sediments with a typically migrating diatom community in order to assess the close coupling of photosynthesis and light. In this study, O2 microelectrodes and fiber-optic microprobes for scalar irradiance were applied to resolve the vertical variability of O2, light and photosynthesis in 2 contrasting diatomdominated coastal sediments: highly cohesive fine mud and coarse sandy sediment. We hypothesized that differences in photosynthetic rates in diatomdominated sediments with distinct particle size composition would be determined by light absorption patterns and dominant cell life-strategies. Oxygen budgets and a detailed description of the diatom taxonomic composition of the 2 studied benthic communities are presented.
MATERIALS AND METHODS Sediment sampling and experimental set-up Sediment samples (2 cm depth) were collected from an estuarine mud flat in Lisbon, Portugal (38° 47’ 46.7’’ N, 09° 05’ 32.4’’ W) and a sandy beach in Helsingør, Denmark (56° 02’ 48.5’’ N, 12° 36’ 07.3’’ E) using a rectangular acrylic corer (19.7 × 7.8 × 2 cm),
Cartaxana et al.: Light and O2 in diatom sediments
and were transferred with minimal disturbance to custom-made acrylic flow-through chambers. In the laboratory, a stable laminar flow of aerated seawater was maintained above the sediment surface (water layer depth: 1.5 cm; temperature: 16°C; salinity: 30) using a submersible water pump (Rena Flow 400) connected to the flow chamber and immersed in a temperature-controlled water reservoir. Sediments were first exposed to an incident downwelling photon irradiance (Ed; Table 1 provides a list of abbreviations) of photosynthetically active radiation (PAR, 400–700 nm) of 75 µmol photons m−2 s−1 for approximately 24 h. The sediments were illuminated vertically from above with a fiber-optic tungsten halogen lamp (KL-2500, Schott) equipped with a collimating lens, and Ed was measured with a calibrated photon irradiance meter (ULM-500, Walz) equipped with a planar cosine collector (LI-190, LiCor). Sediments were exposed at each experimental photon irradiance (0, 250, 500 and 1000 µmol photons m−2 s−1) for at least 45 min prior to O2 and scalar photon irradiance measurements. Changes in photon irradiance were achieved without spectral distortion by adjusting the aperture size on the fiber-optic halogen lamp. Sediment grain size composition was determined by sequential sediment sieving, evaluating the relative contribution (% dry weight) of the size fractions: >1000, 1000−500, 500−250, 250−125, 125−63 and < 63 µm.
37
Table 1. Definitions of abbreviations Symbol α Φ DBL D0 Ds E0 Ed Ek Ec Jup Jdown K0 PAR Pz Pg Pn Pn,phot Pmax Rlight Rdark Rphot
Definition
Initial slope of the photosynthesis vs. irradiance curve Sediment porosity Diffusive boundary layer Molecular diffusion coefficient of O2 (cm2 s−1) Sediment diffusion coefficient of O2 (cm2 s−1) Photon scalar irradiance (µmol photons m−2 s−1) Downwelling photon irradiance (µmol photons m−2 s−1) Light acclimation index (µmol photons m−2 s−1) Compensation irradiance (µmol photons m−2 s−1) Upward O2 flux through the DBL (= Pn, nmol O2 cm−2 s−1) Downward O2 flux from the photic zone (nmol O2 cm−2 s−1) Attenuation coefficient of scalar irradiance (mm−1) Photosynthetically active radiation (400–700 nm, µmol photons m−2 s−1) Volumetric gross photosynthesis at depth z (nmol O2 cm−3 s−1) Gross areal photosynthesis (nmol O2 cm−2 s−1) Net areal photosynthesis (= Jup, nmol O2 cm−2 s−1) Net areal photosynthesis of the photic zone (= |Jup| + |Jdown|, nmol O2 cm−2 s−1) Maximal photosynthetic capacity (nmol O2 cm−2 s−1) Areal respiration in the light (= Pg − Pn, nmol O2 cm−2 s−1) Areal respiration in the dark (nmol O2 cm−2 s−1) Areal respiration within the photic zone (= Pg − Pn,phot, nmol O2 cm−2 s−1)
Microphytobenthos biomass and taxonomic composition Sediment samples (approximately the upper 2 mm) were collected for biomass estimation and taxonomic composition analysis by scraping the surface with a scalpel. Approximately 100 mg of sediment were extracted for 24 h with 3 ml of 90% acetone for biomass estimation. Chlorophyll a (chl a) concentrations were determined on pigment extracts by spectrophotometry (UV-2101PC, Shimadzu) using the method of Jeffrey & Humphrey (1975). Approximately 3 ml of sediment was collected for taxonomic composition analysis and placed in 5 ml polypropylene tubes, to which 1 ml of a 2.5% glutaraldehyde solution was added, and stored at 4°C for later processing. Cells were extracted from the sediment following an isopycnic separation technique using silica sol Ludox® HS-40 (Sigma-Aldrich) that separates the organic material from mineral particles, and is thus able to remove both migratory and non-migratory fractions of the diatom assemblages, as well as cyanobacteria,
euglenids and other microphytobenthic algal groups (Ribeiro 2010). Total cell counts were made directly from the extract on an Olympus BX50 optical microscope, at 400× magnification. Diatom identification and cell counts were made on permanent slides of cleaned diatom material, mounted in Naphrax™, on a Zeiss Axioskop 50 microscope equipped with differential interference contrast optical microscopy. The observation of the extracts showed that weakly-silicified diatoms, like Atheya and Cylindrotheca, were an important part of the assemblages. Therefore, to avoid the underestimation of these fragile genera, 2 types of slides were made: one from diatom material incinerated in a muffle-furnace for 2 h at 450°C to preserve fragile specimens; and one from diatom material that was oxidized by hydrogen peroxide (30%) at 90°C for 4 h, thus destroying the slightly silicified frustules, but allowing better identification of very small taxa. In both cases, > 400 frustules/valves were counted.
Mar Ecol Prog Ser 545: 35–47, 2016
38
After determining the relative percentage of the fragile diatoms (i.e. Cylindrotheca and Atheya spp.), the relative abundance (percentage) of the other taxa was determined in the oxidized slide taking into consideration what was previously established for fragile specimens (Ribeiro 2010). Diatom identification mainly followed Ribeiro (2010) and Witkowski et al. (2000) and references therein. Biovolume assessment followed the estimates presented by Snoeijs et al. (2002) and Ribeiro et al. (2013). In the cases of taxa that were not available in those works, biovolume calculations were made following Hillebrand et al. (1999). Size-classes and lifestrategy information were primarily taken from Ribeiro (2010) and references herein, but followed the growth-form groups proposed by Barnett et al. (2015): epipelon (EPL), motile epipsammon (EPM-M) and non-motile epipsammon (EPM-NM) (no tychoplanktonic species — those that can live both in the sediment and in the water column — were observed). Diversity of the 2 studied microphytobenthic communities was calculated using the Shannon index: S
H ' = – ∑ pi loge pi
(1)
i =1
Microprofiling of O2 concentration and gross photosynthesis Depth profiles of dissolved O2 concentrations were measured with fast responding (t 90 < 0.5 s) Clark-type microelectrodes (tip diameter ~25 µm, OX-25, Unisense A/S) at vertical steps of 0.1 mm. The O2 microelectrodes were connected to a pA meter (Unisense A/S) and signals were recorded via a USB-interfaced A/D-converter (DCR16, Pyro Science) through dedicated PC-controlled data acquisition software (Profix, Pyro Science). The O2 microsensors were linearly calibrated at experimental temperature and salinity from measurements in aerated seawater as well as in seawater made anoxic by the addition of sodium sulphite. The O2 microsensors were mounted on a motor-driven micromanipulator (MU1, Pyro Science), which was interfaced to a desktop computer and controlled with the Profix software. Surface positioning of the microsensors was done while observing the sediment with a PC-interfaced USB digital microscope (AD7013MZT Dino-Lite, AnMo Electronics). The microsensors were inserted into the sediment at an angle of 45° relative to the vertical incident light beam to avoid self-shading. The software automatically accounted for the sensor insertion angle; all depths are given in vertical distances.
Volumetric gross photosynthesis rates (Pz , nmol O2 cm−3 s−1) were measured at 0.1 mm depth intervals at the higher experimental photon irradiance (400– 700 nm, 1000 µmol photons m−2 s−1) using the microelectrode light−dark shift technique (Revsbech & Jørgensen 1983). In this method, the gross rate of photosynthesis is estimated as the initial O2 depletion rate at a specific depth during the first few seconds after light is briefly turned off (see also Glud et al. 1992). Depth integration over the sediment photic zone yielded areal gross photosynthesis rates (Pg, nmol O2 cm−2 s−1).
Flux calculations of net photosynthesis and respiration Sediment net areal photosynthesis (Pn) was calculated from steady-state O2 profiles in the light using the flux of O2 (Jup ) into the overlaying water through the diffuse boundary layer (DBL) as calculated by Fick’s first law of diffusion (Kühl et al. 1996): Jup = Pn = −D0 dC/dz
(2)
where D0 is the molecular O2 diffusion coefficient at experimental salinity and temperature (from Table for seawater and gases, Unisense A/S) and dC/dz is the linear concentration gradient in the DBL. Net photosynthetic rates as a function of the incident photon irradiance, Pn (E), were fitted with an exponential model (Webb et al. 1974), with an extra term, R, to account for O2 consumption (Spilling et al. 2010): Pn(E) = Pmax (1 − exp−αE /P max) + R
(3)
where Pmax represents the maximum photosynthetic capacity and α is the initial slope of the photosynthesis vs. irradiance curve. The compensation irradiance (Ec ), i.e. the irradiance at which total O2 production and consumption in the sediment balanced each other, was determined when Pn(E) = 0. The light acclimation index, Ek, i.e. the irradiance at onset of photosynthesis saturation was calculated from Ek = Pmax/α. Sediment areal respiration in the dark (Rdark) was calculated by Eq. (2) as the linear flux of O2 into the sediment through the DBL. The areal respiration of the sediment in the light (R light) was calculated as the difference between gross and net photosynthesis (Pg − Pn). Net photosynthesis and respiration were also calculated for the photic zone alone (Kühl et al. 1996). The areal net photosynthesis of the photic zone (Pn,phot ) was calculated as the absolute sum of
Cartaxana et al.: Light and O2 in diatom sediments
39
the flux of O2 into the overlaying water across the DBL (Jup ) and the flux into the biofilm below the photic zone (Jdown ). Downward O2 flux at the lower boundary of the photic zone was calculated as: Jdown = −Φ Ds dC/dz
(4)
where Φ is the sediment porosity, and Ds is the sediment diffusion coefficient, which was calculated from the porosity and D0 according to Iversen & Jørgensen (1993). Sediment porosity was calculated from core slicing and subsequent drying of known volumes of sediment. The areal respiration of the photic zone (Rphot ) was then calculated as Pg − Pn,phot. Average volumetric rates of O2 respiration of distinct zones of the sediment were calculated by dividing areal respiration rates determined from the flux calculations with the depth of the photic zone or the O2 penetration depth (Kühl et al. 1996).
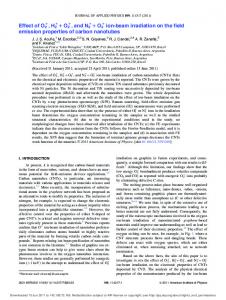
Fig. 1. Particle size fractions (%) of the muddy (mud) and sandy (sand) coastal sediments
RESULTS Sediment particle size and porosity
Light measurements Spectral measurements of scalar irradiance (E0) were done at 0.1 mm vertical depth intervals using a scalar irradiance microprobe connected to a fiberoptic spectrometer (USB2000+, Ocean Optics) interfaced to a PC running spectral acquisition software (Spectra Suite, Ocean Optics). The scalar irradiance microprobe consisted of a small diffusing sphere (80 µm diameter) cast on the coated tip of a tapered optical fiber (Rickelt et al. 2016). The position and insertion angle of the scalar irradiance probe was controlled as described above for the O2 microelectrodes. Photon scalar irradiance of PAR was obtained by integrating scalar irradiance spectra from 400 to 700 nm. The downwelling spectral scalar irradiance (i.e. Ed) at the sediment surface was measured by positioning the scalar irradiance microprobe over a black non-reflective light well at the same position relative to the vertically incident, collimated light field as the sediment surface. Scalar irradiance spectra at various depths in the sediment were normalized to the known incident downwelling photon irradiance at the sediment surface. Attenuation coefficients of photon scalar irradiance were calculated from the depth profiles of spectral scalar irradiance as (Kühl 2005): K0 = ln(E1 /E2)/(z2 − z1)
(5)
where K0 is the vertical spectral attenuation coefficient of scalar irradiance, and E1 and E2 are the spectral scalar irradiance measured at depths z1 and z2 in the sediment (where z2 > z1).
The 2 studied coastal sediments differed significantly regarding particle size composition. More than 99% of the muddy sediment was composed of particles < 63 µm (Fig. 1), with a porosity of 0.9. In the sandy sediment, the particle size distribution was dominated by medium sand of 250–500 µm with 56% dry weight, followed by coarse and fine sand (500− 1000 and 125−250 µm size-classes) with 18 and 16% dry weight, respectively. Small stones and broken shells (>1000 µm) were also a significant part (9%) of the sediment. Particles 1000 µm3. In contrast, most of the identified diatoms in the sand were small, with 33 species having a bio-
Biovolume
Size-class
Life-form
439 247 639 2869 204 20 790 6614 7436 27 104 425 3290 507 757 271 74 126 228 137 299 5529 1343 82 22 764 6676 38 153 2278 3529 2880
250−1000 100−250 250−1000 >1000 100−250 >1000 >1000 >1000 >1000 250−1000 >1000 250−1000 250−1000 250−1000 1000 >1000 1000 >1000 >1000 >1000 >1000 >1000
EPM-NM EPL EPL EPL EPM-M EPL EPL EPL EPL EPL EPL EPL EPL EPL EPL EPL EPL EPL EPL EPL EPL EPL EPL EPL EPL EPL EPL EPL
volume < 250 µm3. Nevertheless, medium sized diatoms (250 to 1000 µm3) dominated both muddy and sandy communities in terms of relative abundance (in both cases, ca. 45%). The microphytobenthic communities of the 2 studied sediments were also quite distinct in terms of diatom composition, sharing only 2 species (Cylindrotheca closterium and Navicula gregaria). The muddy sediment was dominated by species of the genera Navicula (57.6% relative abundance), particularly N. spartinetensis (34.5%) and N. cf. phyllepta (18.6%) (Table 2). In the sand, the most representative species were the epipelic Navicula sp.1 (15.6%) and the non-motile epipsammic Anorthoneis vortex (12.4%) and Attheya decora (11.2%) (Table 3).
Scalar irradiance Depth profiles of photon scalar irradiance were rather different between the 2 studied coastal sediments (Fig. 2): while scalar irradiance levels at the
Cartaxana et al.: Light and O2 in diatom sediments
41
Table 3. Diatoms (46 taxa) collected from the sandy coastal sediment site (Helsingør, Denmark), including details of their relative abundance (%), biovolume (µm3) and life-form (EPL: epipelon; EPM-M: motile epipsammon; EPM-NM: non-motile epipsammon). Relative abundances were also allocated to 4 size-classes which comprised the average cell biovolumes of 1000 µm3 Taxon
Abundance Biovolume Size-class
Biremis lucens (Hustedt) Sabbe, Witkowski & Vyverman Achnanthes cf. amoena Hustedt Amphora subacutiuscula Schoeman Amphora cf. tenerrima Aleem & Hustedt Amphora wisei (Salah) Simonsen Anaulus balticus Simonsen Anorthoneis vortex Sterrenburg Astartiella punctifera (Hustedt) Witkowski & Lange-Bertalot Attheya decora T. West Biremis ambigua (Cleve) Mann Cavinula sp. Cocconeis hauniensis Witkowski Cocconeis pelta A. Schmidt Cocconeis peltoides Hustedt Cylindrotheca closterium (Ehrenberg) Reimann & Lewin Fallacia cryptolyra (Brockmann) Stickle & Mann Fragilaria cf. cassubica Witkowski & Lange-Bertalot Grammatophora oceanica Ehrenberg Halamphora cf. abuensis (Foged) Levkov Navicula aleksandrae Lange-Bertalot, Bogaczewicz-Adamczak & Witkowski Navicula biskanterae Hustedt Navicula cf. celinei Witkowski, Metzeltin & Lange-Bertalot Navicula cf. perminuta Grunow in van Heurck Navicula diserta Hustedt Navicula germanopolonica Witkowski & Lange-Bertalot Navicula gregaria Donkin Navicula sp.1 Navicula sp.2 Navicula sp.3 Navicula sp.4 Navicula sp.5 Navicula sp.6 Navicula viminoides Giffen Nitzschia aurariae Cholnoky Nitzschia cf. distans Gregory Nitzschia dubiiformis Hustedt Nitzschia sp.2 Opephora guenter-grassii (Witkowski & Lange-Bertalot) Sabbe & Vyverman Opephora mutabilis (Grunow) Sabbe & Vyverman Parlibellus cf. calvus Witkowski, Metzeltin & Lange-Bertalot Planothidium delicatulum (Kützing) Round & Bukhtiyarova morphotype 1 Planothidium delicatulum (Kützing) Round & Bukhtiyarova morphotype 3 Planothidium deperditum (Giffen) Witkowski Planothidium cf. lemmermannii (Hustedt) Morales Planothidium sp.1 Planothidium sp.2 Seminavis cf. strigosa (Hustedt) Danielidis & Economou-Amilli
sediment surface were similar in both, reaching ~120% of incident downwelling photon irradiance, light was attenuated differently. In the muddy sediment, light was attenuated exponentially with depth starting from the surface, while photon scalar irradiance levels in the sand increased over the first
0.1 0.2 3.9 0.2 0.2 0.4 12.4 2.4 11.2 0.2 0.2 0.7 0.2 0.4 0.9 0.2 0.2 0.2 0.4 1.1 0.2 0.2 2.0 5.9 2.6 8.4 15.6 0.4 0.2 0.4 0.2 0.9 0.7 0.7 2.8 0.2 0.7 0.2 0.2 5.5 3.1 0.2 0.4 0.9 0.7 0.2 10.9
439 85 1194 120 110 52 790 468 2363 23488 104 54 221 175 247 162 81 4126 110 76 98 122 68 54 132 831 381 158 64 205 338 58 96 64 1343 1189 354 62 167 252 140 91 54 75 100 108 171
250−1000 1000 100−250 100−250 1000 >1000 100−250