Link Prediction Based on Subgraph Evolution in Dynamic Social Networks Krzysztof Juszczyszyn1, Katarzyna Musiał2, Marcin Budka2 1 Institute of Computer Science, Wrocław University of Technology, Poland 2 School of Design, Engineering and Computing, Bournemouth University, UK
[email protected],
[email protected],
[email protected]
Abstract— We propose a new method for characterizing the dynamics of complex networks with its application to the link prediction problem. Our approach is based on the discovery of network subgraphs (in this study: triads of nodes) and measuring their transitions during network evolution. We define the Triad Transition Matrix (TTM) containing the probabilities of transitions between triads found in the network, then we show how it can help to discover and quantify the dynamic patterns of network evolution. We also propose the application of TTM to link prediction with an algorithm (called TTM-predictor) which shows good performance, especially for sparse networks analyzed in short time scales. The future applications and research directions of our approach are also proposed and discussed. Link prediction, network evolution, triad transitions
I. INTRODUCTION The complexity and dynamics are inherent properties of technology-based social networks. In result, they are very difficult to investigate in terms of traditional social network analysis methods that can effectively cope with static networks of size up to few hundred nodes. Currently, the one of the main challenges is to investigate the evolution of networks at the right level of granularity and the dynamics of this evolution. In technology-based networks a relation between two individuals is a result of set of discrete events (like emails, phone calls, blog entries) about which the knowledge is available. Because these events have some distribution, this adds a new dimension to the known problems of network analysis [11]. As shown in [9] for various kinds of human activities related to communication and information technologies, the probability of inter-event times (periods between the events, like sending an email) may be expressed as: P(t)≈t-α where typical values of α are from (1.5, 2.5). This distribution inevitably results with series of consecutive events (“activity bursts”) divided by longer periods of inactivity.
These phenomena have serious consequences when we try to apply the classic structural network analysis (SNA) to the dynamic networks. The most popular approach is to divide the time period under consideration into time windows, then run SNA methods on the windows separately. This should show us how the measures like node centrality, average path length, group partitions etc. change in time, giving an insight into the evolutionary patterns of the network. However, the bursty behaviour of the users (long inactivity periods mixed with the bursts) causes dramatic changes of any measure when switching from one time window to another. There is a trade-off: short windows lead to chaotic changes of network measures, while long windows give us no chance of investigation of network dynamics [13][14]. In order to address this problem, a number of methods, designed to predict changes in the structure of dynamic networks, were proposed [15][16]. The special case is the so-called link prediction problem – the estimation of probability that a link will emerge/disappear during the next time window [12]. A broad survey of link prediction methods is presented in [20]. It should be noted that most methods of the link prediction give rather poor results – the best predictors discussed in [12] can identify < 10% of emerging links. It should be emphasised that the networks analysed in [12] were built from arxiv publication record which differs significantly from our test cases (email social networks) presented below. Email networks are highly dynamic in short timescales and - for big networks, the number of disconnected pairs of nodes increases quadratically (the density of real-world networks is small and the graphs are sparse) while the number of links grows only linearly [21]. These phenomena have motivated us to make an attempt of description of network dynamics in terms of changes in elementary network subgraphs. Basing on our previous experience, which shows that the distribution of subgraphs in complex networks is statistically stable and typical for the considered network even in the face of significant structural changes [17], we claim that it is possible to
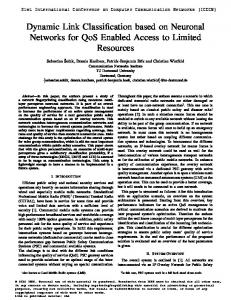
characterize the network structural changes by statistical data about the evolution of its subgraphs. These dynamic patterns may be also utilized to propose a novel link prediction method. In the following sections we propose a method for the description of changes in local connection patterns of complex network, and link prediction algorithm which utilizes these patterns. The approach was evaluated on two email social network datasets which significantly differ in size and dynamics. II. LOCAL TOPOLOGY OF ONLINE SOCIAL NETWORKS A. Triads and network motifs Standard approaches exploiting network analysis by means of listing several common properties, like the degree distribution, clustering, network diameter or average path lengths often fail when applied to complex networks. In many cases it is possible to construct networks with exactly the same (for example) degree distribution whose structure and function still differ substantially from the target network. However, network structures (like social, biological, gene networks) may be investigated with more precise and structure–sensitive methods [1]. During last years we experienced the development of a number of methods investigating complex networks by means of their local structure (especially – frequent patterns of connections between nodes). The simplest, and therefore popular, way to characterize the network in the context of local connections is to examine the links between the smallest non-trivial subgraphs, the triads, consisting of three nodes. If we additionally decide to distinguish between the nodes (which is our case, for our network they are corporate email addresses) we get 64 patterns of possible connections between any three identifiable nodes (Fig.1).
Fig.1. Three-node triads in a directed labelled graph
Please note the triad ID (the number inside the picture of the subgraph) in Fig. 1, as it will be used further on in this paper. The basic method utilizing such subgraphs is the well-knows triad census, which is enumeration of all triads in the network and allows to reason about the functional connection patterns of the nodes [18]. Another is so-called motif analysis which aims to characterize the network by the difference between its structures and an ensemble of random networks of the same size and degree distribution. A biased distribution of local network structures (subgraphs), a.k.a. network motifs is widely observed in complex biological or technology–based networks. Motif analysis stems from bioinformatics and theoretical biology [1][3], where it was applied to the investigation of huge network structures like transcriptional regulatory networks, gene networks or food webs [4][5]. Although the global topological organization of metabolic networks is well understood, their local structural organization is still not clear. At the smallest scale, network motifs have been suggested to be the functional building blocks of network biology. So far several interesting properties of large biological network structures were reinterpreted or discovered with help of motif analysis [6][7][8]. In our former research we have investigated the local structure of numerous technology-based networks, among them an e-mail social network of Wroclaw University of Technology (WUT), consisting of more than 5 800 nodes and 140 000 links [2]. Our aim was to check if the known properties of local topology in social networks (known on the basis of motif analysis conducted for small social networks [4]) are also present in large email–based social structures, and if there are some distinct features characteristic to the email communication. The most important conclusion from these experiments was that the general motif profile of the network (expressed by so-called triad significance profile – TSP – a vector of the Zscore measures of the motifs) is stable over long periods of time. This was confirmed even for periods like summer holidays when the number of links in the university network dropped by 50% [17]. Summing up – the investigated complex network showed statistically stable pattern of local connections as a whole, despite the fact that stability of a single link is quite low. These observations led to the idea of characterizing the evolutionary patterns of the network by means of the changes in elementary subgraphs, in this particular case – directed triads. In the following section we define Triad Transition Matrix as an indicator for characterizing inherent network dynamics at local topology level.
B. Triad Transition Matrix The idea behind the Triad Transition Matrix is to use the data from the history of the network (recorded during past time windows) to derive the probabilities of transitions between triads (patterns of local connections) of chosen network nodes. The TTM is a matrix of size g x g, where g is the number of considered subgraphs. As we distinguish between the nodes, and for three nodes the connections A-B-C and A-C-B do not constitute the same configuration, the number of directed triads in our experiments is g = 64 (see Fig.1). The values of TTM entries are defined as follows: TTMt (i,j) = P(gi[t] gj[ t+1]) (1) TTMt (i,j) is the probability (estimated from full triad enumeration for networks created from data gathered in [t] and [t+1] time windows), that a connection pattern (triad) gi found during [t] will transit into gj during [t+1]. The sum of values in TTM row is 1. Our goal was to check if the stability of motif distribution (discussed in the former subsection) is followed by the distinguishable evolutionary patterns of the network triads. III. DESCRIPTION OF EXPERIMENTAL DATA For the experiments with the TTM we have chosen the two datasets containing the email social network data: (1) Enron dataset (http://www.cs.cmu.edu/~enron/), one of the popular reference e-mail logs, and (2) Wroclaw University of Technology (WUT, http://www.portal.pwr.wroc.pl/) mail server logs. A. The temporal networks of Enron dataset First, the data cleansing process was performed (external addresses were removed from the database in order to analyze only the corporate social network). Additionally, only emails from and to the Enron domain were left (we may call the resulting set of nodes and the links between them a corporate social network). The experimental data were divided into 12 time windows and for each of them a network was created. Each of the time window covers 90 days. The main nodeset in our experiment consists of 150 nodes and up to 1012 links (in a single time window number 10). From Fig. 2 we see that – despite the equal number of nodes in each time window – the number of edges differs significantly. It is obvious that in terms of the number of links, node centrality, etc. the structure of the network is changing. However, based on the triad dynamics analysis it can be noted that there is some pattern behind this change (see sec. B).
Fig.2. Network size for consecutive time windows.
B. The temporal networks of WUT dataset WUT mail server logs were also pruned to contain only the emails originated from (or sent to) the staff members registered at the mail server of the university. The entire set contains data from 605 days of the operation, with 5834 active email addresses. The networks used in our experiments were created from data for 1-day, 3-days and 7-days time windows. It should be noted that the email social networks undergo rapid structural changes when investigated in short time periods. In our experiment the stability of a single link is quite low: in WUT dataset 53% for 7-day time windows and only 42% for 1-day time windows (which means that on average 42% of the links will still be present in the next time window). On the Fig. 3 we see significant changes in network size which correspond to the pattern of activity at WUT (the network degenerates during weekends, which implies the periodical changes, clearly visible for 1-day windows and influencing longer windows as well).
We may notice that the distribution of transition probabilities is not flat, and there are distinctive patterns (the coordinates of TTM correspond to the triad numbers from the Fig.1). First of all, the high value of TTM(1,1) reflects the fact that the network is sparse (link density below 1%) which means that most of the possible triads contain no edges. As the result most of the “empty” triads always remain in this state, which gives us a relatively high value of TTM(1,1). Similarly, the full triad (#64 from Fig.1, containing 6 directed links) is quite stable with TTM(64,64) above 0.3. We should also note the high values in the first column of the TTM. This means that when it comes to disappearing of the links, the probability of resetting the entire triad to zeroconnection state is relatively high.
Fig.3. Network size for consecutive time windows of different size for WUT dataset.
IV. TTM ANALYSIS In Fig. 4 the mean-value TTM derived from 12 time windows for Enron dataset is presented. Despite the changes in network size (Fig. 2), all TTMs computed for neighbouring time windows showed similar values, with standard deviation less than 10%.
Fig. 4. TTM containing the transition probabilities averaged for all 12 time windows for Enron dataset.
Fig. 5. TTM containing the transition probabilities averaged for all time windows for WUT dataset.
From the other hand, it is also visible, that the values on the diagonal of TTM are bigger than values in their neighbourhood, which shows that the alreadyformed triads tend (in general) to stay in their current state (which is even more visible in the case of WUT dataset, analysed in short time windows). The last important observation is that some triads are special, they show clearly bigger values in their columns of TTM, which means that they are “sinks” of the connection evolution patterns. An important observation is that the situation is similar for WUT dataset (Fig. 5), despite the different size and timespan of the analysis. However, for 1-day window the network is more stable – it is visible at the diagonals of averaged TTMs – the probabilities at the diagonal are higher than in other fields of TTMs. The similarities between the TTMs of the investigated social networks of Enron and WUT also suggest that it is reasonable to check if the social networks show distinguishable evolutionary pattern, which may be different for other classes of dynamic networks, however this is not a key topic of this work. In the next section we propose the application of the discovered network local evolutionary patterns (TTMs) to the link prediction problem. V. TTM PREDICTOR – THE ALGORITHM The evaluation of link prediction methods in our experiments was based on the principles proposed in [12]. It was assumed there, that all the predictors assign a predicted connection weight score(x, y) to unlinked pairs of nodes x, y, based on the input graph, and then produce a ranked node pair list L in decreasing order of score(x, y), whose values are treated as proportional to the estimated probability of forming a new link
between x and y. In this way each link predictor outputs a ranked list of node pairs which would eventually form predicted new links. From this list (sorted in decreasing values of scores) the set of first n entries is taken, then the size of its intersection with the set of new links (of the same size n) is computed. The percentage of the links from the predicted set, which are also present in the set of new links, is the prediction accuracy. In [12] it is also assumed that it is reasonable to seek new links only between the nodes already connected by existing links, therefore the parameter ktraining is defined (and set to 3) and only possible links joining nodes adjacent to at least ktraining existing links are predicted. However, we argue that in the case of sparse and dynamic networks (like the one used in our experiment) this assumption restricts link prediction only to the densely connected areas of network graph (which may be called the network core) and excludes a number of possible links from prediction. Therefore, for evaluation of all methods considered in this work ktraining = 1 was used (we do not seek predictions only for the pairs of nodes which are disconnected from the rest of the network). In our link prediction algorithm (from this point called TTM-predictor) we assume the following: for the social network graph G=E, V and a node pair p=x, y; x,yV; xy let us denote the set of all nonempty triads that p belongs to as p (non-empty means: containing at least one directed link, but not necessarily the link between x and y). In this way, in the course of prediction, we check only triads which contain at least one link. This is justified by the huge number of empty triads which, according to the values of TTMs gathered in experiments in most cases will remain empty (the TTM entry (1,1) is typically close to 1). In order to avoid the attraction of the prediction results by zeros (disappearing links) we exclude them from analysis. Moreover we consider the prediction of links which are not connected to existing network (by means of having at least one of their endpoints adjacent to any link, ktraining = 1) unjustified. Assuming that the TTM (or its estimation – in our experiments we have used the average values of the TTMs computed for the 30 time windows of respective size preceding the current window for WUT dataset, and the average TTM computed for all 12 time windows for Enron) is known, we want to check the evolution patterns for all the triads in p for each p adjacent to at least one link in existing network. Let tp be a single triad containing p (one of the 64 considered), and TTM(t) – the row of TTM matrix number t. The set of 64 values contained in TTM(t)
(corresponding to transition probabilities of t) may be divided into two disjoint sets TTM0(t) and TTM1(t), where: TTM0(t) is a the set of TTM entries from the row t corresponding to triads in which there is no link between the nodes of p. TTM1(t) is a the set of TTM entries from the row t corresponding to triads in which there is a link between the nodes of p. The algorithm for computing the score for node pair p – from here on denoted as scoreTTM(p), given the known G (network graph for current time window) and the TTM is as follows. For a given p: scoreTTM(p)=0; Step 1: Determine p; Step 2: For each tp determine TTM0(t) and TTM1(t); Step 3: ∑ ∑ As one can see, the proposed algorithm is a kind of “voting procedure” in which all the triads from p vote for the existence of link between the nodes in p according to the values in their TTM rows. The votes are weighted and the weight of each vote is equal to the probabilities from the TTM. Having computed the link scores we can propose an algorithm of the TTMpredictor. The TTM prediction algorithm: For given G, n, and TTM: Step 1: Determine the set P of node pairs, such that for each pP: there is no link in G between the nodes of p, there is at least one link in G adjacent to the nodes in p. Step 2: For each pP compute scoreTTM(p) Step 3: Create the list LP of pP. Sort LP in decreasing order of the values of scoreTTM(p) Step 4: Pick the first n elements from LP which are predicted new links. For the evaluation of the prediction algorithms the value of n is assumed to be known, however for practical applications it may be estimated with good accuracy from the time series of the numbers of new and disappearing network links once the history of the network is known. It corresponds to the inference of n from the changing number of links in successive time windows - see Fig. 2 and Fig. 3.
VI. TTM PREDICTION – EVALUATION The evaluation of link prediction methods in our experiment gave the results presented in Fig.6. We have compared the TTM-predictor (TTM) with the two standard methods: preferential attachment (PA) and common neighbours (CN) predictor, defined exactly as in [12] (where CN was one of the best) and, additionally, the simple random predictor (RN, for which the scores are just random values from [0,1]). The experiments were performed for the 12 Enron time windows, and, respectively, 25, 9 and 9 windows of 1,3 and 7 days for WUT. In the case of 12 time windows of Enron dataset TTM predictor outperforms the others (with an exception of the transition from time window 11 to 12, where CN was better). An interesting observation is that for the 1st time window the result of TTM is exceptionally high, in the opposite to CN – this is the forming stage of the network and this suggests that at this time the network dynamics is far from the rules of CN predictor. In this and the following cases the values for RN are given only for reference (for large network of WUT its typical result is zero predicted links). For the WUT dataset the performance of TTM is similar for the 7-day time windows, but for narrowing time windows (3 and 1-days corresponding to growing sparsity and the variance of the link number) it can be seen that the performance of all predictors is going down (which is expected), however not equally. When the network undergoes periodic changes connected with rapid reduction of link number (Sundays: 1-day windows 4, 11, 18, 25 and their preceding days weekends) the TTM performance, however reduced, is still at the level higher than 2% (in contrary to PA and CN). In the periods of “network growth” (from Sundays on), unlike the weekends, the non-zero performance of PA and CN is also visible. This case may be interpreted as the moment in which the rules of PA and CN (that the unlinked nodes show affiliation to hubs or tend to form a link when having a number of common friends) start to “work” again which results in the increase of the number of accurate predictions. Summing up, we have checked the performance of the TTM-predictor for two networks (for the second, WUT, for three different timescales) which significantly differ in the size, dynamics and the period covered by their datasets. Its performance was confirmed to be generally better than that of CN and was proved to be relatively immune (in comparison to CN and PA) to the periods when the networks changes its mode of operation which results in rapid structural changes. The observations described in this section suggest the ways of further developing our method.
s Fig. 6. Comparison of different link prediction methods.
VII. CONCLUSIONS AND FUTURE WORK The concept of TTM joins the statistical features of network links with their topological connection patterns. The method, although based on graph analysis, utilizes the inherent network dynamics based on the observations of the recorded network history. In this way it is adaptive with respect to the behaviour of the network components (nodes). For we do not assume any prior knowledge about the nature of relations and network nodes (TTM bases on the structural changes in the network only), this allows the future classification of the different dynamic networks (social, biological, etc.) according to their local evolutionary schemes expressed by the TTMs. The method shows good performance especially in the case of sparse, dynamic networks analyzed in short time scales. This paper reports the preliminary experiments which were carried on to check the possibility of modelling network evolution by means of structural changes in its elementary subgraphs. It should be noted that the triad voting scheme applied in the TTMpredictor is one of the simplest possible solutions. The promising results of these experiments (the performance of TTM-predictor) open possibilities of further developing of our approach, the most appealing directions are: Including link weight in the analysis; in an e-mail network a link exists as a consequence of sending one or many messages, and in most cases it is far more stable in the second case. This issue will be used to tune our method in the next stage of experiments and should improve the performance of TTM prediction, especially for longer time windows (in which case the incidental communication – links of weight 1 – may be clearly distinguished). Time series analysis of TTM values. From the first experiments we know that the values in TTMs undergo periodic changes which was visible especially for short (1-day) time windows. Accurate estimation of the future TTM values may greatly improve the prediction (in this work we have used mean TTM values from the number of past time windows). Reducing the complexity of the method by using effective algorithms for triad enumeration, for example applying the modified approach presented in [19], which also should allow to analyse large networks. The software developed for first experiments uses only simple algorithms for triad enumeration (however all reported experiments were run on state-of-the-art PC, taking less than three hours to complete). Modelling node behaviour by means of defining triad trajectories (the sequences of connection patterns for given triple of nodes), then using predictive
methods for estimation of link evolution in the neighbourhood of given node (which belongs to the number of triads). In this case the Markov chain models were chosen for the first experiments which are under preparation. Further experiments on various networked systems of different origin are also planned in order to develop methodologies for modelling the evolution of networks with the dynamic subgraph mining. VIII. ACKNOWLEDGEMENTS This work was supported by the Polish Ministry of Science and Higher Education, grant no. N N516 518339. The research leading to these results has received funding from the European Union Seventh Framework Programme (FP7/2007-2013) under grant agreement no. 251617. REFERENCES [1]
[2]
[3]
[4]
[5]
[6]
[7]
[8]
[9] [10]
[11]
[12]
[13]
Itzkovitz S., Milo R., Kashtan N., Ziv G., Alon U. (2003) Subgraphs in random networks. Physical Review E., 68, 026127. Juszczyszyn K., Musiał K., Kazienko P. (2008), Local Topology of Social Network Based on Motif Analysis, 11th International Conference on Knowledge-Based Intelligent Information & Engineering Systems, KES 2008, Croatia, Springer, LNAI. Kashtan N., S. Itzkovitz S., Milo R., Alon U. (2004) Efficient sampling algorithm for estimating subgraph concentrations and detecting network motifs. Bioinformatics, 20 (11), 1746–1758. Milo R., Shen-Orr S., Itzkovitz S., Kashtan N., Chklovskii D., Alon U. (2002) Network motifs: simple building blocks of complex networks. Science, 298, 824–827. Mangan S. Alon U. (2003) Structure and function of the feedforward loop network motif. Proc. of the National Academy of Science, USA, 100 (21), 11980–11985. Mangan S., Zaslaver A. Alon U. (2003) The coherent feedforward loop serves as a sign-sensitive delay element in transcription networks. J. Molecular Biology, 334, 197–204. Vazquez, A., Dobrin, R., Sergi, D., Eckmann, J.-P., Oltvai, Z.N., Barabasi, A., 2004. The topological relationship between the large-scale attributes and local interaction patterns of complex networks. Proc. Natl Acad. Sci. USA 101, 17 940. Young-Ho E., Soojin L., Hawoong J., (2006) Exploring local structural organization of metabolic networks using subgraph patterns, Journal of Theoretical Biology 241, 823–829. A.-L. Barabási, The origin of bursts and heavy tails in humans dynamics, Nature 435, 207 (2005). T. Gross, H. Sayama (Eds.): Adaptive networks: Theory, models and applications, Springer: Complexity, SpringerVerlag, Berlin-Heidelberg, 2009. J. Kleinberg, J. The convergence of social and technological networks. Communications of the ACM Vol. 51, No.11, 6672, 2008. D. Lieben-Nowell, J.M. Kleinberg: The link-prediction problem for social networks. JASIST (JASIS) 58(7), pp.10191031, 2007. D.Braha, Y. Bar-Yam, From Centrality to Temporary Fame: Dynamic Centrality in Complex Networks, Complexity, Vol. 12 (2), pp. 59-63, 2006.
[14] D. Kempe, J. Kleinberg, A. Kumar, Connectivity and inference problems for temporal networks. Journal of Computational System Science, 64(4):820–842, 2002. [15] M. Lahiri, Tanya Y. Berger-Wolf: Mining Periodic Behavior in Dynamic Social Networks. ICDM pp.373-382, 2008. [16] Lisa Singh, Lise Getoor: Increasing the Predictive Power of Affiliation Networks. IEEE Data Eng. Bull. (DEBU) Vol. 30 No. 2, pp. 41-50, 2007. [17] K. Juszczyszyn, K. Musial, P. Kazienko, B. Gabrys: Temporal Changes in Local Topology of an Email-Based Social Network. Computing and Informatics 28(6): 763-779, 2009.
[18] S. Wasserman, K. Faust, Social network analysis: Methods and applications, Cambridge University Press, New York, 1994. [19] Batagelj, V., Mrvar, A., A subquadratic triad census algorithm for large sparse networks with small maximum degree. Social Netw. 23, 237-243, 2001. [20] L. Getoor, C. P. Diehl, Link mining: a survey, ACM SIGKDD Explorations Newslett., Vol. 7, pp. 3-12, 2005. [21] Z. Huang, D. K. J. Lin, The Time-Series Link Prediction Problem with Applications in Communication Surveillance, INFORMS Journal on Computing, Vol. 21, No. 2, pp. 286303, 2009.