Lag2 Lag3 Lag4 Lag5. VAR Unweighted. VAR Enhanced. Weighted. SVM Unweighted. SVM Enhanced. Weighted. 0.00. 20.00. 40.00. 60.00. 80.00. 100.00.
ISBN 978-1-84626-xxx-x Proceedings of 2016 4th International Conference on Information Technology and Science (xxxxxx2016) Japan, 17-19 June, 2016, pp. xxx-xxx
Link Prediction in a Weighted Network using Support Vector Machine Jan Miles Co 1 and Proceso Fernandez 1 1
Ateneo de Manila University
Abstract. Link prediction is a field under network analysis that deals with the existence or emergence of links. In this study, we investigate the effect of using weighted networks for two link prediction techniques, which are the Vector Auto Regression (VAR) technique and our proposed modified VAR that uses Support Vector Machine (SVM). Using a co-authorship network from DBLP as the dataset and the Area Under the Receiver Operating Curve (AUC-ROC) as the fitness metric, the results show that the performance of both VAR and SVM are surprisingly lower in the weighted network than in the unweighted network. In an attempt to improve the results in the weighted network, we incorporated features from the unweighted network into the features of the weighted network. This enhancement improved the performance of both VAR and SVM, but the results are still inferior to those in the unweighted networks. We identified that the true positive rate was generally lower in the weighted network, thus resulting to a lower AUC.
Keywords: link prediction, vector auto regression, support vector machine, weighted networks
1. Introduction The prominence of the Internet has made communication, interaction, and collaboration very convenient. As of August 2015, there are 3.175 Billion active Internet users, with 2.206 Billion active social media users. Over the year 2014, social media users have risen by 176 Million in just a single year [1]. As a result of the growth in social media users, more data on actual social networks are available for analysis. This development in social networks serves as the main motivation for our study in Social Network Analysis (SNA), specifically link prediction. For the link prediction task, the network representation can either be unweighted or weighted. In the unweighted network, a binary value of 0 or 1 is used to respectively indicate the presence or absence of a link. In the weighted structure, a value of 0 represents the absence of a link between a pair of nodes, while a positive value is used to represent the presence and relative strength of the link. Most works on link prediction use an unweighted network, whereas only a few have explored weighted networks, such as [2,3,4,5]. Vector Auto Regression (VAR) has been shown to be one of the best techniques for time-series link prediction in both unweighted and weighted networks [6]. In our preliminary work on an unweighted network [7], we were able to improve the VAR technique by transforming its components into a feature set for classification with Support Vector Machine (SVM). The result of our preliminary work motivated us to apply our technique to a weighted network, and this paper discusses our investigation of the effect of using a weighted network over the use of an unweighted network in dynamic link prediction.
2. Review of Related Literature 2.1. The Vector Auto Regression Technique The VAR econometric model is an extension of the univariate autoregressive model that is applied to multivariate data. It provides better forecast than univariate time-series models and is one of the most successful models for analyzing multivariate time-series [6]. In a recent work on dynamic link prediction, the
VAR technique was applied in homogeneous networks represented by both unweighted and weighted adjacency matrices. For each of the unweighted and weighted adjacency matrices, five additional matrices were created according to different similarity metrics. These metrics are the Number of Common Neighbor (CN), Adamic-Adar Coefficient (AA), Jaccard’s Coefficient (JC), Preferential Attachment (PA) and the Resource Allocation Index (RA). Using a dataset created from DBLP, the VAR technique showed the best performance, in both unweighted and weighted networks, among the many link prediction techniques that include the Moving Average (MA), Random Walk (RW) and the Autoregressive Integrated Moving Average (ARIMA). For a more detailed discussion, refer to [6].
2.2. Improvement of VAR by SVM In our preliminary work [7], we were able to improve the VAR technique by using Support Vector Machine (SVM) classification algorithm. We used the co-authorship network in DBLP and followed the dataset preparation from [6]. We then created six matrices: an unweighted adjacency matrix, and five matrices based on the same five similarity metrics used in [6] for the VAR technique: CN, AA, JC, PA, and RA. By using these matrices as the features for classification with SVM, the average Area Under the Receiver Operating Characteristic Curve (AUC-ROC) was improved to 84.78%, from 82.04% in VAR. The significant improvement of SVM over VAR motivated us to extend our work to weighted networks.
2.3. Previous Works and Issues on Weighted Networks Previous works on weighted networks performed static link prediction instead of dynamic link prediction. Under the former problem domain, the presence or absence of links on a given time slice is predicted based on the presence or absence of other links on the same time slice. Various studies report different effects in static link prediction performance. According to [2], the AUC performance of four out of five supervised learning techniques improved when a weighted network was used over the unweighted counterpart. The feature values for the supervised learning were created from eight proximity metrics, which are the CN, JC, PA, AA, RA, Path Distance (PD), Local Path (LP) and Local Clustering Coefficient (CC). The best results were obtained when the network was weighted according to the number of co-authored papers between two authors [2]. On the other hand, unsupervised learning was used by [3] and [5] on different networks, and their results show that the prediction performance varies with the type of network. Both studies incorporated a parameter a that was used to control the degree of influence of the link weights. In [5], the link prediction performance in the air transportation network improves, as the influence of the link weights is decreased (the parameter a is negative), while opposite results were obtained for the neural and carbon networks. In [3] where three metrics were used (CN, AA, and RA), the best value for the parameter a varied from positive to negative values depending on the specific network used and the metric applied [3].
3. Methodology 3.1. Data Following the dataset preparation in our preliminary work [7], we used the co-authorship network in DBLP that was based from the dataset preparation in [6]. We selected only the articles from 2003 to 2013, removing all items labeled as “inproceedings”, “proceedings”, “book”, “incollection”, “phdthesis”, “masterthesis”, and “www”. The reduced set was further trimmed by removing all authors who have 50 articles or less. The final dataset has 1,743 authors and 21,920 articles [8]. The number of co-authorship links in this dataset is less than 1% of the total number of possible links. To build the unweighted and weighted time-series models, the dataset was partitioned based on the year of publication. Each of the resulting 11 subsets, corresponding to years 2003 (t=0) up to 2013 (t=10), was processed to generate a snapshot of the dynamic co-authorship network graph. A snapshot is represented by an n × n adjacency matrix, where n = 1,743 (the number of authors). In the weighted network, an entry value is equal to the number of co-authored papers between two authors. Based from the unweighted and weighted adjacency matrix for each snapshot, five similarity metrics were computed for the unweighted (U) and weighted (W) networks:
𝑪𝑵𝑼 𝒙, 𝒚 = 𝚪 𝒙 ∩ 𝚪 𝒚
(1)
𝑪𝑵𝑾 𝒙, 𝒚 =
(2)
𝑨𝑨𝑼 𝒙, 𝒚 = 𝑨𝑨𝑾 𝒙, 𝒚 = 𝑱𝑪𝑼 𝒙, 𝒚 = 𝑱𝑪𝑾 𝒙, 𝒚 =
𝒛∈𝚪 𝒙 ∩𝚪 𝒚
(𝒘 𝒙, 𝒛 + 𝒘 𝒚, 𝒛 )
𝟏 𝒛∈𝚪 𝒙 ∩𝚪 𝒚 𝐥𝐨𝐠 𝚪 𝒛
(3)
𝒘 𝒙,𝒛 !𝒘 𝒚,𝒛 𝒛∈𝚪 𝒙 ∩𝚪 𝒚 𝐥𝐨𝐠 𝟏! 𝒄∈𝚪 𝒛 𝒘 𝒛,𝒄 𝚪 𝒙 ∩𝚪 𝒚
(4) (5)
𝚪 𝒙 ∪𝚪 𝒚 𝒛∈𝚪 𝒙 ∩𝚪 𝒚
𝑼
𝒘 𝒙,𝒛 !𝒘 𝒚,𝒛
(6)
𝒂∈𝚪 𝒙 𝒘 𝒂,𝒙 ! 𝒃∈𝚪 𝒚 𝒘(𝒃,𝒚)
𝑷𝑨 𝒙, 𝒚 = 𝚪 𝒙 ∗ 𝚪 𝒚 𝑷𝑨𝑾 𝒙, 𝒚 = 𝑹𝑨𝑼 𝒙, 𝒚 = 𝑹𝑨𝑾 𝒙, 𝒚 =
𝒂∈𝚪 𝒙
(7)
𝒘 𝒂, 𝒙 ∗
𝒃∈𝚪 𝒚
𝒘 𝒃, 𝒚
(8)
𝟏 𝒛∈𝚪 𝒙 ∩𝚪 𝒚 𝚪 𝒛
𝒛∈𝚪 𝒙 ∩𝚪 𝒚
(9)
𝒘 𝒙,𝒛 !𝒘 𝒚,𝒛
( 10 )
𝒄∈𝚪 𝒛 𝒘 𝒛,𝒄
where Γ(x) is the set of nodes adjacent to node (author) x.
3.2. Link Prediction on a Weighted Network To form the baseline models of VAR, we extended the VAR model proposed by [6] for VAR of lag 2 to lags of 3, 4, and 5, and then applied the values from the unweighted and weighted adjacency matrix and similarity metrics. The predicted adjacency matrix at time t, denoted by 𝑌!! , for lag 2, is computed using the formula: 𝑱𝑪
𝑱𝑪
𝑪𝑵 𝑨𝑨 𝑨𝑨 𝑷𝑨 𝑷𝑨 𝑹𝑨 𝑹𝑨 𝒀𝑨𝒕 = 𝑪𝒕!𝟏 + 𝒂𝑨𝒕!𝟏 𝒀𝑨𝒕!𝟏 + 𝒂𝑪𝑵 𝒕!𝟏 𝒀𝒕!𝟏 + 𝒂𝒕!𝟏 𝒀𝒕!𝟏 + 𝒂𝒕!𝟏 𝒀𝒕!𝟏 + 𝒂𝒕!𝟏 𝒀𝒕!𝟏 + 𝒂𝒕!𝟏 𝒀𝒕!𝟏 𝑱𝑪
( 11 )
𝑱𝑪
𝑪𝑵 𝑨𝑨 𝑨𝑨 𝑷𝑨 𝑷𝑨 𝑹𝑨 𝑹𝑨 +𝒂𝑨𝒕!𝟐 𝒀𝑨𝒕!𝟐 + 𝒂𝑪𝑵 𝒕!𝟐 𝒀𝒕!𝟐 + 𝒂𝒕!𝟐 𝒀𝒕!𝟐 + 𝒂𝒕!𝟐 𝒀𝒕!𝟐 + 𝒂𝒕!𝟐 𝒀𝒕!𝟐 + 𝒂𝒕!𝟐 𝒀𝒕!𝟐
where each 𝑌!! is an n × n matrix containing the actual values for the (weighted) similarity metric i at time j, while the n × n matrix 𝐶! and the scalar coefficients 𝑎!! are time-based VAR model parameters. We applied linear regression, using the lm() function in R, to find the best fitting parameter set for each snapshot. To form the baseline models for SVM, we first reduced the dataset for the training phase by collecting all positive links and randomly selected an equal number of negative links. Then each instance representing the presence or absence of a co-authorship link is mapped to a k-dimensional feature space, following the linear dependency assumed in the VAR model of this study. These instances were further projected to higher dimension using an SVM linear kernel function. An SVM classifier is then used to predict the class for each instance, and these predictions are collected to construct the predicted adjacency matrix, 𝑌!! , of the network at time t.
3.3. Performance Measure To compare the link prediction performance of the VAR and SVM models, we applied backtesting. That is, we first built a VAR (or SVM) model for time t, then used this model to predict the values at time t+1, and finally compared the prediction against the known values at time t+1, as shown in Fig. 1 and 2.
Fig. 1: Training a Model for time t, using the feature values from previous time snapshots (lags) and the class values at time t
Fig. 2: Link Prediction for time t+1
We were able to measure the average performance of the VAR technique and SVM in 5 years, from Year 6 (2009) to Year 10 (2013). The Area Under the Receiver Operating Characteristic Curve (AUC-ROC) was used to measure the performance of the predictive models. In the Receiver Operating Characteristic (ROC) Curve, the x-axis corresponds to the False Positive Rate (FPR) and the y-axis corresponds to the True Positive Rate (TPR). In our context, positives correspond to links while negatives correspond to no links. Note that the AUC of a perfect model is 1, while a random model is expected to have an AUC of 0.5.
3.4. Enhanced Weighted Network
Fig. 3: Link Prediction for time t+1
To enhance link prediction with the weighted network, for VAR, we extended the VAR formula to incorporate the unweighted network components and for SVM, we added more features to incorporate the unweighted network feature set, as illustrated in Fig. 3. We then used AUC-ROC to compare the performances.
4. Results and Discussion 4.1. Weighted Compared to Unweighted Network The performance of both VAR and SVM was consistently lower in the weighted network than in the corresponding unweighted network, as shown in Fig. 4. This was initially a bit surprising since the weighted network contained information on relative link strengths, whereas the unweighted networks only indicated the presence of absence of links. However, as will be discussed later, the true positive rate is affected by the use of this information on relative link strengths.
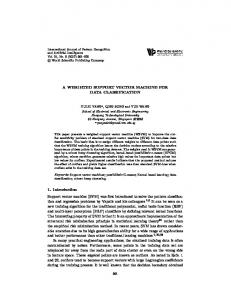
4.2. Enhancement of the Weighted Network An inspection of the results for both VAR and SVM, however, would reveal that the performance of these models in the enhanced weighted network is still lower than that in the unweighted network, as shown in Fig. 6. To analyze the performance loss in weighted networks, we examined the predicted values that are used as the input to compute for the AUC-ROC. For our analysis, we examined the results for SVM with lag 2 in unweighted and weighted networks in Year 3. In this time snapshot, the number of positive links is 2235. The ideal case is for all positive links to have higher predicted (link strength) values than all of the negative links. In this way, setting the threshold to the minimum among the predicted values for positive links will give a prediction accuracy of 100%, with no false positives and no false negatives.
100.00 80.00 VAR Unweighted 60.00
VAR Weighted
40.00
SVM Unweighted
20.00
SVM Weighted
0.00 Lag2 Lag3 Lag4 Lag5
Fig. 4: Comparison of VAR and SVM in the Unweighted and Weighted Networks 100.00 VAR Weighted
80.00 60.00
VAR Enhanced Weighted
40.00
SVM Weighted
20.00
SVM Enhanced Weighted
0.00 Lag2 Lag3 Lag4
Lag5
Fig. 5: Comparison of VAR and SVM in the Weighted and Enhanced Weighted Network 100.00 VAR Unweighted
80.00 60.00
VAR Enhanced Weighted
40.00
SVM Unweighted
20.00
SVM Enhanced Weighted
0.00 Lag2 Lag3 Lag4 Lag5
Fig. 6: Comparison of VAR and SVM in Unweighted and Enhanced Weighted Networks
When the predictions were sorted in increasing predicted link strength values and the last 5000 entries were examined, we observed that the SVM model for the weighted network was only able to correctly capture 798 of the positive links, while for the unweighted network this number was higher at 855 (refer to Fig. 7 for a visualization of the sorted ranking of the positive links). This means that if this window is considered as the set of positive links, and everything outside the window as the set of negative links, then the weighted network has lower true positives and lower true negatives than the corresponding unweighted network. This explains why the AUC is lower. This also indicates that using the relative strengths of the links makes it more difficult to correctly predict future actual links because the metrics used may exaggerate the negative link metric values to the point that they may overtake some of the actual positive links.
5. Conclusion In this study, we were able to observe that there was a performance loss for both VAR and SVM when the weighted network is used over the unweighted network. By incorporating features from the unweighted network to the weighted network, we were able to improve the performance of VAR and SVM. However,
the results were still lower than in the unweighted network. We identified that the number of true positives (and true negatives) was higher in the unweighted network and lower for the weighted network and this has caused a lower AUC for the weighted network. To develop a better understanding of the impact of weighted networks in link prediction, we recommend the use of a parameter a that controls the influence of the link weights similar to previous works. Furthermore, we intend to compare the performance of both VAR and SVM for the prediction of new links in unweighted and weighted networks.
Fig 7: Ideal Case, Predicted Unweighted, and Predicted Weighted for ranked predicted values. This is sorted in increasing predicted values. The block dots represent actual positive links and the uncolored dots are the actual negative links.
6. Acknowledgements Funding from DOST-ERDT is greatly acknowledged.
7. References [1] K. Regan, (August 2015). 10 Amazing Social Media Growth Stats From 2015. Social Media Today. [Online]. Available: http://www.socialmediatoday.com/social-networks/kadie-regan/2015-08-10/10-amazing-social-mediagrowth-stats-2015 [2] H. R. de Sá and R. B. C. Prudêncio, “Supervised Link Prediction in Weighted Networks,” in The 2011 International Conference on Neural Networks (IJCNN), San Jose, CA, July 21-August 5, 2011. [3] L. Lü and T. Zhou, “Role of Weak Ties in Link Prediction of Complex Networks,” in The 1st ACM International Workshop on Complex Networks Meet Information and Knowledge Management (CNIKM), Hong Kong, November 2-6, 2009. [4] D. Liben-Nowell and J. Kleinberg. “The Link Prediction Problem for Social Networks,” in The 12th International Conference on Information and Knowledge Management (CIKM), New Orleans, USA, November 3-8, 2003. [5] B. Zhu and Y. Xia, (February 2016). Link Prediction in Weighted Networks: A Weighted Mutual Information Model. PLOS. [Online]. Available: http://journals.plos.org/plosone/article?id=10.1371/journal.pone.0148265 [6]
A. Özacan and Ş G. Öğüdücü. “Multivariate Temporal Link Prediction in Evolving Social Networks,” in The 14th International Conference on Computer and Information Science (ICIS), Las Vegas, USA, June 28-July 1, 2015.
[7] J. M. Co and P. Fernandez, (April 2016). Improving the Vector Auto Regression Technique for Time-Series Link Prediction by Using Support Vector Machine, MATEC Web of Conferences. [Online]. Available: http://www.matec-conferences.org/articles/matecconf/pdf/2016/19/matecconf_iccae2016_01008.pdf [8] J.M. Co, (April 2016). Filtered DBLP for Time-Series Based Link Prediction. Research Gate. [Online]. Available: https://www.researchgate.net/publication/300928276_Filtered_DBLP_for_TimeSeries_Based_Link_Prediction?ev=prf_pub