Dec 9, 2010 - 2 Cooperative Communication in Wireless Networks. 9 ..... subscribers will reach a top mark of five billion [1] by the end of 2011 as ...... [45] S. B. Slimane, âCombined Transmitter Diversity and Multi-Level Modulation Tech-.
Link Reliability in Cooperative Relaying Using Network Coding
TAFZEEL UR REHMAN AHSIN
Licentiate Thesis in Communication Systems Stockholm, Sweden 2010
Link Reliability in Cooperative Relaying Using Network Coding
TAFZEEL UR REHMAN AHSIN
Licentiate Thesis in Communication Systems Stockholm, Sweden 2010
TRITA–ICT–COS–1007 ISSN 1653–6347 ISRN KTH/COS/R–10/07–SE
KTH Communication Systems SE-100 44 Stockholm SWEDEN
Akademisk avhandling som med tillstånd av Kungl Tekniska högskolan framlägges till offentlig granskning för avläggande av teknologie licentiatexamen i radiosystemteknik fredagen den 09 December 2010 klockan 14.00 i tbd. © Tafzeel ur Rehman Ahsin, December 2010 Tryck: Universitetsservice US AB
i Abstract Demand for high data rates is increasing rapidly for future wireless systems. This trend is due to the increase in the number of mobile subscribers that need bandwidth hungry multimedia applications anywhere, anytime. Fourth generation cellular systems like IMT-advanced are being developed to meet these requirements. The unreliable nature of the wireless medium is one of the main hinderance in providing high data rates. Cooperative communication in cellular networks is emerging as a new paradigm to deal with the channel impairments. User cooperation via fixed relays in cellular systems form multiple access relay channels (MARCs) and provide an effective and cost efficient solution to achieve spatial diversity gains. Network resources can be utilized efficiently by using network coding at cooperating nodes. A lot of research work has focused on highlighting the gains achieved by using network coding in MARCs. However, there are certain areas that are not fully explored yet. For instance, the kind of the detection scheme used at the base station receiver and its impact on the link performance has not been addressed. In most cases, the outage probability has been used as a performance measure of MARCs. However, it is well known that the outage probability gives information about the signal availability, but it does not give the complete picture about the reliability of the link and the achieved quality of service. This thesis work looks at the link performance, in terms of symbol error probability, of multiple access relay channels that employ network coding at the relay node. Different types of detection schemes are considered and their performance is compared under different link conditions. Analytical expressions for the average symbol error probability of the cooperating users are derived. Focusing on the uplink of cellular systems, certain rules are devised on how to group users at relay node to ensure mutual benefit for the cooperating users. As a way of improving the link performance of multiple access relay channels and their robustness, the thesis considers constellation selection for the different branches. This method takes advantage of the redundancy between the transmitted symbols created by network coding and the augmented signal space obtained at the base station receiver. The obtained results show that, with a proper selection of the constellation sets, the link performance of MARCs can be improved. The thesis further looks at the interaction between the channel coding schemes of the cooperating users and network coding. It is shown that joint channel-network coding in MARCs can be seen as a product code. This new representation provides considerable flexibility in selecting efficient decoding algorithms at the base station receiver and gives the possibility to use more powerful network coding schemes for MARCs.
Acknowledgements The work presented in this thesis has been carried out during my licentiate study at Department of Communication Systems (COS), ICT at Royal Institute of Technology (KTH), Sweden during the years 2008-2010. I would like to take advantage of this opportunity to acknowledge all the people who have supported me during this work. First and foremost I would express my sincere gratitude to my PhD supervisor Prof. Slimane Ben Slimane, for providing me a chance to study as graduate student and leading me into this interesting and challenging research topic. I greatly appreciate his generosity in sharing his expertise and time in our frequent discussions which always help to clarify my thoughts and inspire me with new ideas. I would also like to thank Prof. Jens Zander, head of department of communication systems, for his inspiring discussions through courses and seminars during the study period. I owe many thanks to Prof. Ove Edfors, Lund University, for acting as my opponent. I also greatly appreciate Docent Svante Signell for his keen efforts in quality checking of my thesis. Many thanks to all the colleagues at wireless@KTH for their continuous support during difficult times and special thanks to Ulla-Lena Eriksson and Irina Radulescu for their kindness and guidance in administrative matters. Last but not the least, my parents and my wife who have given me endless love and support, deserve warmest thanks.
iii
Contents List of Tables
vi
List of Figures
vii
1 Introduction 1.1 Related Work . . . . . . . . . . . . . . . . . . . . . . . . . . . . . . . . 1.2 Problem Formulation . . . . . . . . . . . . . . . . . . . . . . . . . . . .
1 2 5
2 Cooperative Communication in Wireless Networks 2.1 Multi-path Fading Channels . . . . . . . . . . 2.2 Cellular/Relay Systems . . . . . . . . . . . . . 2.3 Cellular/Relay Systems with Network Coding . 2.4 Summary . . . . . . . . . . . . . . . . . . . .
. . . .
. . . .
. . . .
. . . .
. . . .
. . . .
. . . .
. . . .
. . . .
. . . .
. . . .
. . . .
. . . .
. . . .
9 9 14 17 20
3 Link Performance of MARC 3.1 System Model . . . . . . . . . . . . . . . . . 3.2 Performance of Different Detection Schemes 3.3 Performance Comparison . . . . . . . . . . . 3.4 Detection Complexity . . . . . . . . . . . . . 3.5 User Grouping . . . . . . . . . . . . . . . . 3.6 Summary . . . . . . . . . . . . . . . . . . .
. . . . . .
. . . . . .
. . . . . .
. . . . . .
. . . . . .
. . . . . .
. . . . . .
. . . . . .
. . . . . .
. . . . . .
. . . . . .
. . . . . .
. . . . . .
. . . . . .
. . . . . .
21 21 23 35 37 37 40
4 Constellation Selection 4.1 System Model . . . . . . . . . 4.2 Joint Detection . . . . . . . . 4.3 Selection and Soft Combining 4.4 Summary . . . . . . . . . . .
. . . .
. . . .
. . . .
. . . .
. . . .
. . . .
. . . .
. . . .
. . . .
. . . .
. . . .
. . . .
. . . .
. . . .
. . . .
41 41 43 54 59
5 Joint Channel-Network Coding for MARC 5.1 System Model . . . . . . . . . . . . . . . . . . . . 5.2 Channel and XOR-based Network Coding . . . . . 5.3 Channel-Network Coding based on Product Codes 5.4 Analytical Performance . . . . . . . . . . . . . . .
. . . .
. . . .
. . . .
. . . .
. . . .
. . . .
. . . .
. . . .
. . . .
. . . .
. . . .
. . . .
61 61 62 65 68
. . . .
. . . .
. . . .
iv
. . . .
. . . .
. . . .
. . . .
. . . .
CONTENTS 5.5 5.6
v
Numerical Results . . . . . . . . . . . . . . . . . . . . . . . . . . . . . . Summary . . . . . . . . . . . . . . . . . . . . . . . . . . . . . . . . . .
72 76
6 Conclusions 6.1 Concluding Remarks . . . . . . . . . . . . . . . . . . . . . . . . . . . . 6.2 Future Directions . . . . . . . . . . . . . . . . . . . . . . . . . . . . . .
79 79 81
Bibliography
83
List of Tables 3.1 3.2
Truth table at receiver for BPSK . . . . . . . . . . . . . . . . . . . . . . . . Complexity comparison for the detection schemes . . . . . . . . . . . . . . .
4.1
Reduction in number of pairs containing MSED for different modulation schemes using joint detection . . . . . . . . . . . . . . . . . . . . . . . . . . . . . . . 47 Improvement in MSED by selecting proper constellation at the relay for different modulation schemes using SSC . . . . . . . . . . . . . . . . . . . . . 55
4.2 5.1
XOR-based network coding and its possible codewords in MARC. . . . . . .
vi
25 37
63
List of Figures 1.1 1.2
Forecast for number of mobile subscribers [1]. . . . . . . . . . . . . . . . . . Rapid increase in data rates for future Wireless Systems [2]. . . . . . . . . .
2.1 2.2 2.3 2.4
Cooperative Communications . . . . . . . . . Cellular/Relay System . . . . . . . . . . . . Network Coding in Butterfly Network . . . . Cellular/Relay System with Network Coding
. . . .
. . . .
. . . .
. . . .
. . . .
. . . .
. . . .
. . . .
. . . .
. . . .
. . . .
. . . .
. . . .
. . . .
. . . .
. . . .
2 3
. . . .
14 16 18 19
Transmission Scheme for Network Coded Cooperative Relaying . . . . . . . Receiver structure for Joint Detection Scheme . . . . . . . . . . . . . . . . . Tightness of bounds in case of joint detection. Average bit error probability of the users as a function of γ1 in Rayleigh fading channels. Case 1: γ1 = γ2 = γ3 , Case 2: γ3 = 20 dB, γ2 = γ1 . . . . . . . . . . . . . . . . . . . . . . . . . 3.4 Receiver structure for SSC Scheme, assuming U1 is the strongest user . . . . 3.5 Tightness of bounds in case of selection and soft combining. Average bit error probability of the users as a function of γ1 in Rayleigh fading channels. Case 1: γ1 = γ2 = γ3 , Case 2: γ3 = 20 dB, γ2 = γ1 . . . . . . . . . . . . . . . . . 3.6 Receiver structure for SHC, assuming U1 is the strongest user . . . . . . . . . 3.7 Tightness of bounds in case of selection and hard combining. Average bit error probability of the users as a function of γ1 in Rayleigh fading channels. Case 1: γ1 = γ2 = γ3 , Case 2: γ3 = 20 dB, γ2 = γ1 . . . . . . . . . . . . . . . . . 3.8 Average bit error probability for JD, SSC and SHC as a function of γ1 where γ1 = γ2 , using γ3 = 10 dB and γ3 = 20 dB in case of BPSK . . . . . . . . . 3.9 Average symbol error probability for JD, SSC and SHC as a function of γ1 where γ1 = γ2 , using γ3 = 20 dB in case of 8PSK . . . . . . . . . . . . . . 3.10 Selecting a suitable user pair at the relay on the basis of average bit error probability (BEP) of the users . . . . . . . . . . . . . . . . . . . . . . . . . 3.11 Average BEP of individual users at γsum = 10 dB and γ3 = 20 dB . . . . . . 3.12 Average BEP of individual users at γsum = 20 dB and γ3 = 10 dB . . . . . .
22 23
3.1 3.2 3.3
4.1
Comparing MSED for two branch transmit diversity using 4-PAM, (a) Same constellations on both branches (b) Selected constellation on branch 2 . . . . vii
26 27
30 31
34 35 36 38 39 39
42
viii
List of Figures
4.2
Comparison of SED Distribution in Augmented Signal Space, between Same Constellation (SC) and C1 using 8PSK . . . . . . . . . . . . . . . . . . . . . 4.3 Comparison of SED Distribution for individual users in Augmented Signal Space between Same Constellation case and using C1 by employing 8-PSK . 4.4 Comparison of Average Symbol Error Rate (SER) for SC and C1 using 8-PSK over AWGN channel. . . . . . . . . . . . . . . . . . . . . . . . . . . . . . . 4.5 Comparison of Average SER for SC and C1 using 8-PSK over Rayleigh fading channels. . . . . . . . . . . . . . . . . . . . . . . . . . . . . . . . . . . . . 4.6 Comparison of Average SER for SC and C1 using 16-PSK over Rayleigh fading channels. . . . . . . . . . . . . . . . . . . . . . . . . . . . . . . . . . . 4.7 Constellations used at nodes for 16-QAM (a) SC at all nodes (b) C1 at User 1 node (c) C1 at User 2 node (d) C1 at Relay node . . . . . . . . . . . . . . . . 4.8 Comparison of Average SER for SC and C1 using 16-QAM over Rayleigh fading channels. . . . . . . . . . . . . . . . . . . . . . . . . . . . . . . . . . 4.9 Performance of C1 using SSC as compared to Joint detection for 8-PSK over Rayleigh fading channels. . . . . . . . . . . . . . . . . . . . . . . . . . . . . 4.10 C1 for 16-QAM (a). Mapping for User 1 and User 2 (b) Mapping for Relay node 4.11 Performance of C1 using SSC as compared to Joint detection for 16-QAM over Rayleigh fading channels. . . . . . . . . . . . . . . . . . . . . . . . . . 5.1 5.2 5.3 5.4 5.5 5.6
5.7
5.8
5.9
Uplink of a cellular/relay system with network coding for N users. . . . . . . Representation of conventional (XOR-type) network coding at the relay station. Network decoding followed by channel decoding for conventional network coding in cooperative cellular/relay systems. . . . . . . . . . . . . . . . . . . Network coding scheme based on the principle of product codes in cellular/relay systems. . . . . . . . . . . . . . . . . . . . . . . . . . . . . . . . . Joint channel-network decoding for product code representation. . . . . . . . Comparison of joint channel-network decoding with separate channel-network decoding, using XOR as network code and (7, 4, 3) as channel code. All the links have the same received SNR γ0 . . . . . . . . . . . . . . . . . . . . . . Average bit error probability of the proposed network coding scheme with (15, 11, 3) × (7, 4, 3) in cellular/relay systems over Rayleigh fading channels when joint detection is employed for the column code and hard decision for the row code. All the links have the same received SNR γ0 . . . . . . . . . . . Average bit error probability of the proposed network coding scheme with (15, 11, 3) × (7, 4, 3) in cellular/relay systems over Rayleigh fading channels when the relay link is 10 dB better that user direct link. Joint detection is employed for the column code and hard decision for the row code. . . . . . . Average bit error probability of the proposed network coding scheme with (15, 11, 3) × (7, 4, 3) in cellular/relay systems over Rayleigh fading channels when iterative hard decision decoding is employed for both the row and column codes. All the links have the same received SNR γ0 . . . . . . . . . . . .
46 48 49 50 51 52 53 56 57 58 62 64 65 66 67
72
73
74
75
List of Figures 5.10 Average bit error probability of the proposed network coding scheme with (15, 11, 3)×(31, 21, 5) in cellular/relay systems over Rayleigh fading channels for different number of decoding iterations at the receiver. All the links have the same received SNR γ0 . . . . . . . . . . . . . . . . . . . . . . . . . . . . 5.11 Average bit error probability of the proposed network coding scheme with (n, k, d) × (7, 4, 3) in cellular/relay systems over Rayleigh fading channels for different row block codes. Joint detection is employed for the column code and hard decision for the row code. All the links have the same received SNR γ0 . . . . . . . . . . . . . . . . . . . . . . . . . . . . . . . . . . . . . . . . .
ix
76
77
Chapter 1
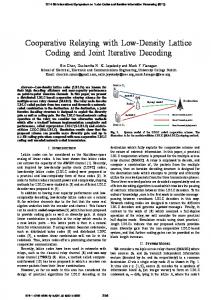
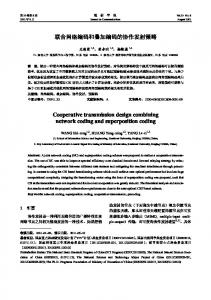
Introduction Cellular networks are convenient means of communication having key importance in business operations and acting as stimulus for economic development. The role of mobile communication in our daily lives has been expanded tremendously in the recent years due to the introduction of variety of advanced multimedia services, location based applications, video transmission and high speed internet access. Today more than four billion people are using the mobile phones [3]. It has been forecasted that the number of mobile subscribers will reach a top mark of five billion [1] by the end of 2011 as illustrated in Figure 2.1. Therefore, the amount of data traffic in wireless networks is anticipated to rise exponentially in order to provide wireless broadband services to these large number of subscribers. Hence, in order to transport this huge amount of data in acceptable time, the target data rates for wireless systems are increasing at the same speed. For instance the fourth-generation (4G) cellular systems, like IMT-advanced [4] are being developed to achieve peak data rates of 100 Mega bits per second (Mbps) during mobility while 1 Giga bits per second (Gbps) in indoor environments. It is interesting to observe that the demand for data rates in wireless networks is growing by a factor of 10 every 5 years, as illustrated in Figure 2.2. This increasing trend is the main motivating factor for development of novel wireless technologies for reliable and cost efficient transmissions. The introduction of multi-inputmulti-output (MIMO) systems [5–8] is a remarkable advancement in the field of communication theory during the last decade. Numerous practical schemes like spatial multiplexing and space-time coding are designed using multiple antennas on transmitter and/or receiver side. These schemes provide considerable improvement in spectral efficiency and signal reliability on the links. MIMO techniques and their variations are very popular in cellular applications. For instance, various standards, such as IEEE 802.11, IEEE 802.16, and IEEE 802.20 use these techniques. However, multi-antenna systems have their inherent limitations. For instance, deployment of complex antenna systems at user device becomes inappropriate due to size, cost and power limitations. Cooperative communication is an innovative technique that takes the advantage of broadcast nature of wireless channels and can achieve spatial diversity gain without de-
1
CHAPTER 1. INTRODUCTION
2
Figure 1.1: Forecast for number of mobile subscribers [1].
ploying multiple antennas at the nodes. This new transmission paradigm forms an efficient virtual multi-antenna system in a cellular network. Consequently, significant performance gains can be achieved in terms of link reliability, system capacity and coverage. Cooperative communication has the ability to provide an effective and cost efficient solution for future wireless generations. For instance, high frequency bands proposed for 4G spectrum motivates to minimize the distance between transmitters and receivers, in order to reduce the high transmission losses. A brute force solution is to deploy more base stations for reducing the cell size. However, this results into an economically infeasible solution [9]. Instead, relays can be used to realize cooperative multi-hop transmission, taking the advantage of the nonlinear relationship between the distance and propagation loss [10], that helps in reducing the overall signal attenuation as compared to single hop transmission. Consequently, highlighting the effectiveness of cooperation for providing high data rates at the cell edges. Moreover the relays, that can be fixed stations or mobile devices, do not require backbone networks, making the cooperation between nodes cost efficient. In addition, relays are less expensive and requires less power than base stations. It has been shown in [11] that cost per transmitted bit can be reduced by a factor of two to three using cooperative relaying. Another economical evaluation in [12] shows that for an unplanned deployment, justifiable gains in terms of cost can be achieved if the relay is about 10% of the base station cost. In short, due to its enormous advantages, cooperative communication has emerged as a popular research area in cellular communication these days.
1.1 Related Work The basic idea of relaying, i.e. the foundation of cooperative communications, has been introduced in [13]. Later on information theoretic properties of relay channels have been studied in [14]. In these pioneering contributions, maximum achievable communication rate has been derived for a basic three terminal model, containing a source, a relay and a destination. The idea of user cooperation has been introduced by [15, 16] for uplink transmission that improves the capacity and lowers the outage probability for a given data rate.
1.1. RELATED WORK
3
Figure 1.2: Rapid increase in data rates for future Wireless Systems [2].
A cooperative protocol is designed where two cooperating partners listen to the broadcasted packet and retransmit the data for each other. This technique also helps in improving the diversity gain, as both transmitting nodes have uncorrelated channels with the destination. Later, [17] extended the concept of cooperation, by designing energy efficient multiple access protocols based on decode-and-forward (DF) and amplify-and-forward (AF) relaying modes. Significant gains in terms of outage probability as compared to direct link transmission has been illustrated in his work. In addition to fixed relaying modes, an outage probability analysis in [18] has been carried out for adaptive and incremental redundancy modes. Distributed channel codes are used at relaying nodes for improving the bit or block error rate in [19–21]. A number of interesting relaying strategies including repetition coding [22–24], space time cooperation [25], and space time coded cooperation [26] have been proposed and significant gain in terms of error performance, outage probability and power efficiency has been illustrated. Many authors have considered the use of network coding [27], a routing technique initially proposed for wired networks, in order to combine the received packets at the relay and improve the link efficiency. For instance [28, 29] proposed a new framework, termed as adaptive network coded cooperation (ANCC) for reducing the outage in a multi terminal network by using low density parity check codes (LDPC) at intermediate nodes. Similarly [30] has investigated the diversity gain using exclusive-OR (XOR) based network coding for multiple access relay channel (MARC) and showed that network coding improves the bandwidth of MARC from 1/2 to 2/3, without affecting its diversity gain. However, this investigation considers only the outage probability as a performance measure. Here system is considered in outage, when signal to noise ratio (SNR) for two out of three direct links is below some threshold. Another investigation in [31], considers adaptive transmission of network coded packet based on its correct reception at relay and analyze the outage probability for individual user. The outage probability analysis performed in these works highlights the importance of network coding in MARC in terms of link efficiency, and
4
CHAPTER 1. INTRODUCTION
clearly shows how often a transmission is possible. However system/individual outage does not reflect the gain or loss in terms of SNR for a given bit or block error rate. In the literature, different methods are considered to combine the directly received signals and relayed signals at the receiver in case of MARC. For instance, based on outage definition in [30], it implies that a user is either detected directly or using other two correctly detected links. However the detection scheme used in [30] is not clearly mentioned. Similarly some authors like [32], perform the detection by considering all the received signals jointly, that increases the detection complexity at the receiver. Moreover, [33] has considered a detection scheme based on successive cancelation of users while analyzing the capacity of network coded MARC. In short, different detection methods are used implicitly in previous work and no effort has been made to compare the performance of these methods. [33] has also looked into the issue of user grouping at the relay, as network coding at the relay, couples the performance of the combined users with each other. However, analysis is not done in detail and impact of user grouping on link reliability of users is not considered. Some other works [34–37] determine throughput improvement for various relaying structures using network coding. Recently network coding has been considered useful for saving network resources in a report on green wireless communications [38]. In addition to achieving diversity and throughput gain, network coded packet can also be used to correct transmission errors. XOR based combining has been used at the relay by many authors, as it is simplest form of network coding. However, XOR based network coding does not exhibit an error correction capability. Moreover, it is not feasible to combine multiple users at a relay using this technique. Therefore, the concept of distributed channel codes has been generalized to design joint network-channel codes in many research works. For instance, [39] has used nested codes for realizing joint network-channel coding in a network containing multiple source nodes and a single relay. It has been shown that for a given throughput the reliability of transmitted signal is better in this case, than considering network and channel coding separately. Similarly, [40] has proposed a scheme known as generalized-adaptive network coded cooperation (GANCC) for wireless Ad-hoc networks, in order to prove that network coding is a generalization of channel coding. Moreover, [41] has considered the use of distributed turbo codes for the MARC and proved that the joint network-channel coding is better than separate network-channel coding. Similarly it has been illustrated in [42] how low-density parity-check (LDPC) code can be used to design joint network-channel coding scheme for MARC. Above methods are quite useful in improving the bit or block error rate of the users, however requires complex encoding and decoding methods while combining multiple users. The concept of joint network-channel coding is also used for two way relay channels as described in [43]. Very recently [44] has proposed a practical method to combine non-binary channel coding with network coding for two source two relay topology in wireless network.
1.2. PROBLEM FORMULATION
5
1.2 Problem Formulation In heavily loaded cellular networks it is not difficult to find devices that can relay data for other users. However, device-to-device cooperation raises certain concerns. These concerns include, battery drainage at fast rate due to helping other users, need of additional hardware and software than conventional devices, frequent relay hand-offs due to mobility of the relaying device and billing issues. These limitations are not present in the case of fixed relays. Fixed relays are normally placed at the locations that are good for transmitting/recieving signals to/from base stations. In addition, relays have comparatively stable channel conditions as compared to cooperating terminals, hence the delivered performance is comparatively more predictable in the former case. Based on the key findings described in previous section, this thesis work looks at the link performance of cellular relaying systems. We focus our study on the uplink and we assume that users have the possibility to cooperate via fixed relays with the help of network coding. This user cooperation provides the base station receiver with some redundancy via different links. How to use these links will impact the performance of the cooperating users. For that, the thesis looks at the error probability of different detection strategies for different positions of the cooperating users within the cell. As the relay has the possibility to choose the cooperating users, it is important to investigate which users should cooperate and on what basis should they be paired such that the error probability is improved for both cooperating users. Cooperation via a fixed relay provides, not only, a diversity but also increases the signal space dimension seen at the base station receiver. This augmented signal space [45, 46] can be used to design better multi-level modulation schemes that can take advantage of the diversity gain as well as the augmented signal space. The question addressed here is, how to find the appropriate signal constellations for the cooperating users and the relay node in the presence of network coding. Network coding combines the user signals at the relay node and creates some redundancy that can be used in designing the signal constellation set of each of the three links. When the cooperating users are employing channel coding, network coding employed at the relay node can be seen as an extra redundancy added to the user signals. It will be shown, in this thesis, that channel coding in the uplink of a cellular/relay system with network coding can be seen as a product code with rows formed by the individual codewords of the users and columns formed by the used network coding scheme. This new structure can be used to design good network coding schemes for cellular/relay systems and open the possibility to use well known decoding algorithms at the base station receiver. These decoding algorithms are quite efficient as they see the channel coding of the cooperating users and the network coding scheme as one single code.
1.2.1 Thesis Contributions and Outline This thesis looks at the performance of cooperative communication in cellular systems. Cooperation is achieved via fixed relays and with network coding combining. The thesis is a mixture of analytical and simulation results. Most of the results obtained in the thesis have been reported (submitted and accepted) in different international conferences and
6
CHAPTER 1. INTRODUCTION
journals. The thesis is presented in six chapters as follows: Chapter 2 This chapter gives a brief description of cooperative communication in wireless communication with a special emphasis on cooperative relaying in cellular systems. The principle of network coding and its advantages for wireless applications and cooperative communication is described. Chapter 3 This chapter looks at the link performance, in terms of bit error probability, of the MARC with network coding. Different detection schemes are considered and their performance is compared under different link conditions. Analytical expressions for the average bit error probability of the cooperating users are derived. Focusing on the uplink of cellular systems, we look at the performance of MARC and how to group users in the cooperation process. The main results of this chapter have been reported in [T.1] Tafzeel ur Rehman Ahsin and Slimane Ben Slimane, “Detection strategies in cooperative relaying with network coding,” IEEE PIMRC 2010, Istanbul, Turkey September 2010. [T.2] Jie Xu, Tafzeel ur Rehman Ahsin, Ling Qiu, and Slimane Ben Slimane, “Scheduling, pairing and ordering in the network coded uplink multiuser mimo relay channels,” in proceeding of VTC 2010-Spring Taipei, Taiwan May 2010. [T.3] Jawad Manssour, Tafzeel ur Rehman Ahsin, Slimane Ben Slimane and Afif Osseiran, “Detection strategies for cooperative network coding: Analysis and performance,” submitted to IEEE Transactions on wireless communications, 2010. Chapter 4 This chapter considers constellation selection as a way of improving the link performance of MARC in cellular systems. The idea is, with high-level multi-level modulation, to use a different constellation set for each link of the MARC. This method takes advantage of the redundancy between the transmitted symbols created by network coding and the augmented signal space obtained at the base station receiver. The obtained results show that, with a proper selection of the constellation sets, the link performance of MARC in both additive white Gaussian noise (AWGN) channels and fading multi-path channels can be improved. The main results of this chapter have been reported in [T.4] Tafzeel ur Rehman Ahsin and Slimane Ben Slimane, “Constellation selection in network coded distributive antenna systems,” IEEE GLOBCOM 2009, Hawaii, USA Dec 2009.
1.2. PROBLEM FORMULATION
7
Chapter 5 This chapter considers a new alternative to improve the link performance of MARC in cellular systems when the cooperative users employ channel coding. The study is limited to linear block codes where it is shown that the combination of channel coding and network coding in MARC can be seen as a product code. This finding provides us a possibility to use a decoding algorithm at the base station receiver that sees the combination of user channel coding and network coding as a single code. As several decoding algorithms for product codes exist in the literature, joint channel-network decoding can now be achieved for MARC and recovers the performance loss due to separate channel-network decoding. The proposed representation also allows the use of more powerful network coding schemes. It also gives the possibility to involve more than two users in the cooperation process via each relay simultaneously. Results from this chapter have been reported in [T.5] Tafzeel ur Rehman Ahsin and Slimane Ben Slimane, “Product coding based network coding in cooperative relaying,” IEEE WCNC 2010, Sydney, Australia, April 2010. [T.6] Tafzeel ur Rehman Ahsin and Slimane Ben Slimane, “Product Coding: A joint channel-network coding scheme for the multiple access relay channel,” submitted to IEEE Transactions on wireless communications, 2010. Chapter 6 This chapter gives concluding remarks about the results of the thesis and provides some directions for future research activities in the area.
Chapter 2
Cooperative Communication in Wireless Networks An important challenge in cellular communication nowadays is to design an energy and cost efficient network that provides high data rate and coverage. One of the main hinderance to these objectives is the unreliable nature of wireless channels, caused by inherent channel fading. Cooperation [16] between the nodes in a cellular network helps in combating channel impairments. Relays can take advantage of broadcast nature of wireless channels and allow the users to cooperate, by retransmitting their data packets towards the base station. Therefore relays break the single hop transmission into multi-hops and help in reducing the propagation loss between transmitter and the receiver [10]. Moreover, multiple copies of the same information is reached at destination due to relaying. Diversity gain can be achieved by combining these multiple copies at the destination and consequently, signal reliability on the links can be improved. Using network coding [27] at relays, provide an intelligent way to utilize network resources efficiently. For instance, relay can combine multiple received packets using network coding and send them towards destination as a single packet. Therefore cellular relay with network coding has the ability to improve the system throughput. This chapter provides necessary background on cellular relaying and its integration with network coding. Section 2.1 discusses cooperative cellular relaying while section 2.2 describe the advantages of integrating, network coding in cellular relaying.
2.1 Multi-path Fading Channels The physical medium through which the information signal travels, from transmitter to the receiver is called communication channel. For instance, telephone line in wired system and environment between the transmitter and the receiver in wireless system is termed as communication channel. Wireless channels are highly unpredictable in nature, both in time and frequency domain. The distortion experienced by the received signal after propagating through wireless channel is termed as fading. In multi-path propagation, the transmitted 9
10 CHAPTER 2. COOPERATIVE COMMUNICATION IN WIRELESS NETWORKS signal can take several paths to reach the receiver. The signals reaching through different paths experience different delays. The superposition of these signals at the receiver can be constructive or destructive depending upon the delays introduced by each path. This causes variation in received signal strength, frequency and phase at the receiver and thus give rise to multi-path fading. The multi-path fading can be further divided into two types, i.e. large scale fading and small scale fading. Large scale fading represents the variation in the mean of received signal power over the large distance as compare to the wavelength of the signal. It occurs when receiver is shadowed by large terrain obstacles such as hills or buildings. Large scale fading is often expressed in terms of mean path loss and log-normal distributed variation about the mean for a given distance between transmitter and the receiver [47]. Log-normal distribution means that the logarithm of signal power follows normal distribution. Small scale fading involves the variation in received signal power over small distances, comparable or less than wavelength of the signal. This occurs due to scatters present in the channel. These scatters are created due to reflection, diffraction and scattering of radio waves from various objects and surfaces situated between the transmitter and the receiver. The received signal is the summation of all these scattered signals. This causes fluctuations in the received signal strength. Let us assume that the bandpass signal s(t) is transmitted during an interval 0 ≤ t ≤ T . It can be expressed in terms of its baseband waveform sl (t) as follows s(t) = ℜ{sl (t)ej2πfc t }
(2.1)
where ℜ{.} denotes the real part of {.} and fc is the carrier frequency. While traveling through multi-path fading environment s(t) will be modified by a complex dimensionless factor α(t) that takes care of both large and small scale fading. If the antennas remain within a limited trajectory, the effect of large scale fading can be considered constant (for instance, equal to unity) [47]. Assuming that there are i multiple scattering paths, each having time variant propagation delay τi (t) and a time variant multiplicative factor αi (t), the received bandpass signal can be written as follows y(t) =
X
αi (t)s[t − τi (t)] + z(t)
ℜ
"
i
=
X i
#
αi (t)e−j2πfc τi (t) sl (t − τi (t)) ej2πfc t
!
+ z(t)
(2.2)
where z(t) at any instant t denotes additive white Gaussian noise (AWGN) at the receiver with zero mean and known variance. Main sources of AWGN includes thermal motion of electrons in antenna, shot noise, black body radiation etc. As z(t) is the sum of large number of statistically independent random variables hence according to the central limit theorem [47], it is modeled as Gaussian random variable. Moreover, since the two sided power spectral density of the noise is considered constant for all the frequencies of interest hence it is termed as white noise. An equivalent received baseband signal can be obtained
2.1. MULTI-PATH FADING CHANNELS by neglecting carrier frequency multiplication factor in (2.2) as follows X yl (t) = αi (t)e−j2πfc τi (t) sl (t − τi (t)) + z(t)
11
(2.3)
i
Since yl (t) is the response of an equivalent baseband channel to an equivalent baseband ´ ; t) can signal sl (t), the expression for time variant baseband channel impulse response h(τ be obtained as follows X ´ ; t) = αi (t)e−j2πfc τi (t) δ(τ − τi (t)) h(τ i
=
X i
´hi (t)δ(τ − τi (t))
(2.4)
´ i (t) is the complex attenuation factor of path i. It is obvious that if the number where h of scattering paths is large and none are dominant, then according to central limit theorem ´ ; t) can be modeled as zero mean complex valued Gaussian random process and the h(τ ´ ; t) at any instant t has Rayleigh probability density function (pdf). received envelope h(τ
Therefore the channel is modeled as Rayleigh fading channel in this case. In the presence ´ ; t) cannot be modeled as having of fixed scatters, in addition to moving scatters the h(τ zero mean and hence fading can be modeled as Rician distributed random variable [48]. The two important manifestations of small scale fading are the time spreading of the received signal and the time variation of the channel. Let us look at both one by one as follows.
a) Time Spreading Rather simplified approach to model small scale fading is to use the notion of wide-sense stationary uncorrelated scattering (WSSUS), where all the signals arriving at the receiver with different delays are considered as uncorrelated [47]. For a single transmitted impulse the time Tm between the first and last (considering that signal power falls below some threshold) received component represents the maximum delay spread. The coherence bandwidth Bm is a statistical measure of the range of frequencies over which channel treats all the spectral components similarly. Therefore the signal components falling outside the coherence bandwidth will be treated differently by the channel. In other words, coherence bandwidth is an analogous characterization of signal dispersion in frequency domain. Time spreading of a signal at the receiver provides us the information about frequency selectivity of the fading channel. For instance, a fading channel is said to be frequency non selective or flat fading if signal bandwidth W is less than coherence bandwidth of the channel. However, if signal bandwidth is greater than coherence bandwidth, different spectral components will be affected by the channel differently and the channel is known as frequency selective channel. Small scale fading limits the maximum achievable data rate since we are limited to choose W < Bm in order avoid frequency selectivity. Moreover the time dispersion of one transmission due to multi-path components effects one or more successive output symbols and cause inter symbol interference (ISI).
12 CHAPTER 2. COOPERATIVE COMMUNICATION IN WIRELESS NETWORKS Instead of using complex channel equalizers at the receiver, ISI can be mitigated using orthogonal frequency division multiplexing (OFDM). This scheme transforms high data rate stream into set of parallel low data rate streams, thus providing help against time spreading phenomena in multi-path channels. In OFDM, the input data stream is first modulated in baseband using any modulation scheme. The modulated data stream, with symbol duration Ts is then converted to N different data streams. Each stream is modulated by a specific subcarrier waveform and the addition of all the streams results into bandpass OFDM transmitted symbol/block. By proper selection of number of carriers N , the duration of OFDM block T = N Ts can be made larger than Tm in order to reduce the effect of symbol interference. However, OFDM can remove the interference (both inter symbol and inter carrier) completely by extending the OFDM block length at the transmitter side, by using a time guard interval Tg > Tm [10]. Assuming L as the number of multi-paths, the received baseband OFDM signal can be written as yl (t) =
L−1 X i=0
´ i (t)sl (t − τi (t)) + z(t) h
(2.5)
´ i is as defined in (2.4), sl (t) is the equivalent baseband OFDM transmitted signal where h in nth block interval and can be written as sl (t)
=
N −1 X
sm (n)gm (t),
m=0
=
nT − Tg ≤ t < (n + 1)T
N −1 X m 1 p sm (n)e2π T t T + Tg m=0
(2.6)
Here sm (n) is baseband modulated symbol and gm (t) represents the orthogonal subcarrier waveform. The subcarrier waveforms retain the orthogonality property over the duration of the useful part of the signal, i.e. over T only. The orthogonality property is preserved only if (Tg ≥ Tm ) and the OFDM receiver synchronizes to the first arriving path. The addition of the time guard interval in the OFDM system provides a time delay margin for the subcarrier waveforms for which the orthogonality property is always preserved [10]. Hence, by using a time guard interval, inter symbol and inter carrier interference will be absorbed and the receiver can safely ignore this added guard interval at the receiver side. The useful part of the received signal during the nth block interval in a slowly varying fading multi-path channel (fading coefficient can be considered constant during one OFDM block) can be written as
yl (t) =
N −1 X
H(m/T ; t)sm (n)gm (t),
m=0
and
H(m/T ; t) =
L−1 X i=0
nT ≤ t < (n + 1)T
´ i (t)e−j2π m T τi (t) h
(2.7)
(2.8)
2.1. MULTI-PATH FADING CHANNELS
13
represents the transfer function of the fading multi-path channel. After passing through the correlation receiver, the output sample of subcarrier k becomes yk (n) =
Z
(n+1)T
nT
=
yl (t)gk∗ dt
h(t)sk (n) + zk (n)
(2.9)
where h(t) represents the channel coefficient and can be written as h(t) =
s
T H(k/T ; t). T + Tg
It can be observed from (2.9) that the output sample is completely free from inter-symbol interference and inter-carrier interference. However, in the presence of strong multi-path components, some carriers could be in deep fades due to destructive combination of the paths. In crux, with the introduction of the time guard interval in OFDM, it is possible to transform a frequency selective fading channel into N parallel frequency nonselective (flat) fading channels.
b) Time Variation of the Channel Multi-path channel becomes time variant due to the relative motion between the transmitter and the receiver (or vice versa). This relative motion causes the frequency of the received signal to be shifted relative to that of the transmitted signal. This Doppler shift fd , is proportional to the velocity of the receiver and the frequency of the transmitted signal [48]. Since the received signal travels over several reflected paths and each path have different doppler shift hence multi-path propagation creates spectral or Doppler spreading. An analogous characterization of time variant channel in time domain is coherence time T0 . It is the measure of the expected time duration over which the channel response remains essentially invariant [47]. Time variation of the channel results into slow or fast fading on the channel. For instance if the coherence time of the channel is less than the signal transmission time Ts the channel is known as fast fading channel. However, if coherence time is larger than Ts , the fading is termed as slow fading. Fast fading causes synchronization related issues at the receiver hence more robust modulation scheme that doesn’t require phase tracking is needed for its mitigation. Another method to cope with fast fading is to use error correction codes for increasing the symbol rate. In practical wireless communication systems, the channel is usually constant over several symbols and therefore the channel coefficient h(t) in (2.9) for nth block interval can be written as h(t) ≃ h(nN Ts ),
nN Ts ≤ t < (n + 1)N Ts
(2.10)
14 CHAPTER 2. COOPERATIVE COMMUNICATION IN WIRELESS NETWORKS
Figure 2.1: Cooperative Communications
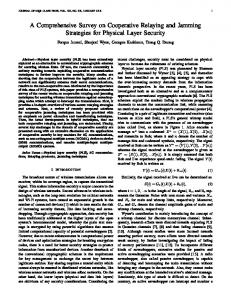
2.2 Cellular/Relay Systems Once the channels can be modeled as flat fading channels, diversity techniques [10] can be employed to reduce the effects of fading on the link performance, by transmitting the same information on more than one channel. The gain achieved in terms of SNR is known as diversity gain. Maximum diversity gain can be obtained when all the channels are uncorrelated and the number of these channels defines the diversity order. Diversity techniques can be employed along different dimensions, i.e. time, frequency and space. By employing time and frequency diversity techniques, bandwidth efficiency of the system is reduced as multiple resources are used for the same information data. Spacial diversity can be achieved by using multiple antennas [5–8] at transmitter and/or receiver and allowing the signal to propagate along independent paths. In this case bandwidth efficiency is not affected, however power is shared between all the transmit antennas. Capacity of the system can also be enhanced using spatial multiplexing in this case. So depending upon the application there is tradeoff between the achieved diversity and the multiplexing. However, to achieve spacial diversity, adequate spacing between the antennas is needed to ensure independence between different channels. More spacing between antennas is required in case of using low frequencies and poor scattering environment. However due to limitation on size, cost and hardware complexity for most of the cellular handsets and other wireless devices, it is difficult to place multiple antennas on them. An efficient and inexpensive method to deal with these limitations is to employ the concept of cooperative communications introduced in [16]. Cooperative communication takes the advantage of the broadcast nature of wireless channel and allows different nodes in the cellular network to share their antennas to build a virtual MIMO system without limitations on size and cost. Figure 2.1 illustrates how cooperative communication between nodes can generate diversity in an interesting way. The figure shows two nodes communicating with the same destination. Each node has single antenna and hence cannot generate spatial diversity individually. However, due to broadcast nature of the wireless channel it may be possible for one node to hear the other and forward some version of heard information along with/without its own data. Due to
2.2. CELLULAR/RELAY SYSTEMS
15
the statistically independence of both fading paths, spatial diversity can be generated. These cooperating nodes can be user devices or fixed relays deployed in cellular network. In the former case, user devices cooperate by transmitting each others data in addition to their own data, known as user cooperation [18, 22]. In the later case, relay cooperate with user and forward its data towards the destination, termed as cooperative relaying [30, 31, 41]. Both modes of cooperation have the potential to provide gain in terms of coverage and cooperative diversity. However cooperative relaying has more practical significance because dedicated relays are static and have relatively stable channel conditions with the destination. Moreover relays can handle complex operations easily without constraints like limited battery life as in case of user equipment. On the other hand, some complicating issues like reduction in rate of cooperating user and fairness between the cooperating users need to be addressed while employing user cooperation mode. Therefore, it is encouraged to use relays as cooperating nodes as compared to user terminals as indicated in [49]. After initial investigations on relay channels in [13, 14], this concept has regained interest due to the introduction of cooperative communications in [16–18]. The concept of relaying is proposed for cellular networks in [50], to balance traffic load among highly loaded cells and lightly loaded cells. In literature different wireless standards have used the concept of in-band and out-of-band relaying for improving the performance and capacity of links [51]. Relays can extend the coverage and eliminate the black spots in the network.
2.2.1 Relaying Protocols Different relaying protocols are discussed in the literature [18, 22, 49] and can be summarized as follows
a) Amplify and Forward (AF) In this scheme relay acts as repeaters. For instance, during first time slot source transmits data towards destination. Relay also listens to the transmission due to broadcast nature of wireless medium. It amplifies and retransmits the received signal towards the destination. Finally both the direct and relayed signal is combined at the receiver and diversity gain can be achieved. The main limitation of this method is that the noise present in the received signal at the relay also gets amplified.
b) Decode and Forward (DF) In this scheme, relay act as intelligent repeater and decodes the received signal sent by the source in first time slot. It retransmits the signal towards the destination after re-encoding the signal in second time slot. DF relaying solves the problem of noise amplification present in AF relaying, however at the expense of more complexity. Moreover, during decoding and re-encoding relay introduces errors into re-transmitted signal. The achieved diversity gain is limited by this error propagation phenomena.
16 CHAPTER 2. COOPERATIVE COMMUNICATION IN WIRELESS NETWORKS
Figure 2.2: Cellular/Relay System
c) Selection Relaying Selection relaying helps in improving the performance of AF or DF relaying by adaptively choosing between the direct transmission path and the relay path. It implies that if direct path is better, user will retransmit its data during the second time slot. However if relay path is better then relay forwards the data in second time slot. However, relay need to acknowledge the user about its retransmission if relay path is better. [24] proposes a scheme based on coded cooperation that can be considered as variation of selection decode-andforward.
d) Incremental Relaying This scheme is suitable for high data rate transmission as it tries to avoid the variations of repetition coding, performed in above mentioned schemes. Here destination decodes the direct transmitted signal during first time slot and acknowledges relay if there is any error in the received message, for instance using cyclic redundancy check. If there is no error, the destination sends a one bit message to source and relay, telling the source to transmit second message. Otherwise relay forwards the received data towards destination in second time slot. Then destination combines direct and relayed signal for decoding.
2.3. CELLULAR/RELAY SYSTEMS WITH NETWORK CODING
17
2.2.2 The Multiple Access Relay Channel Cooperative relaying in the uplink of cellular systems, also known as multiple access relay channel, consists of a set of fixed relay stations placed within the cell. These relays are intended to help nearby mobile users to forward their messages toward the base station. Figure 2.2 illustrates the case of mobile users sharing one relay station to communicate with the base station. Here, it is assumed that the three nodes are using orthogonal channels (can be achieved by time, frequency or code division). With relays operating in half duplex mode, i.e. the relay cannot transmit and receive at the same time, therefore the cooperative transmission is achieved in two phases [18]. In the first phase, each mobile user transmits its own information data on orthogonal channels. The relay receives and decodes the data of the mobile users. In the second phase, the relay station forwards the user data on orthogonal channels as well. The base station receives both the original data (from the direct links) and the relayed signals, and combine them to decode the user information. This gives a diversity gain of order 2 for each user as the direct and relayed signals reach the base station via independently fading channels. When time division is employed as orthogonal access method, the transmission phases require a total of four time slots, two time slots for the first phase and two time slots for the second phase. Cooperative relay makes it possible for users far away from the base station to reach the base station and to achieve its required quality of service. However, as the number of fixed relays are usually less than the number of users within the cell, entertaining one user per relay makes cooperative relaying a queue limited system [30]. Moreover, due to the orthogonal operation of the cooperation process in MARC, the spectral efficiency of cellular relaying is reduced by half as compared to direct link transmissions.
2.3 Cellular/Relay Systems with Network Coding Network coding has been introduced by [27], in order to improve the throughput in wired networks by performing some processing on received packets at the intermediate nodes. This technique combines the received packets at intermediate nodes, so that these combined packets are transmitted to all the recipients instead of forwarding each packet individually. Butterfly network shown in Figure 2.3 is the most common example to illustrate the significance of network coding. Here the sources S1 and S2 need to transmit their respective massages to both destinations D1 and D2. Without network coding the middle link limits the throughput as only one stream can pass through at a time, i.e. either from S1 or S2. However using network coding both streams can be combined using bit-wise XOR coding as illustrated in this example. Hence data for both sources passes through the single link simultaneously improving the overall throughput of the system. Most of the initial work on network coding assumes fixed transmitters and receivers with static traffic flows etc. However, researchers have soon realized that the broadcast nature of wireless channel makes network coding quite favorable candidate for combining the signals at nodes. The situation described in Figure 2.2 can be improved using network coding at the relay. This has been illustrated in Figure 2.4, by considering two user uplink scenarios. It is quite obvious that network coding helps in reducing number of transmissions in this
18 CHAPTER 2. COOPERATIVE COMMUNICATION IN WIRELESS NETWORKS
Figure 2.3: Network Coding in Butterfly Network
scenario. For instance, in the first transmission user 1 sends its data towards the base station. During the second transmission user 2 sends its data towards the base station. These two transmissions are listened by the relay and relay combines the two transmissions depending upon the network coding protocol used at the relay. The combined data is then sent towards the base station in the third transmission. The base station combines the three received signals, i.e. two direct signals and one network coded signal, in order to detect the two user signals. Since the network coded signal contains information for both users, hence signal for each user reaches the base station via two independent paths. Consequently, using three transmissions diversity order up to two can be achieved as illustrated in [30]. Therefore network coding operation reduces the number of transmissions by one transmission as compared to the conventional cellular relaying scenario depicted in Figure 2.2. Therefore, throughput in cellular relaying or MARC can be improved by using network coding. On the other hand, if we fix the allowed number of transmissions from relays to one in case of conventional cellular relaying, it is not possible to achieve full diversity gain as both relays have to share the available transmission [41]. Figure 2.4 illustrates the case of two mobile users and one fixed relay. In a more general cellular network, with a large number of users and multiple relays per cell, the multiple access relay channel can be made more reliable. Here, the access scheme is the same. In this case, each user still transmits its own information data in the first phase on orthogonal channels achieved by time-division. However, in the second phase, a single best relay is selected from the multiple relay candidates within the cell to forward the network coded data of the cooperating users to the base station. The best relay is the one that maximizes the worst instantaneous channel conditions of the links from users to the relay and from the relay to the base station. This opportunistic relay selection improves the link reliability of the cooperating users within MARC and reduces error propagation at the relay node. Different network coding protocols have been described and studied in the literature.
2.3. CELLULAR/RELAY SYSTEMS WITH NETWORK CODING
19
Figure 2.4: Cellular/Relay System with Network Coding
These network coding protocols can be classified as digital network coding and analog network coding (or physical network coding).
2.3.1 Digital Network Coding Digital network coding at the relay is performed at the packet level. Packets received from the cooperating users are first decoded and combined using bitwise XOR operation or using any other combining method. This implies that the used relays need to have decoding capability, so that they can decode the signal sent by users and combine these signals using network coding operation. Therefore, decode-and-forward relays are required to perform digital network coding at the relay node. The main advantage of this method is the use of orthogonal access methods. This does not allow user transmissions to interfere with each other. It also gives the possibility of interaction, between channel coding used by the cooperating users and network coding. This interaction opens the door for designing efficient network coding schemes and efficient decoding algorithms at the base station receiver. However, as mentioned earlier, digital network coding requires three transmissions as compared to two transmissions for the non-cooperating case.
2.3.2 Analog Network Coding Analog network coding or physical-layer network coding at relay is done on signal level. This scheme allows mobile users to transmit at the same time in the first phase, and some smart physical layer techniques transform the superposition of the electromagnetic waves into an equivalent network coding operation that mixes the user signals in the air. It implies
20 CHAPTER 2. COOPERATIVE COMMUNICATION IN WIRELESS NETWORKS that instead of performing bitwise XOR operation as in case of digital network coding, this protocol allows to interfere two analog transmissions sent by users simultaneously. Here, network coding is created on the electromagnetic waves in the air rather than in baseband (at the bit level). Depending upon the relaying protocol (AF or DF) used at the relay station, the combined signal is sent to base station in second transmission slot. Therefore, with the dime-division multiple access, this network coding protocol requires only two transmission slots as compared to three time slots in the case of digital network coding. When a DF relay is used, the simultaneously received signals are mapped into a new signal recognizable by base station, through a mapping that combines the two mapping of the different symbols of the users as described in [52, 53]. This mapping represents the joint symbols of the two combined signals and does not mean that each user is decoded separately. This method has the advantage of preventing noise amplification at the relay node but it has the obvious drawback of error propagation and the ambiguity between symbols especially for high-level modulation. It also requires perfect synchronization between the user signal which is quite difficult to achieve especially in fading multi-path channels. When an AF relay is used, then it simply amplifies the simultaneously received signals and forwards the data towards base station. This method is attractive due to its simplicity and does not require synchronization between the cooperating user signals. However, the inherent drawback of this scheme appears in possible noise amplification due to the amplification of the received at the AF relays. In general, there is a tradeoff between required number of transmissions and generated interference while using different network coding protocols at relay.
2.4 Summary In this chapter we have discussed how cooperative communication can be realized using relays. The importance of network coding in multiple access relay channels is highlighted. It is obvious that network coding is helpful in saving network resources in cellular relaying systems. Therefore, we choose network coded MARC as our system model in the rest of this monograph and investigate the link performance in such scenarios. Special emphasis is given on analyzing different factors that can make links more reliable. In this regard, the role of network coding scheme at the relay, choice of detection scheme at the receiver and augmented signal formed at the receiver have great importance.
Chapter 3
Link Performance of MARC This chapter is mainly targeted to evaluate the error performance of users in network coded cooperative relaying scenarios. Different factors influencing the evaluation are discussed in detail. Both analytical and simulation approach is used for this purpose. Outline of the chapter is as follows: Section 3.1 describes the system model used throughout the chapter. Section 3.2 illustrates different detection schemes used at the receiver. The performance and complexity of these schemes are discussed in section 3.3 and section 3.4 respectively. Section 3.5 describes how user grouping at the relay, affects the error performance of users. Finally section 3.6 provides the summary of results.
3.1 System Model Figure 3.1 illustrates the system model used in our analysis. The figure describes the general structure for transmitters at each node and the common receiver in an uplink scenario. Dashed lines refer to wireless transmission of data. The effects of channel fading (small scale) and noise are excluded from the figure for clarity, however they are part of the analysis. Since orthogonal frequency division multiplexing divides a broadband signal into low rate narrow band signals and uses time guard band to enable each subcarrier to experience flat fading instead of frequency selective fading, therefore we can safely model our channel as flat Rayleigh fading channel in the absence of strong line of sight (LOS) component. Moreover, fading coefficient is assumed to be constant during each symbol transmission. As the receiver structure depends upon detection scheme, hence it is shown separately for each detection method while discussing the detection schemes. In Figure 3.1, the receiver is shown as a black box. Different operations such as modulation, demodulation and network coding have been illustrated by MOD, DEMOD and NC blocks respectively in Figure 3.1. In some cases network decoding and demodulation in done in separate steps at the receiver, hence network decoding (ND) block at the receiver, is used to represent the corersponding operation. Transmission is performed in three time slots. In the first two time slots, each user transmits its own symbol/bit towards the base station. Relay also listen to these transmis21
22
CHAPTER 3. LINK PERFORMANCE OF MARC
Figure 3.1: Transmission Scheme for Network Coded Cooperative Relaying
sions. It decodes the received signals from users and combines these signals using bitwise XOR operation. In the third time slot, relay transmits the network coded symbol/bit towards the base station. In Figure 3.1 (m1 , m2 ) denotes the set of transmitted symbols/bits by users, while (m ˆ 1, m ˆ 2 ) is the set of detected symbols/bits at the destination. m3 represents the network coded symbol/bit transmitted by the relay. In order to simplify the model further, it is assumed that users are close to relay station. Hence the link between each user and relay station is assumed to be error free. This is rather an optimistic assumption, however it can be considered that the relay can decide by itself about the correctness of decoded data and refrain from transmitting the data to the base station in case of errors. Similar assumption is considered in [41, 42] as well. Now using Raleigh fading channel for each link, the received signal sample for link i at the base station can be written as follows
y i = h i si + z i ,
i = 1, 2, 3
(3.1)
where si is the transmitted symbol on link i with E{|si |2 } = Ei and yi is the received signal sample. E{.} denotes the expected or average value of {.} and Ei is the average energy per transmitted symbol at link i. The coefficient hi denotes the complex multiplicative channel gain as defined in (2.9). The channel gain hi is assumed to be constant during each symbol interval. The sample zi is the complex Gaussian noise experienced by link i during the symbol interval, at the base station with double sided power spectral density N0 /2. As network coding combines multiple packets and receiver makes the decision on the basis of all the received packets, hence signal reliability on the links is coupled together with each other. Thus an analytical frame work is quite helpful in predicting the error performance of cooperating nodes, for different SNR combinations on links. Since more than one link is involved in the detection, it provides us an opportunity to combine links in different ways.
3.2. PERFORMANCE OF DIFFERENT DETECTION SCHEMES
23
Figure 3.2: Receiver structure for Joint Detection Scheme
3.2 Performance of Different Detection Schemes This section looks at the performance of different detection methods for two user uplink scenario. These methods include joint detection, selection-and-soft combining and selection-and-hard combining. Closed form expressions for the bit error probability are derived for each detection scheme as well.
3.2.1 Joint Detection Joint detection based on the maximum likelihood (ML) criterion, is an optimal method used for detection. It takes into account all the three received signals simultaneously in order to make decision about the messages sent by both users as shown in Figure 3.2. For instance, assuming ideal channel state information (CSI) at the base station receiver, the receiver computes the metric using the received samples in (3.1), as follows C(m ˆ 1, m ˆ 2 ) = |y1 − h1 sˆ1 |2 + |y2 − h2 sˆ2 |2 + |y3 − h3 sˆ3 |2 .
(3.2)
where sˆi is the estimate of the symbol si . The receiver chooses the set of symbols that have minimum metric and declares them as transmitted symbols of user 1 & 2. Assuming uncorrelated links and for a given fading channel observation h = {h1 , h2 , h3 }, the conditional pairwise error probability can be written as s P3 Γ δ i i i=1 . P2 (s → sˆ |h ) = Q (3.3) 2 Here we define
δi =
|si − sˆi |2 |hi |2 Ei , and Γi = . Ei N0
For a normalized Rayleigh fading channel the probability density function (pdf) and cumulative density function (cdf) of the instantaneous received SNR Γi on link i can be written
CHAPTER 3. LINK PERFORMANCE OF MARC
24 as fi (γ) =
1 − γγ e i, γi
Fi (γ) = 1 − e
− γγ
i
γ ≥ 0, .
(3.4)
respectively, where γi = E{Γi } =
2σ 2 Ei N0
is the average received SNR on link i and σ 2 is the variance of real and imaginary part of the complex channel coefficient hi . The pairwise error probability can be obtained by averaging (3.3) over the fading pdfs in (3.4). It can happen that wrong detection at the receiver results into errors in all the three symbols, then the pairwise error probability can be written as follows q γ1 1 − γ1 +4/δ 1 �� � P2 (s → sˆ) = � γ2 δ2 γ3 δ3 2 γ1 δ1 − 1 γ1 δ1 − 1 q q γ2 γ3 1 − γ2 +4/δ 1 − γ3 +4/δ3 2 �� �+ � �� �. (3.5) + � 2 γγ12 δδ12 − 1 γγ23 δδ23 − 1 2 γγ13 δδ13 − 1 γγ23 δδ23 − 1
It is also possible that only two of the three symbols are wrongly detected. For instance, considering that the relay symbol is correctly detected then the pairwise error probability in (3.5) reduces to � � � � q q γ1 γ2 γ1 δ1 1 − γ1 +4/δ − γ δ 1 − 2 2 γ +4/δ 1 2 2 (3.6) P2 (s → sˆ) = 2 (γ1 δ1 − γ2 δ2 ) Similarly, if there is an error in symbols for the relay and user k, the expression for the pairwise error probability can be written as follows � � � � q q γk γ3 γk δk 1 − γk +4/δ − γ3 δ3 1 − γ3 +4/δ 3 k P2 (s → sˆ) = (3.7) 2 (γk δk − γ3 δ3 ) The pairwise error probability expressions from (3.5) to (3.7), represent general cases when there is error in two or more symbols. Considering the user symbols, sj and sk as two random variables, the pairwise error probability for symbol/user k can be calculated by averaging P2 (s → sˆ) over all possible values of other symbol/user j as follows 1 X (k) P2 (s → sˆ) = P2 (s → sˆ), for sk 6= sˆk (3.8) M sj ,ˆ sj
3.2. PERFORMANCE OF DIFFERENT DETECTION SCHEMES
25
Table 3.1: Truth table at receiver for BPSK Symbol Set S00 S01 S10 S11
User 1 0 0 1 1
User 2 0 1 0 1
Relay 0 1 1 0
where the summation over (sj , sˆj ) indicates that symbol j could be correctly or wrongly detected respectively. Also M represents the modulation level used. The average bit error probability for symbol k can be calculated by averaging the pairwise error probability over all the values of sk as follows (k)
Pb
≤
X (k) 1 P2 (s → sˆ) M log2 (M ) s
(3.9)
k
Combining the expressions in (3.8) and (3.9) we get (k)
Pb
≤
M2
X X 1 P2 (s → sˆ) log2 (M )
(3.10)
sk 6=sˆk sj ,ˆ sj
Example Considering binary phase shift keying (BPSK) at the nodes, a truth table shown in Table. 3.1, can be formed at the receiver to illustrate the error events in case of joint detection. It can be observed that, any detection error will result into wrong detection in two out of three symbols. For instance if S00 is transmitted and there is an error, it is received as either of the three possibilities i.e. S01 , S10 and S11 , then in each case two out of three received symbols are in error. In case of BPSK modulation, δi can be calculated using its definition in (3.3) as follows 2
δi =
|Ei − (−Ei )| = 4 Ei
(3.11)
Similar expressions can be calculated for any other modulation scheme. An upper bound on the average bit error probability for user k, using BPSK can be calculated by employing (3.10) as follows (k) Pb ≤ φk3 + φ12 (3.12) where φmn
√ γm √ γn γm (1− 1+γm )−γn (1− 1+γn ) , γm = 6 γn � 2(γm −γn ) � q = γ 1 1 1 m − 2 2 1 + 2(1+γm ) 1+γm , γm = γn
CHAPTER 3. LINK PERFORMANCE OF MARC
26
10
0
Case 1 (user 1, 2) Case 2 (user 1, 2) Simulation Results
Average Bit Error Probability
10
10
10
10
10
−1
−2
Direct Path
−3
−4
−5
0
5
10
15 20 γ1 , γ2 (in dB)
25
30
35
Figure 3.3: Tightness of bounds in case of joint detection. Average bit error probability of the users as a function of γ1 in Rayleigh fading channels. Case 1: γ1 = γ2 = γ3 , Case 2: γ3 = 20 dB, γ2 = γ1 .
It is observed from (3.12) that the performance of each user is affected by all the three links in the network coded cooperative relaying scenario. Using Chernoff bound to approximate Q function in (3.3), the upper bound on average bit error probability at high SNR can be calculated as 1 1 (k) Pb ≤ + (3.13) 2 (1 + γk ) (1 + γ3 ) 2 (1 + γ1 ) (1 + γ2 ) showing that a diversity gain of order 2 can be achieved which is consistent with the results in [30]. It is also observed that if one of the links fail (i.e. γi 7→ 0) the order of this diversity gain reduces to one. Now let us analyze the tightness of our analytical expressions by comparing it with the simulation results. Figure 3.3 illustrates the average bit error probability of the users over Rayleigh fading channels. Two different combinations of SNRs at the nodes, are considered as an example. For simplicity, the same average received SNR is assumed for both users in each case. This corresponds to the same average bit error probability for the users. It is also obvious from Figure 3.3 that the analytical upper bound calculated by using (3.12), fits with the simulation results quite well and a diversity gain of order two can be achieved. Therefore these expressions can be safely used to assess the performance of the joint detection scheme, eliminating the need for performing computer simulations.
3.2.2 Selection and Soft Combining The receiver structure for selection and soft combining (SSC) is illustrated in Figure 3.4. Here we have to classify users based on their instantaneous channel conditions. For in-
3.2. PERFORMANCE OF DIFFERENT DETECTION SCHEMES
27
Figure 3.4: Receiver structure for SSC Scheme, assuming U1 is the strongest user
stance, user having better SNR is termed as strong user, while the other is considered as weak user. In the first step, the strong user is detected using the direct link. In the second step, the weak user is detected using its direct link and the relay signal, based on the knowledge of the detected strong symbol. For instance, the receiver detects the strong symbol ss using the following metric C1 (m ˆ s ) = |ys − hs sˆs |
2
(3.14)
where ys =
(
y1 , y2 ,
if Γ1 > Γ2 if Γ2 ≥ Γ1 .
Here sˆs represents all the different possibilities for detected strong symbol. Therefore, based on the decision made by the receiver, the detected strong symbol is represented by s˜s . With the knowledge of s˜s , detected in (3.14), the weak symbol sw is detected based on minimizing the following metric C2 (m ˆ w ) = |yw − hw sˆw |2 + |y3 − h3 sˆ3 |2
= |yw − hw sˆw |2 + |y3 − h3 (˜ ss ⊕ sˆw )|2
(3.15)
where yw =
(
y1 , y2 ,
if Γ1 ≤ Γ2 if Γ2 < Γ1 .
We notice from the expressions of the two metrics, C1 (m ˆ s ) and C2 (m ˆ w ), that the strong user takes advantage of the good link quality while the weak user takes advantage of diversity obtained from relay and direct link. Since user k can be strong or weak user, hence denoting the error probability of the strong user by Pstrong and representing the error probability of the weak user by Pweak , the pairwise error probability of user k can be written as
CHAPTER 3. LINK PERFORMANCE OF MARC
28 follows: (k)
P2
(s → sˆ) = αk Pstrong + (1 − αk )Pweak ,
k = 1, 2
(3.16)
where α1 = Pr (Γ1 > Γ2 )
(3.17)
α2 = 1 − α1 = Pr (Γ2 ≥ Γ1 )
(3.18)
The conditional error event probability for the strong user can be written as follows: ! r Γmax δs (3.19) Pstrong {E |Γmax } = Q 2 where 2
Γmax = max {Γ1 , Γ2 } , and δs =
|ss − sˆs | . Es
In case of Rayleigh fading channels with uncorrelated channel coefficients, the pdf for Γmax , can be written as follows [54] fmax (γ) = f1 (γ)F2 (γ) + f2 (γ)F1 (γ),
(3.20)
where f1 (γ), f2 (γ), F1 (γ) and F2 (γ) are as defined in (3.4). The error event probability of the strong user can therefore be obtained by averaging the expression in (3.19) over the pdf in (3.20) and is written as s ! r r 1 γ1 γ2 γ1 γ2 δs2 P strong = 1− − + . 2 4/δs + γ1 4/δs + γ2 4γ1 δs + 4γ2 δs + γ1 γ2 δs2 (3.21) Using s˜s , the estimated symbol of the strong user, the conditional error event probability for the weak user can be written as � � 2
2
Γ3 Γmin δw + E3 |s3 − s˜s ⊕ sˆw | − |s3 − s˜s ⊕ sw | r � P weak {E |Γmin , Γ3 } = Q � 2 Γ3 2 Γmin δw + E |˜ s ⊕ s − s ˜ ⊕ s ˆ | s w s w 3
where 2
Γmin = min {Γ1 , Γ2 } , and δw =
|sw − sˆw | . Ew
(3.22)
3.2. PERFORMANCE OF DIFFERENT DETECTION SCHEMES
29
In above expression s3 = ss ⊕ sw , and sˆw is the estimate of the symbol sw . Assuming uncorrelated Rayleigh fading channels the pdf [54] for Γmin can be written as follows fmin(γ) = f1 (γ)(1 − F2 (γ)) + f2 (γ)(1 − F1 (γ)),
(3.23)
where f1 (γ), f2 (γ), F1 (γ) and F2 (γ) are as defined in (3.4). We notice from the expression in (3.22) that the error in the first stage(i.e. error in s˜s ) will deteriorate the error probability of the weak user. In fact we notice that the error propagation can make the argument of the Q-function negative, resulting in an error probability larger than 0.5 for the weak user. Averaging (3.22) over the corresponding probability density functions, the error event probability for the weak user can be written as follows ≤ 1, EP � � p � p γ3 γe (3.24) P weak = γe δw 1− −γ3 δ˜3 1− 4/δw +γe 4/δ˜3 +γ3 , No EP 2(γe δw −γ3 δ˜3 ) where
2
|s3 − s˜s ⊕ sˆw | γ1 γ2 δ˜3 = , and γe = . E3 γ1 + γ2 and EP stands for error propagation. Since Pweak depends upon the error propagation from strong symbol, hence the pairwise error probability of user k given in (3.16) can be modified using (3.24) as follows: (k)
P2
(s → sˆ) ≤ αk P strong + (1 − αk ) [(1 − P strong ) � � � � q q γe γ3 ˜ γ δ 1 − − γ δ 1 − 3 3 4/δw +γe 4/δ˜3 +γ3 e w + P strong . � × ˜ 2 γe δw − γ3 δ3
(3.25)
It means that Pweak in (3.16) is replaced by two terms, i.e. first indicating no error propagation and second taking care of error propagation from strong symbol. When user k is weak and there exist an error propagation from strong user, P weak is expected to be quite high and therefore it can be approximated as P weak ≈ 1 in error propagation term. This approximation makes (3.25) quite accurate especially at low average SNR values. However, at high SNR values P strong will have very small value and thus it cancels out the effect of P weak ≈ 1 in the error propagation term . This makes the expression of pairwise error probability in (3.25) accurate at high average SNR values. Since each user is detected separately (as opposed to joint detection) hence the average bit error probability of user k can be obtained from its pairwise error probability as (k)
Pb
≤
X X (k) 1 P2 (s → sˆ) M log2 (M ) s k
sk 6=sˆk
(3.26)
CHAPTER 3. LINK PERFORMANCE OF MARC
30
10
0
Case 1 (user 1, 2) Case 2 (user 1, 2) Simulation Results
Average Bit Error Probability
10
10
10
10
10
−1
−2
Direct Path
−3
−4
−5
0
5
10
15 20 γ1 , γ2 (in dB)
25
30
35
Figure 3.5: Tightness of bounds in case of selection and soft combining. Average bit error probability of the users as a function of γ1 in Rayleigh fading channels. Case 1: γ1 = γ2 = γ3 , Case 2: γ3 = 20 dB, γ2 = γ1 .
Example An upper bound on average bit error probability for user k derived in (3.26), can be obtained by averaging the pairwise error probability in (3.25) for all sk using BPSK and is given as � � γk γk ψ+ 1− [(1 − ψ) γ1 + γ2 γ1 + γ2 � � � � q q γe γ3 γe 1 − 1+γ − γ 1 − 3 1+γ3 e × + ψ 2 (γe − γ3 ) (k)
Pb
≤
(3.27)
where ψ=
1 2
� � r r r γ1 γ2 γ1 γ2 1− − + 1 + γ1 1 + γ2 γ1 + γ2 + γ1 γ2
(3.28)
Figure 3.5 shows the tightness of analytical upper bound calculated in (3.27), by comparing it with the simulation results for bit error probability of the users using selection and soft combining. A similar behavior to that of joint detection is observed, i.e. the analytical upper bound fits with the simulation results very well for this detection scheme.
3.2. PERFORMANCE OF DIFFERENT DETECTION SCHEMES
31
Figure 3.6: Receiver structure for SHC, assuming U1 is the strongest user
3.2.3 Selection and Hard Combining Receiver structure for selection and hard combining (SHC) is illustrated in Figure 3.6. In the first step, two links having the strongest SNR are detected directly. Then these hard values are used to detect the symbols of both users. For instance, the symbol for the first strongest link ss is detected based on the minimization of the following metric, 2
Cs (m ˆ s ) = |ys − hs sˆs |
(3.29)
where y , 1 ys = y2 , y3 ,
if Γ1 ≥ Γ2 ≥ Γ3 or Γ1 ≥ Γ3 ≥ Γ2 if Γ2 ≥ Γ1 ≥ Γ3 or Γ2 ≥ Γ3 ≥ Γ1 if Γ3 ≥ Γ1 ≥ Γ2 or Γ3 ≥ Γ2 ≥ Γ1
It is clear that the obtained symbol sˆs is an estimate of any of the symbols s1 , s2 , or s3 ≡ s1 ⊕ s2 depending on the status of the links. Now the symbol for the second strongest link sm is detected at the receiver using the following metric: 2
Cm (m ˆ m ) = |ym − hm sˆm |
(3.30)
where
ym
y , 1 = y2 , y3 ,
if Γ2 ≤ Γ1 ≤ Γ3 or Γ3 ≤ Γ1 ≤ Γ2 if Γ1 ≤ Γ2 ≤ Γ3 or Γ3 ≤ Γ2 ≤ Γ1 if Γ1 ≤ Γ3 ≤ Γ2 or Γ2 ≤ Γ3 ≤ Γ1
and again the detected symbol sˆm is an estimate of any of the symbols s1 , s2 or s3 . Using the two obtained symbols {ˆ ss , sˆm }, the user symbols {s1 , s2 }, can be obtained either directly if relay link is the weakest link or via network decoding (ND) if the relay link is the strongest or the second strongest. This implies that if both users have stronger links
CHAPTER 3. LINK PERFORMANCE OF MARC
32
than the relay link, the detected symbols for the users are considered correct in this case. Otherwise the weakest user symbol is decoded based on symbols detected for the stronger user and the relayed signal. Hence XOR based network decoding is performed using the signals of the strong user and the relay for obtaining the symbols of the weakest user. This detection scheme has lower complexity than the other two detection schemes as it always ignores the weakest link during the detection. Based on the above methodology, each link posses one of the three possible SNR states. The three states can be defined as strongest, middle and weakest, based on their instantaneous SNRs. Let us proceed now with the derivation of the error probability for the users in this case. Here we assume Pstrong , as the error probability when user k has strongest link, Pmid as the error probability when user k has second strongest or middle link and Pweak as the error probability when user k has weakest link. The pairwise error probability of user k can be written as follows: (k)
P2
(s → sˆ) = αk Pstrong + βk Pmid + (1 − αk − βk ) Pweak ,
(3.31)
where αk is the probability that user k is the strongest and βk is the probability that user k is the second strongest. For user 1 we have α1 = Pr {Γ1 > Γ2 > Γ3 } + Pr {Γ1 > Γ3 > Γ2 } =
γ12 γ2 (γ1 + γ3 ) + γ12 γ3 (γ1 + γ2 ) (γ1 γ2 + γ2 γ3 + γ3 γ1 ) (γ1 + γ2 ) (γ1 + γ3 )
(3.32) and β1 = Pr {Γ2 > Γ1 > Γ3 } + Pr {Γ3 > Γ1 > Γ2 } =
γ22 γ1 (γ1 + γ3 ) + γ32 γ1 (γ1 + γ2 ) . (γ1 γ2 + γ2 γ3 + γ3 γ1 ) (γ1 + γ2 ) (γ1 + γ3 ) (3.33)
A simple replacement of subscripts from 1 to 2 and vice versa in (3.32) and (3.33) will give α2 and β2 for user 2. Moreover, Pstrong can be obtained as follows ! r Z +∞ Γs δs Pstrong = Q fstrong (γ)dγ, (3.34) 2 0 where 2
Γs =
2
|hs | Es |ss − sˆs | , and δs = . N0 Es
Considering uncorrelated Rayleigh fading channels, the pdf for Γs [54] can be written as follows fstrong (γ) = f1 (γ)F2 (γ)F3 (γ) + f2 (γ)F1 (γ)F3 (γ) + f3 (γ)F1 (γ)F2 (γ),
γ≥0
(3.35)
3.2. PERFORMANCE OF DIFFERENT DETECTION SCHEMES
33
where f1 (γ), f2 (γ), f3 (γ), F1 (γ), F2 (γ) and F3 (γ) are as defined in (3.4). Similarly Pmid can be obtained as follows ! r Z +∞ Γm δm fmid (γ)dγ, (3.36) Pmid = Q 2 0 where 2
Γm =
2
|hm | Em |sm − sˆm | , and δm = . N0 Em
Considering uncorrelated Rayleigh fading channels, the pdf for Γm [54] can be written as follows fmid(γ) = f1 (γ)[F2 (γ) (1 − F3 (γ)) + F3 (γ) (1 − F2 (γ))] + f2 (γ)[F1 (γ) (1 − F3 (γ)) + F3 (γ) (1 − F1 (γ))] + f3 (γ)[F1 (γ) (1 − F2 (γ)) + F2 (γ) (1 − F1 (γ))],
γ ≥ 0.
(3.37)
Using the expressions in (3.35) and (3.37) in (3.34) and (3.36) respectively, and simplifying we get Pstrong =
1 2
1−
3 r X
k=1
γk + γk + 4/δs2
r
γ12 + γ12 + 4/δs2
r
γ13 γ13 + 4/δs2
� r γ23 γ123 + − , γ23 + 4/δs2 γ123 + 4/δs2 � r r 1 γ12 γ13 Pmid = 1− − 2 2 2 γ12 + 4/δm γ13 + 4/δm � r r γ23 γ123 − +2 , 2 2 γ23 + 4/δm γ123 + 4/δm r
(3.38)
(3.39)
where γik =
γi γk , γi + γk
γijk =
γi γj γk . γi γj + γi γk + γj γk
When the link is the weakest, an error will occur if and only if an error has occurred in the strongest or second strongest symbol. Hence, the error probability of the weakest link can be written as follows: 1 Pstrong × Pmid (M − 1) � � 1 = Pstrong + Pmid − 1 + Pstrong × Pmid (M − 1)
Pweak = 1 − (1 − Pstrong ) (1 − Pmid ) −
(3.40)
CHAPTER 3. LINK PERFORMANCE OF MARC
34
10
0
Case 1 (user 1, 2) Case 2 (user 1, 2) Simulation Results
Average Bit Error Probability
10
10
10
10
10
−1
−2
Direct Path
−3
−4
−5
0
5
10
15 20 γ1 , γ2 (in dB)
25
30
35
Figure 3.7: Tightness of bounds in case of selection and hard combining. Average bit error probability of the users as a function of γ1 in Rayleigh fading channels. Case 1: γ1 = γ2 = γ3 , Case 2: γ3 = 20 dB, γ2 = γ1 .
where the third term in the first line represents the case when both the strongest and the second strongest links are wrong but results into a correct decision after network decoding. With the expression of Pweak , the pairwise error probability can be rewritten as (k)
P2
(s → sˆ) = αk Pstrong + βk Pmid + (1 − αk − βk ) (Pstrong + Pmid � � � 1 − 1+ Pstrong × Pmid (M − 1) = (1 − βk ) Pstrong + (1 − αk ) Pmid � � 1 − (1 − αk − βk ) 1 + Pstrong × Pmid (M − 1)
(3.41)
Example Considering BPSK, an upper bound on average bit error probability for user k can be obtained by averaging the pairwise error probability in (3.41) for all sk using (3.26) as follows as follows: (k)
Pb
≤ (1 − βk ) ψ1 + (1 − αk ) ψ2 − 2 (1 − αk − βk ) ψ1 ψ2
(3.42)
3.3. PERFORMANCE COMPARISON
10
Average Bit Error Probability
10
10
10
10
10
10
35
0
JD SSC SHC
−1
−2
γ =10
−3
3
−4
γ3=20
−5
−6
0
5
10
15 γ1 = γ2 , (in dB)
20
25
30
Figure 3.8: Average bit error probability for JD, SSC and SHC as a function of γ1 where γ1 = γ2 , using γ3 = 10 dB and γ3 = 20 dB in case of BPSK
where 1 ψ1 = 2 −
r r r 3 r X γk γ12 γ13 γ23 1− + + + γk + 1 γ12 + 1 γ13 + 1 γ23 + 1 k=1
r
γ123 γ123 + 1
�
(3.43)
and ψ2 =
1 2
� � r r r r γ12 γ13 γ23 γ123 1− − − +2 . (3.44) γ12 + 1 γ13 + 1 γ23 + 1 γ123 + 1
Figure 3.7 illustrates the performance of this detection scheme for the two cases as considered earlier using analytical expression in (3.42) and the simulation approach. A behavior similar to other detection schemes is observed here as well i.e. the analytical upper bounds fits with the simulation results quite well and a diversity gain of order 2 is obtained.
3.3 Performance Comparison The analytical expressions derived in (3.12), (3.27) and (3.42) for each detection scheme respectively, are used to compare the performance of different detection schemes under different SNR conditions on the links as shown in Figure 3.8. Here BPSK is assumed at the nodes and the average bit error probability (BEP) of the users is plotted. The trend of the curves is similar for all detection schemes at different values of γ3 , with joint detection
CHAPTER 3. LINK PERFORMANCE OF MARC
36
10
0
JD SSC SHC Average Symbol Error Probability
10
10
10
10
10
−1
−2
−3
−4
−5
0
5
10 15 20 γ1 = γ2 , at (γ3 = 20 dB)
25
30
Figure 3.9: Average symbol error probability for JD, SSC and SHC as a function of γ1 where γ1 = γ2 , using γ3 = 20 dB in case of 8PSK
(JD) slightly outperforming (maximum 2 dB), the two low complexity schemes. This is due to the fact that joint detection exploits the redundancy provided by the relay in a better way and uses it for both users. However the other two schemes i.e. SSC and SHC utilizes the redundancy only for the weak user. Moreover, there is the phenomena of error propagation from strong to weak user in latter case, as wrong detection of strong user can influence the detection of the weak user. It can be observed that at high SNR values, especially those greater than relay SNR, the curves for the JD and SSC starts to come closer to each other and eventually coincides with each other. The reason is quite obvious, when the users have better SNR than relay link, the significance of relay signal for joint detection gradually reduces. Similarly for SSC, the error propagation phenomena from strong to weak user also starts to vanish at these SNR values. This makes the curve coincide with each other eventually. On the other hand, SHC does not use the information provided by the weakest link, hence slight degradation in its performance can be observed as compared to the other two schemes when the SNR of the both users is better than the relay SNR. Let us compare the performance of these detection methods using higher level modulation schemes. For instance, assuming that 8 PSK is used at the nodes, the curves for average symbol error probability using simulation approach are illustrated in Figure 3.9, under the same SNR conditions, as that of BPSK. It is interesting to note that by using 8 PSK the performance difference between the low complexity schemes and the joint detection is almost same as in case of BPSK. Given that the performance reduction for low complexity detection schemes remains in acceptable limits, these schemes become more useful for higher modulation levels, since the reduction in detection complexity becomes more prominent in case of higher level modulation schemes as illustrated in next section.
3.4. DETECTION COMPLEXITY
37
Table 3.2: Complexity comparison for the detection schemes Detection Schemes
Required Operations
8 PSK
16 QAM
64 QAM
JD
3 × 22k
192
768
12288
SSC
3 × 2k
24
48
192
SHC
2 × 2k
16
32
128
3.4 Detection Complexity Although joint detection is an optimal method for detection, the number of comparisons required at the receiver, when multilevel modulation schemes are employed grows exponentially, with the number of combined users/symbols in this case. This increases the detection complexity and consequently results in more power consumption at the receiver. Therefore, the detection schemes providing reduced complexity have great significance for the mobile devices as they have limited battery life. The complexity of different detection schemes can be compared in different ways. The most obvious method is to calculate the number of comparisons required at the receiver in each case. For instance, it can be easily verified that the number of comparisons required for joint detection increases by M 2 as compared to 2M in the case of SSC and SHC, where M = 2k is the modulation level and k is the number of bits per symbol. Therefore, it can be concluded that, for higher level modulation schemes, the detection complexity is reduced from exponential to linear by using low complexity detection schemes. Similarly, we can choose the "required number of operations" as our comparison criteria. Here, one operation represents calculation of one Euclidean distance. The number of operations required at the receiver for different detection schemes in a two user uplink scenario, employing higher level modulation schemes is illustrated in Table. 3.2. It can be observed that joint detection requires 3 × 22k operations while in case of SSC the number reduces to 3 × 2k . The number of operations can be further reduced to 2 × 2k by using SHC. Hence, given the small difference in performance between the different detection schemes, we can use any of the selection schemes instead of employing joint detection.
3.5 User Grouping The analytical expressions also help in providing some guidelines for grouping different users at the relay. In order to have fair comparison between different grouping options the total SNR i.e. γ1 + γ2 for the users has been kept constant. Then, the individual and average performance of the users for different pairing possibilities is analyzed. As an example lets us take the case, when γ1 + γ2 = 20 dB, and the relay SNR γ3 (1) is varied from 0 dB to 40 dB in order to observe the average error performance (Pb +
CHAPTER 3. LINK PERFORMANCE OF MARC
38
−1
b
b
Average Bit Error Probability, ( P (1) + P (2) ) / 2
10
−2
10
−3
10 20
10 0 γ1 , at (γ1 + γ2 = 20 dB)
40
30
20
10
0
γ3 , (in dB)
Figure 3.10: Selecting a suitable user pair at the relay on the basis of average bit error probability (BEP) of the users
(2)
Pb )/2 of both users. For illustration, joint detection is considered at the receiver in order to study different pairing options, as other detection schemes have similar trend with slightly differing absolute values. The expression in (3.12) is used to plot the curves in Figure 3.10, and it is obvious that if the relay link is weak, i.e. γ3 < γsum then its better to group users having nearly similar SNRs on their links, as the average error performance is best when users have same SNR. Similarly, for the large values of the relay SNR especially when γ3 ≥ γsum , it is preferable to group users having complementary SNR conditions on their links as illustrated in Figure 3.10. In order to have more insight into this behavior, let us look at the individual performance of the users in both regions i.e. γsum < γ3 and γsum ≥ γ3 separately as shown in Figure 3.11 and Figure 3.12, respectively. These figures are plotted using analytical expressions in (3.12), (3.27) and (3.42). The legends used i.e. JD(Ui ), SSC(Ui ) and SHC(Ui ) represents the error performance of user i for different detection schemes. As we kept γsum constant at each point hence the performance curves are symmetrical around the point γ1 = γ2 in both figures. Moreover, it can be observed from Figure 3.11 and Figure 3.12 that the user having better direct link SNR will have better error performance. It is worthwhile to mention here, that the error performance of any user is influenced by two factors, i.e. its own direct SNR with the base station and its estimate calculated by its partner by network decoding operation with the relay. The factor, which dominates will decide about the performance of the user. For instance, if the direct link SNR is increasing and its effect is prominent then average bit error probability for the user will reduce. However, if its partner’s SNR is decreasing and the effect of network decoding operation is dominant, the error probability of the user will increase even if its own direct SNR is increasing.
3.5. USER GROUPING
39
−1.7
Average Bit Error Probability
10
JD ( U1) JD ( U2 )
−1.8
10
SSC ( U ) 1
SSC ( U2 ) SHC ( U1 ) SHC ( U2 )
−1.9
10
0
1
2
3
4 5 6 7 γ1 at (γ1 + γ2 = 10) dB
8
9
10
Figure 3.11: Average BEP of individual users at γsum = 10 dB and γ3 = 20 dB
JD ( U1 ) Average Bit Error Probability
JD ( U2 ) 10
SSC ( U1 )
−2
SSC ( U2 ) SHC ( U1 ) SHC ( U2 )
10
−3
0
2
4
6
8 10 12 γ1 at γ1 + γ2 = 20 dB
14
16
18
20
Figure 3.12: Average BEP of individual users at γsum = 20 dB and γ3 = 10 dB
For instance, let us look at the performance of user 1 and user 2 in Figure 3.11, for a specific example considering, γsum = 10 dB and γ3 = 20 dB for different detection schemes. It is interesting to observe that there is a degradation in the error performance of user 1 with the increase in γ1 , until it attains its maximum value at γ1 = γ2 . Here γ3 is high, however γsum is low, hence the network decoding operation does not always result in a good estimate. In particular when both users have the same SNR i.e. at γ1 = γ2 = 5 dB, this would result in the worst network decoding operation as neither of the users have
40
CHAPTER 3. LINK PERFORMANCE OF MARC
a rather high SNR. Furthermore, the direct transmission of none of the users have good enough quality. On the other hand, when users are paired with complementary SNRs i.e. γ1 = 0 dB and γ2 = 10 dB or vice versa, the signal with the higher SNR will lead to a better quality of the network decoding operation. Therefore as γ1 increases the direct link transmission for user 1 starts to get better however the corresponding decrease in γ2 effects the network decoding and results into an overall degradation in performance of the weak user. The above is true regardless of the type of detection scheme used. Then we consider the case where γsum ≥ γ3 and specifically when γsum = 20 dB and γ3 = 10 dB. The average bit error performance for the individual users is shown in Figure 3.12. For this case, the BER curves behave similar to the conventional way, i.e. as the SNR of a certain user increases, its BER decreases and vice versa. By virtue of having a high γsum , sharing γ3 among the two users will still result in an acceptable network decoding operation and in a good direct transmission performance. As a result, the losses from a worse network decoding operation are accounted for by a better direct transmission in this case. It is worthwhile to observe that the performance of SSC and SHC for a particular user is the same at high SNR in both Figure 3.11 and Figure 3.12, due to the fact that the strong user is detected using direct link only, in both cases.
3.6 Summary The effect of different detection schemes and user pairing on the error performance of cooperating users, in network coded cooperative relaying scenarios have been analyzed in this chapter. Using analytical expressions for the error probability of the users, it has been shown that, by taking advantage of the channel conditions on the links it is possible to achieve good link performance with simple detection schemes. Moreover, the selection of users to be paired together, is independent of the detection scheme used. However, the user pairing strategy is significantly influenced by the SNR on the different links. It has been shown that for users in good conditions, pairing users with as similar channels as possible results in best average performance while simultaneously providing good performance for both users. On the other hand, if users with poor channel conditions towards the destination exist (which is a typical case when using the relays), then these users have to be paired with users having complementary (i.e. good) channel conditions towards the destination, in order to ensure a good quality of the network decoding operation, hence increasing the likelihood of correct reception for both users. Here we have looked at the individual as well as the average error performance of the users, for exploring different options for user grouping. Any change in the selection criteria will alter the user grouping options. We have studied the impact of different detection schemes and user grouping on link reliability of the users, however it can be observed that the relayed signal provides an extra dimension in the signal space at the receiver. Therefore, it is interesting to explore the multidimensional signal space formed at the receiver in order to improve the error performance of the users. The interaction between this augmented signal space and the detection scheme is also interesting to investigate.
Chapter 4
Constellation Selection This chapter is concerned with the link performance improvement of the multiple access relay channel in cellular system when network coding is employed at the relay node. The chapter looks at the possibility of selecting the appropriate constellation for each link of the MARC when linear multi-level modulation is employed by the cooperating users. A proper selection of the link constellations set, together with the redundancy introduced by network coding at the relay link, can provide considerable performance gain at the base station receiver. This performance gain is possible thanks to the augmented signal space formed by the links of the cooperative relaying scheme. This augmented signal space allows a better spread of the signal points of the high-level modulation scheme which can improve the link performance of the cooperating users in both additive white Gaussian noise (AWGN) channels and fading multi-path channels. Two different detection schemes are considered in this context: Joint detection where all the three links are considered simultaneously, and selection and soft combining.
4.1 System Model Let us reconsider the uplink scenario of a cellular/relay system as shown in Figure 2.4 where two mobile users are communicating with a base station and cooperating via a fixed relay. As illustrated in the previous chapters, orthogonal time division is assumed where the mobile users transmit their packets in the first two time slots. The relay node decodes the received user packets, combines them using network coding (XOR-based) and forwards the combined packets to the base station in the third time slot. The base station receiver now has three received packets. These received packets are used to decode the transmitted packets of the two mobile users. It is clear that there is a certain redundancy between the three received packets. This redundancy is due to the use of network coding at the relay node. Redundancy between separate branches can be very useful in improving the link performance especially when linear multi-level modulation is employed by the different branches. In fact, it has been shown in [45] that it is possible to take advantage of this redundancy 41
42
CHAPTER 4. CONSTELLATION SELECTION
Figure 4.1: Comparing MSED for two branch transmit diversity using 4-PAM, (a) Same constellations on both branches (b) Selected constellation on branch 2
and increase the minimum squared Euclidean distance (MSED) between the signal points of the used multi-level modulation scheme. This increase in the MSED is possible with a proper selection of the signal constellation sets used on each branch and viewing the received signals of the different branches as an augmented signal space. This augmented signal space increases the signal space dimension of the used modulation scheme and provides more room for the modulation signal points to spread. As an illustrative example we consider the case of four-level pulse amplitude modulation (4PAM) and a two-branch communication link with a correlation equals to one between the branches (i.e. the same symbol is transmitted over the two branches) as shown in Figure 4.1. Here, the augmented signal space is formed by the two branches and the modulation signal dimensions. Hence, the augmented signal space has dimension two in this case. It is observed from Figure 4.1.a, that the signal constellations of the modulation
4.2. JOINT DETECTION
43
schemes are unchanged in the augmented signal space when the signal constellations are the same in both branches. However, with a proper selection of the used signal constellations on each branch as shown in Figure 4.1.b, it is possible to increase the minimum squared Euclidean of the modulation scheme by 4 dB as compared to the case of same signal constellations. This performance improvement is obtained without increasing the complexity of the receiver [45]. Our objective in this chapter is to apply the idea of constellation selection to the multiple access relay channel with network coding. Since the base station receives signals from three different branches and that there is some correlation between the branches, we believe that constellation selection can improve the link performance of both cooperating users. However, since the correlation between the three branches is a bit weak one might guess that the performance improvement will not be as good as that illustrated in Figure 4.1. To this end, the two detection schemes described in Chapter 3, joint detection and successive cancelation with soft combining, are considered.
4.2 Joint Detection Let us reconsider the uplink of a cellular/relay system as illustrated by the MARC scheme shown in Figure 2.4 where linear multi-level modulation, such as multi-level phase shift keying (MPSK) or multi-level quadrature amplitude modulation (MQAM), is employed at the different transmitters. We assume that the base station receiver employs joint detection and we consider both AWGN channels and Rayleigh fading channels.
4.2.1 AWGN Channels For an ideal channel with AWGN interference only, the pairwise error probability can be obtained from (3.2) and is written as follows: s
P2 (s → sˆ) = Q
P2
k=1
2
2
|sk − sˆk | + |s3 − sˆ3 | 2N0
(4.1)
where s1 is the transmitted symbol of user 1, s2 is the transmitted symbol of user 2, and s3 = M(m1 ⊕ m2 ) is the network coded symbol transmitted by the relay node. M(.) is the modulation mapping operation. The pairwise error probability calculated in (4.1), can be used in (3.10) to obtain an upper bound on the average symbol error probability of user k as follows: Ps(k) ≤
1 X X P2 (s → sˆ), M2 sj sk 6=sˆk sj ,ˆ
k = 1, 2 and k 6= j
(4.2)
where M is the modulation level. It can be observed that the factor log2 (M ) in (3.10) is not used since we are calculating average symbol error probability. Considering both users
CHAPTER 4. CONSTELLATION SELECTION
44
together, the average symbol error probability of the MARC link can be written as Ps ≤
� 1 � (1) Ps + Ps(2) 2
(4.3)
It is observed that the average symbol error probability is a decreasing function of the squared Euclidean distance D2 (s, sˆ) =
3 X i=1
2
|si − sˆi | .
(4.4)
Hence, our objective is to select the appropriate signal constellations set to be used at each transmitter of the MARC scheme such that the pairwise error probability is minimized. In selecting the signal constellation set for each branch we employ computer search with the objective of maximizing the minimum squared Euclidean distance between the signal points in the augmented signal space. Here, the MARC has three different branches which gives a good spreading for the signal points of the two cooperating users within this augmented signal space. However, since the transmitted symbols of the cooperating users in the direct links are uncorrelated, the redundancy is only provided by the relay link which is pretty weak and the overall augmented signal space does not allow an increase in the MSED when joint detection is employed. Hence, computer search is performed in finding the signal constellations sets that minimize the number of signal points having the MSED between them. The computer search proceeds as follows: 1. Assume the same signal constellations in the three nodes. 2. Find the number of signal points, within the constellation set having the MSED between. 3. Change the signal constellations set randomly for the three nodes and identify the number of signal points within the set having the MSED between them. Select the signal constellations set that provide the minimum number of signal points having the MSED between them. 4. Repeat step 3 for the number of iterations. The signal constellations set obtained after the number of iterations is taken as the output of the search algorithm. Since search is performed off-line hence maximum number of iterations, does not act as a limiting factor for the search algorithm. However, all possible combinations of constellations at the different nodes is considered, for finding an optimum combination of constellations. 5. The signal constellations sets obtained in step 4 finalizes the selection procedure. Once found, these sets are fixed and can be used by the MARC scheme without modifications.
4.2. JOINT DETECTION
45
4.2.2 Rayleigh Fading Channels When the channel is a frequency non-selective Rayleigh fading channel and the three branches are uncorrelated, the conditional pairwise error probability of joint detection is as given in (3.3) and can be written as s
P2 (s → sˆ |Γi ) = Q
P3
2
ˆi | i=1 Γi |si − s 2Ei
(4.5)
The pairwise error probability is then obtained by averaging (4.5) over the pdfs of the fading amplitudes given in (3.4). The resulting expressions can be simplified to get an upper bound [55], as follows " # 1 1 1 1 P2 (s → sˆ) ≤ + × (4.6) 4 1 + xmin (1 + ψ1 ) (1 + ψ2 ) (1 + ψ3 ) (1 + xmin )2 where xmin = min
∀s6=sˆ
s
ψi , 1 + ψi
ψi = γi
|si − sˆi |2 |si − sˆi |2 = 4Ei 4N0
Also γi is defined in (3.4) earlier. Ei is the average energy per transmitted symbol on link i and is related to the average energy per bit as Eb = Ei / log2 (M ). It can be observed from expression in (4.6), that the pairwise error probability is inversely related to the product distance, which is further a function of three correlated branch distances where each symbols appears in two branch distances. Since the minimum distance is not affected by the selection of the signal constellation sets in AWGN, the product distance will not be affected by this selection as well. Therefore, in this case, it is important to reduce the number of signal points having MSED between them. The constellation sets obtained for the AWGN channel are also optimum for Rayleigh fading channels.
4.2.3 Numerical Results Computer simulations are performed using various MPSK and MQAM modulation schemes at the nodes. Let us take 8 PSK as an example. Equal average received SNR is assumed on all the links for better understanding. Conventionally, the same constellation (SC) is used at the nodes and illustrated as follows s1 , s2 , s3 : {100, 000, 001, 011, 010, 110, 111, 101} with the ith element (symbol) mapped to the phase iπ/4, i = 0, 1, ..., 7. It is worthwhile to mention here, that the Gray code mapping shown above is optimum, when same constellation is used at the nodes and when no interaction is considered between the constellations
CHAPTER 4. CONSTELLATION SELECTION
46
1200 Same Constellation Constellation Selection
Distance Distribution
1000
800
600
400
200
0
MSED
0
2
4 6 8 Squared Euclidean Distance (SED)
10
12
Figure 4.2: Comparison of SED Distribution in Augmented Signal Space, between Same Constellation (SC) and C1 using 8PSK
at different nodes. However, while performing constellation search, we look in multidimensional space formed by all the involved constellations and hence it is not necessary that the outcome of the search algorithm results into a constellation set that follow Gray code mapping. For instance, constellation search algorithm outputs a constellation set named as C1 in this case, that provides least number of pairs containing MSED between them. The searched constellation set C1 can be described as follows s1 :{010, 110, 101, 111, 100, 000, 011, 001} s2 :{110, 011, 001, 000, 101, 100, 010, 111} s3 :{001, 110, 101, 010, 111, 000, 011, 100} It is obvious that C1 does not follow Gray code mapping. The significance of C1 is illustrated in Figure 4.2, where the SED distribution of searched and conventional constellation sets is compared. It can be observed that signal points containing MSED are reduced by nearly 90% using C1. The comparison of SED distribution for individual users is also shown in Figure 4.3. Here we calculate the SED for only those pairs that represents error in that particular user. Therefore we can see the difference in the number of pairs as compared to Figure 4.2 for a particular SED. Since both users are using different constellations at their nodes, hence small difference in the pair reduction among both users is expected. However, this difference does not create significant difference in the error performance of individual users. The distance distribution of the pairs that do not contain MSED between them, is also changed by using C1. However these pairs have distance larger than the MSED and consequently have less impact on the error performance. Hence, an over all improvement in performance can be envisaged by using C1.
4.2. JOINT DETECTION
47
Table 4.1: Reduction in number of pairs containing MSED for different modulation schemes using joint detection Modulation Scheme
Constellation Sets
8 PSK 16 PSK 16 QAM
SC C1 SC C1 SC C1
Number of Pairs containing MSED Both Users User 1 User 2 288 192 192 32 16 24 1056 704 704 92 52 52 1920 1280 1280 280 180 192
The reduction in number of MSED pairs is numerically represented in Table. 4.1 for different modulation schemes. The table shows the reduction for individual users as well. Using the SED distribution in Table. 4.1 and Figure 4.3, one can write upper bounds given in (4.3) on the average symbol error rate (SER) of the users for SC in AWGN channel as follows. � 384 �p � 384 �p � 192 �p PsSC ≤ Q 1.76γ0 + Q 4.75γ0 + Q 6γ0 64 64 64 � �p � �p � �p ≤ 3Q 1.76γ0 + 6Q 4.75γ0 + 6Q 6γ0 (4.7) And similarly for C1 we have
� 56 �p � 224 �p � 20 �p 1.76γ0 + Q 2.62γ0 + 3.9γ0 Q Q 64 64 64 � � � � p p 200 256 + 4.75γ0 + 6γ0 Q Q 64 64 �p � �p � �p � ≤ 0.31Q 1.76γ0 + 0.88Q 2.62γ0 + 3.5Q 3.9γ0 �p � �p � + 4Q 4.75γ0 + 3.1Q 6γ0
PsC1 ≤
(4.8)
where γ0 = Eb /N0 . The terms inside Q function corresponds to particular SED while the coefficients represent the average number of pairs for the corresponding SED. Since we are calculating the average SER for both users, hence the number of pairs is the average of both users as well. The first term in each expression above corresponds to MSED. It can be observed that the coefficient of the first term in (4.7) has been reduced from 3 to 0.31 in (4.8). Hence, with a proper constellation selection for the different links, the number of branches having the MSED between them can be reduced considerably. Consequently, error performance of the users is expected to improve using C1. Figure 4.4 compares the average SER of both users using SC and C1. The analytical expressions in (4.7) and (4.8) are plotted besides the simulation results in Figure 4.4. It is obvious that significant gain can be achieved by
CHAPTER 4. CONSTELLATION SELECTION
48
1200 Same Constellation Constellation Selection
Distance Distribution
1000
800
600
400
200
0
0
2
4 6 8 Squared Euclidean Distance (SED)
10
12
10
12
(a) Comparison for User 1
1200 Same Constellation Constellation Selection
Distance Distribution
1000
800
600
400
200
0
0
2
4 6 8 Squared Euclidean Distance (SED)
(b) Comparison for User 2
Figure 4.3: Comparison of SED Distribution for individual users in Augmented Signal Space between Same Constellation case and using C1 by employing 8-PSK
using C1, especially at low and intermediate SNRs. For instance, a gain of about 2 dB is obtained for a SER equal to 10−2 . Similarly at SER equal to 10−5 , a gain of 1 dB is
4.2. JOINT DETECTION
10
Average Symbol Error Rate
10
10
10
10
10
49
0
Upper Bounds Direct Link Same Constellation Constellation Selection
−1
−2
−3
−4
−5
0
2
4
6 8 γ0 , (in dB)
10
12
14
Figure 4.4: Comparison of Average Symbol Error Rate (SER) for SC and C1 using 8-PSK over AWGN channel.
still achievable. Gain is reduced at high SNR, because the role of MSED pairs tends to dominate at good channel conditions. Similarly the upper bounds in (4.3) on average SER, in case of Rayleigh fading channels can be calculated using pairwise error probability in (4.6) and the SED distribution in Figure 4.3. Hence in case of SC we can write " Λ 192 384 SC Ps ≤ × 2 + 2 64 × 4 (1 + 0.44γ0) (1 + 1.5γ0 ) (1 + 0.44γ0 ) # 384 + 2 (1 + 1.5γ0 ) " 1.5 0.75 ≤Λ× 2 + (1 + 1.5γ ) (1 + 0.44γ ) 0 0 (1 + 0.44γ0 ) # 1.5 + (4.9) 2 (1 + 1.5γ0 ) where Λ=
�
1 1 + 1 + xmin (1 + xmin )2
�
and xmin =
r
0.44γ0 . 1 + 0.44γ0
Similarly in case of C1 the upper bounds on the average SER can be calculated using SED
CHAPTER 4. CONSTELLATION SELECTION
50
10
Average Symbol Error Rate
10
10
10
10
10
0
Upper Bounds Direct Link Same Constellation Constellation Selection
−1
−2
−3
−4
−5
0
5
10
15 γ0 , (in dB)
20
25
30
Figure 4.5: Comparison of Average SER for SC and C1 using 8-PSK over Rayleigh fading channels.
distribution as follows PsC1
" Λ 20 200 224 ≤ × 2 + 2 + (1 + 0.44γ ) (1 + 1.5γ ) 64 × 4 0 0 (1 + 0.44γ0 ) (1 + 1.5γ0 ) # 56 256 + 2 + 3 (1 + 1.5γ0 ) (1 + 0.44γ0 ) (1 + 0.44γ0 ) " 0.8 0.9 0.08 ≤Λ× 2 + 2 + (1 + 0.44γ ) (1 + 1.5γ ) 0 0 (1 + 0.44γ0 ) (1 + 1.5γ0 ) # 1 0.22 + (4.10) 2 + 3 (1 + 1.5γ0 ) (1 + 0.44γ0 ) (1 + 0.44γ0 )
where Λ is as defined in (4.9). It becomes obvious by comparing (4.9) and (4.10), that the coefficient of product distance terms containing MSED has been reduced from 0.75 to 0.08 by using C1. Figure 4.5 compares the average SER of both users in Rayleigh fading channels using SC and C1. The analytical expressions in (4.9) and (4.10) are plotted besides the simulation results in Figure 4.5. It can be observed, that a gain of nearly 2 dB can be obtained by using C1 as compared to SC at the nodes. Now let us look at the performance gains while considering higher modulation levels. For instance, using 16 PSK the conventional bit to symbol mapping using SC can be written
4.2. JOINT DETECTION
10
51
0
Direct Link Same Constellation Constellation Selection
Average Symbol Error Rate
10
10
10
10
10
−1
−2
−3
−4
−5
0
5
10
15 20 γ0 , (in dB)
25
30
35
Figure 4.6: Comparison of Average SER for SC and C1 using 16-PSK over Rayleigh fading channels.
as follows s 1 , s2 , s3 :
�
� 1000, 0000, 0001, 0011, 0010, 0110, 0111, 0101, 0100, 1100, 1101, 1111, 1110, 1010, 1011, 1001
with the ith element (symbol) mapped to the phase iπ/8, i = 0, 1, ..., 15. Search is performed for obtaining C1 and the resulting constellation set is as follows: � � 0001, 1111, 1001, 0100, 0111, 1110, 1010, 1100, 1101, 0011, s1 : 0101, 1011, 0000, 0010, 0110, 1000 � � 1101, 0111, 1011, 0000, 0110, 1100, 1000, 1001, 0001, 0011, s2 : 1110, 1111, 0010, 1010, 0101, 0100 � � 0001, 1011, 1100, 1010, 1110, 0111, 0011, 1000, 0010, 0110, s3 : . 0000, 0101, 1101, 0100, 1111, 1001 It can be observed from Table. 4.1 that the number of pairs containing MSED between them have been reduced quite considerably from 1056 to 92 using C1. Figure 4.6 compares the average SER using SC and C1 in Rayleigh fading channels using simulation approach. It can be observed that significant gain can be obtained using C1 at the nodes, in case of higher level modulation schemes. The proposed method of choosing constellations at the nodes has been proved to be useful for MPSK schemes. Let us analyze the usefulness of this method for the case of
CHAPTER 4. CONSTELLATION SELECTION
52
Figure 4.7: Constellations used at nodes for 16-QAM (a) SC at all nodes (b) C1 at User 1 node (c) C1 at User 2 node (d) C1 at Relay node
MQAM modulation schemes. For instance, 16 QAM can be considered as an example. The constellation set used for SC is illustrated in Figure 4.7.a. Searched constellation set C1 for 16 QAM, is illustrated in Figure 4.7.b-d for the three nodes respectively. Again significant reduction in the number of pairs containing MSED by using C1 can be observed by looking at Table. 4.1. Similar to 8 PSK, the upper bounds on the average SER can be obtained by using SED distribution in this case. Therefore the expressions for average SER in case of SC for Rayleigh fading channels can be obtained as follows:
PsSC
" # Λ 1280 3200 ≤ × 2 + 2 256 × 4 (1 + 0.4γ0 ) (1 + 0.8γ0 ) (1 + 0.4γ0 ) " # 1.3 3.1 ≤Λ× 2 + 2 (1 + 0.4γ0 ) (1 + 0.8γ0 ) (1 + 0.4γ0 )
(4.11)
4.2. JOINT DETECTION
10
Average Symbol Error Rate
10
10
10
10
10
53
0
Upper Bounds Direct Link Same Constellation Constellation Selection
−1
−2
−3
−4
−5
0
5
10
15
20 γ0 , (in dB)
25
30
35
40
Figure 4.8: Comparison of Average SER for SC and C1 using 16-QAM over Rayleigh fading channels.
where �
1 1 Λ= + 1 + xmin (1 + xmin )2
�
and xmin =
r
0.4γ0 . 1 + 0.4γ0
Similar expressions can be obtained for C1 using the corresponding SED distribution as follows
PsC1
" Λ 474 186 ≤ + × 2 256 × 4 (1 + 0.8γ0 ) (1 + 0.4γ0 ) (1 + 0.4γ0 ) 602
474
602
#
0.6
0.5
0.6
#
+ + (1 + 0.8γ0 )2 (1 + 0.4γ0 )3 (1 + 0.8γ0 ) (1 + 0.4γ0 )2 " 0.2 0.5 ≤Λ× + (1 + 0.8γ0 ) (1 + 0.4γ0 ) (1 + 0.4γ0 )2 +
+
(1 + 0.8γ0 )2
+
(1 + 0.4γ0 )3
+
(1 + 0.8γ0 ) (1 + 0.4γ0 )2
(4.12)
It can be seen that the coefficient of the product distance term containing MSED has been reduced from 1.3 to 0.2 using C1. The corresponding improvement in average SER of the users is illustrated in Figure 4.8. The analytical expressions in (4.11) and (4.12) are plotted
CHAPTER 4. CONSTELLATION SELECTION
54
besides the simulation results in Figure 4.8. A performance gain of around 2 dB can be achieved by employing C1 as compared to SC.
4.3 Selection and Soft Combining Since the relay signal is used to help the weak user only, while using this detection scheme, the multi-dimensional signal space is formed at the receiver using the relay and the weak signal only. Here constellation is searched for the relay node in order to maximize the MSED in augmented signal space formed by weak user and the relay. The computer search algorithm works in this case as follows: 1. Assume the same signal constellations in the three nodes. Strong user is detected directly so its constellation is not involved in search procedure. 2. Find the MSED in the signal space formed by the relay signal and the weak signal for any particular value of the strong symbol. 3. Change the signal constellation at the relay and identify the MSED for new the constellation set. Select the signal constellations sets that provide the maximum MSED. 4. Repeat step 3 for the number of iterations. The signal constellations set obtained after the number of iterations is taken as the output of the search algorithm. 5. The signal constellations sets obtained in step 4 finalizes the selection procedure. Once found, these sets are fixed and can be used by the MARC scheme without modifications. Once constellation sets are decided, bit to symbol mapping at relay varies depending upon the symbol, transmitted by strong user. This is done in order to keep the relationship between constellation of the weak user and the relay fixed, i.e. according to the selected constellation set. It is interesting to compare the performance of SSC with joint detection using the selected constellation set, since constellation search is rather simple in former case due to the involvement of two nodes only.
4.3.1 Rayleigh Fading Channels Considering the Rayleigh fading channels and assuming the same average SNR on the links, the conditional pairwise error probability for user k as given in (3.16) can be rewritten as follows: 1 (k) P2 (s → sˆ |Γi ) = (Pstrong {E |Γmax } + Pweak {E |Γmin , Γ3 } ) (4.13) 2 where s 2 Γmax |ss − sˆs | Pstrong {E |Γmax } = Q 2Es
4.3. SELECTION AND SOFT COMBINING
55
Table 4.2: Improvement in MSED by selecting proper constellation at the relay for different modulation schemes using SSC Modulation Scheme 8 PSK
Constellation Sets SC C1 SC C1
16 QAM
MSED 1.17 4 0.8 2
and s
Pweak {E |Γmin , Γ3 } = Q
2
2
Γ3 |s3 − sˆ3 | Γmin |sw − sˆw | + 2Ew 2E3
.
Since user k could be strong user or a weak user hence we use the subscript ’s’ and ’w’ to denote the both status on link k respectively. Moreover, Γmax = max{Γ1 , Γ2 } and Γmin = min{Γ1 , Γ2 }. The upper bound [55] on the pairwise error probability is then obtained by averaging (4.13) over the pdfs of Γ3 , Γmax and Γmin as given in (3.4), (3.20) and (3.23) respectively as follows: s s ! ! 1 1 ψs 1 ψs → sˆ) ≤ − + 4 2 1 + ψs 4 2 + ψs " # 1 1 1 1 + + 2 × (2 + ψ ) (1 + ψ ) 4 1 + xmin w 3 (1 + xmin )
(k) P2 (s
(4.14)
where xmin = min
(s
ψw , 2 + ψw
s
ψ3 1 + ψ3
)
and ψs , ψw and ψ3 are as defined in (4.6). It is obvious from (4.14), that the pairwise error probability has inverse relationship with the product distance. Having the pairwise error probability for all the possible candidate pairs, an averaging can be performed over all the symbols to get the average symbol error probability. The expression for average symbol error probability of user k, can be derived by modifying the (3.26) as follows Ps(k) ≤
1 X X (k) P2 (s → sˆ) M s k
sk 6=sˆk
(4.15)
CHAPTER 4. CONSTELLATION SELECTION
56
10
0
Upper Bounds Joint Detection Soft Combining
Average Symbol Error Rate
10
10
10
10
10
−1
−2
−3
−4
−5
0
5
10
15 20 γ0 , (in dB)
25
30
35
Figure 4.9: Performance of C1 using SSC as compared to Joint detection for 8-PSK over Rayleigh fading channels.
4.3.2 Numerical Results Taking 8 PSK as an example, the outcome C1 of the search process in this case is the following constellation set, s1 , s2 :{100, 000, 001, 011, 010, 110, 111, 101} s3 : {101, 010, 000, 111, 011, 100, 110, 001}. The MSED in the combined signal space has been increased from 1.17 to 4 using the selected constellation set as illustrated in Table. 4.2. The change is MSED effects the product distance terms in average SER expression as obvious from the definition of ψi in (4.6). For instance, using the constellation set C1 and the corresponding SED distribution, an upper bound on the average SER of both users can be obtained using (4.15) as follows: r 0.44γ0 0.44γ0 Ps ≤ 0.5 − + 0.5 1 + 0.44γ0 2 + 0.44γ0 � � 0.75 0.75 +Λ× + (2 + 0.44γ0 ) (1 + 2.55γ0 ) (1 + 0.44γ0 ) (2 + 2.55γ0 ) r
(4.16)
where �
1 1 Λ= + 1 + xmin (1 + xmin )2
�
and xmin =
r
0.44γ0 . 2 + 0.44γ0
However if we look at the expression for the average SER in case of using same constellation at all the nodes it comes out to be as follows
4.3. SELECTION AND SOFT COMBINING
57
Figure 4.10: C1 for 16-QAM (a). Mapping for User 1 and User 2 (b) Mapping for Relay node
r
r 0.44γ0 0.44γ0 Ps ≤ 0.5 − + 0.5 1 + 0.44γ0 2 + 0.44γ0 � � 0.5 +Λ× (2 + 0.44γ0 ) (1 + 0.44γ0)
(4.17)
where Λ and xmin are defined as in (4.16). It can be observed by comparing (4.16) and (4.17), that the coefficient in the denominator of product distance terms has been increased from 0.44 to 2.55 by using constellation selection. These coefficients can be calculated using (4.6) as follows 1.17 3Eb × = 0.44γ0 2 4N0 is for same constellation and � � 1.17 3Eb 4− × = 2.55γ0 2 4N0 is in case of constellation selection. Due to this change, product distance will be better in case of constellation selection and gain in performance can be predicted. Computer simulations are performed using the selected bit to symbol mapping, in order to compare its performance with joint detection using constellation selection, as described previously. The curves are plotted in Figure 4.9 using analytical expressions in (4.10) and (4.16), besides the simulation results. It can be observed, that the performance of SSC is quite close to joint detection at low SNR. At high SNR the difference is nearly 1 dB. Moreover, SSC also provides a diversity gain of order 2 similar to the joint detection scheme.
CHAPTER 4. CONSTELLATION SELECTION
58
10
0
Upper Bounds Joint Detection Soft Combining
Average Symbol Error Rate
10
10
10
10
10
−1
−2
−3
−4
−5
0
5
10
15 20 γ0 , (in dB)
25
30
35
Figure 4.11: Performance of C1 using SSC as compared to Joint detection for 16-QAM over Rayleigh fading channels.
The searched constellation set for 16 QAM is also shown in Figure 4.10. It is clear from Table. 4.2, that the MSED has been improved from 0.8 to 2 for the selected mapping. The corresponding change in coefficients of product distance term would be from 0.8 4Eb × = 0.4γ0 2 4N0 to � � 0.8 4Eb 2− × = 1.6γ0 2 4N0 according to (4.6). Therefore the expression for upper bound on the average SER of both users, in Rayleigh fading channels can be obtained as follows: r r 0.4γ0 0.4γ0 Ps ≤ 0.75 − 1.5 + 0.75 1 + 0.4γ0 2 + 0.4γ0 � � 1 1 +Λ× + (2 + 0.4γ0 ) (1 + 1.6γ0 ) (1 + 0.4γ0 ) (2 + 1.6γ0 ) where �
1 1 Λ= + 1 + xmin (1 + xmin )2
�
and xmin =
r
0.4γ0 . 2 + 0.4γ0
(4.18)
4.4. SUMMARY
59
Computer simulations are performed using C1 at the nodes. Results are compared with joint detection as shown in Figure 4.11. The analytical expressions in (4.12) and (4.18) are used to plot the curves besides the simulation results. A trend similar to that of 8 PSK can be observed in this case as well.
4.4 Summary Analytical and simulation approaches have been used to study the impact of selecting signal constellations set on signal reliability of the links in network coded cooperative relaying scenario. Selection criteria for two different detection schemes have been established. The selected signal constellations set have the capability to benefit the users in terms of average bit/symbol error probability, by exploiting the spread of the signal points of linear multilevel modulation in the augmented signal space formed by the branches of MARC and the dimension of the used modulation scheme. Moreover, both joint detection and SSC can be employed along with this signal constellation selection successfully at the nodes and provide comparable performance gain. The proposed method is valid for different linear modulation schemes and levels (large than two) under variety of fading channel conditions on the links. In short, signal constellation selection at the nodes of MARC is quite useful in improving the signal reliability for each user. Up till now we have studied the link performance of the cooperating users in MARC for different detection schemes and with XOR-based network coding at the relay node. The redundancy introduced by network coding has been considered in improving the link performance of the cooperating users through a proper selection of the signal constellation sets used at the different nodes of MARC. However, all these investigations have been done for un-coded systems and did not include the effects of channel coding used by the cooperating users. Channel coding is an integral part of all wireless communication systems of today. The following chapter looks at the link performance of MARC in the presence of channel coding. Interaction between channel coding and network coding is also addressed.
Chapter 5
Joint Channel-Network Coding for MARC This chapter considers the interaction between channel coding and network coding in the multiple access relay channel. For that, the chapter proposes a new representation of the received coded packets from the different nodes of MARC. This new representation provides us with a flexibility in designing efficient joint channel-network decoding algorithms and the possibility to use more powerful network coding schemes. By using more powerful network coding schemes, more than two users can cooperate via one relay node without sacrificing in performance or link efficiency. The link performance of the proposed scheme is analyzed and compared to that of separate channel network decoding. The chapter assumes linear block codes for the cooperating users but the proposed method may be extended to other channel coding schemes. The chapter starts with a description of the system model, followed by the interaction between channel coding and XOR-based network coding. This interaction is further considered for other types of network coding schemes.
5.1 System Model Let us generalize the transmission scheme described in Section 3.1, by assuming total of N users, single relay R, and a base station as shown in Figure 5.1. Hence transmissions are performed in N + r time slots. Each user performs the channel coding using an (n, k, d) linear block code with minimum Hamming distance d and code rate Rc = nk . In first N time slots, each user transmits its own channel coded packet towards the base station. The relay also listens to the transmission of each user. After receiving the packets from the users, relay performs channel decoding and re-encoding. Then it combine packets using the network coding scheme and forwards r network coded packets towards the base station. Additionally, it is assumed that users and relay have the same distance from the base station as considered in [41, 42], thus all the N + r links have same average signal to noise ratio (SNR) unless specified. This is rather pessimistic assumption as in practical cases, relay 61
62
CHAPTER 5. JOINT CHANNEL-NETWORK CODING FOR MARC
Figure 5.1: Uplink of a cellular/relay system with network coding for N users.
is normally closer to base station as compared to users and thus can provide better gain. Assuming flat fading Raleigh channel on each link, the ith signal sample of the received packet from link l at base station can be written as yil = hil sil + zil ,
l = 1, 2, · · · , N, N + 1, N + 2, · · · , N + r;
i = 0, 1, · · · , n − 1
(5.1)
where n is the packet length, sil is the transmitted symbol i, on link l with E{|sil |2 } = El Rc and yil is the corresponding received symbol. El is the average energy per transmitted symbol at link l. The coefficient hil denotes the complex multiplicative channel coefficient gain and remains constant during each symbol interval. The sample zil is the complex Gaussian noise experienced by link l during ith symbol interval at base station with double sided power spectral density N0 /2. The received packets from different users and relay station are then used by the base station to make a decision on transmitted information of different users. Link performance depends upon the network coding scheme used for combining these users.
5.2 Channel and XOR-based Network Coding Conventional network coding is based on bitwise XOR where, for the multiple access relay channel, the received packets from the two cooperating users are first decoded, re-encoded and then added bit-by-bit. The network coded packet is then of the same length as the
5.2. CHANNEL AND XOR-BASED NETWORK CODING
63
Table 5.1: XOR-based network coding and its possible codewords in MARC.
codeword 0 codeword 1 codeword 2 codeword 3
User 1
User 2
Relay Node
0 0 1 1
0 1 0 1
0 1 1 0
packets of the individual users. Hence, the base station receiver receives three different packets: The packet of user 1 , the packet of user 2, and the forwarded packet by the relay node. For the case of uncoded information signals, the overall link rate of MARC with two cooperating users is then given by R2 =
2 . 3
(5.2)
This reduction in link efficiency of MARC is due to the redundancy introduced by network coding at the relay node. In that, for every transmitted two bits (one bit for each user) the relay node transmits one. This operation clearly corresponds a (3, 2, 2) linear block as illustrated in Table. 5.1. We can easily see from Table. 5.1 that the minimum distance of this linear network (channel) coding operation is dmin = 2 and its rate is R2 = 2/3. In the case when channel coding is employed by the individual cooperating users then the MARC link becomes a concatenation of two coding schemes, the channel codes of the individual users and the network coding of the relay node. The overall rate of the MARC will then be reduced by the rate of the used channel. For instance, if the two cooperating are using the same linear block code (n, k, d) then the overall rate of MARC becomes Rt =
2k 2 k × = 3 n 3n
(5.3)
which is the product of the rates of the two coding schemes. Taking the three coded packets of MARC and placing them in rows as shown in Figure 5.2, we notice that the channel coding operation of the individual user codes is done along the rows of this formed channel matrix and the XOR-based network coding is done along the columns. Looking at the matrix of Figure 5.2, it is clear that the n × 3 matrix formed by the individual packets of the cooperating users and that of the relay station is a codeword matrix of a product code [56]. The obtained product code is an (n, k, d) × (3, 2, 2) = (3n, 2k, 2d) 2k block code with rate 3n . This coding structure can be used at the base station receiver to decode the information of the cooperating users. Seen as one single code, the correction capability of the corresponding decoder is now (2d − 1)/2 as compared to (d − 1)/2 for the case of separate channel-network decoding. In Rayleigh fading channels with uncorrelated links, it can be
CHAPTER 5. JOINT CHANNEL-NETWORK CODING FOR MARC
64 replacements
k n 2
m1 (packet of user 1) 3
m2 (packet of user 2) m1 ⊕ m2 (packet of relay)
Figure 5.2: Representation of conventional (XOR-type) network coding at the relay station.
shown that the diversity gain of order 2d/2 can be achieved if we look network and channel codes separately. It means that detection for both codes is done separately as illustrated in Figure 5.3, where after performing network decoding, channel code is decoded using hard decision decoding. However, by considering network and channel codes as a single product code (3n, 2k, 2d), we have the possibility to perform detection of both codes jointly, so that the redundancy present in the product code can be exploited efficiently. By using an optimum joint detection method at the receiver, a diversity order of 2d can be achieved. Here the receiver looks channel and network code as a single code and try to find the 3 × n matrix closest to the transmitted one. Therefore joint network and channel coding based on product code representation improves the error correcting capability and diversity gain as compared to separate network and channel decoding. Other decoding methods for decoding product codes as described in [57–62], can also be used for joint network and channel decoding. Clearly, the correction capability offered by channel and XOR-based network coding is limited by the performance of network coding scheme used. Moreover, it is cumbersome to combine more than two users at relay using conventional XOR based method, since with N cooperating users, N - 1 links need to be reliable so that help can can be provided to the weaker link. For the case of N cooperating users via one relay, the relay node transmits one packet (XOR-based network coding packet) for each set of N received packets. The network coding scheme can now be seen as a linear (N, N − 1, 2) block code. Hence, with the new representation, the overall coding scheme of MARC can be seen as an (n, k, d) × (N, N − 1, 2) = (n × N, k × (N − 1), 2d) product code with rate Rt =
k(N − 1) . nN
It is observed that the correction capability of the corresponding decoder is still (2d − 1)/2 which is independent of the number of cooperating users within MARC. To solve this limitation in the correction capability of the overall code we can increase the number of network coded packets at the relay station which is basically equivalent to increasing the redundancy of the network coded scheme. The problem now reduces to
5.3. CHANNEL-NETWORK CODING BASED ON PRODUCT CODES
65
yN yN +1
Network Decoding
y1
yN +r
Channel decoder
user 1
Channel decoder
user 2
Figure 5.3: Network decoding followed by channel decoding for conventional network coding in cooperative cellular/relay systems.
finding a good way of generating the network coded packets at the relay node. The linear combinations of the packets at the relay node should maximize the minimum Hamming distance of the network coded scheme.
5.3 Channel-Network Coding based on Product Codes We look, in this section, at the interaction between the user information signals (direct links) and forwarded signal(s) by the relay station to allow the base station to use a flexible and more powerful decoding algorithms when estimating the transmitted signals of the cooperating users with MARC. The interaction considered here is between the channel coding scheme of the cooperating users and the network coding used at the cooperating relay node. We have seen in Section 5.2 that joint channel-network coding in MARC can be seen as a product code. The codeword matrix of this product code, constitutes of rows formed by the individual channel codes of the cooperating users and columns formed by the network coding scheme used at the relay node. It has also been that the correction capability of the corresponding decoder when an XOR-based network coding is employed can be written as t=⌊
2d − 1 ⌋ 2
(5.4)
where d is the minimum Hamming distance of the block code used by the cooperating users for performing channel coding. One way to improve the correction capability of the formed channel-network coding scheme is to use a better network coding scheme. This option is now possible with the new representation introduced in the previous section. In fact, with this new representation, it is now possible to use any linear block code as a network coding scheme at the relay node. With this flexibility, it becomes now possible to tradeoff link performance for link efficiency and vise versa.
66
CHAPTER 5. JOINT CHANNEL-NETWORK CODING FOR MARC
Figure 5.4: Network coding scheme based on the principle of product codes in cellular/relay systems.
Let us reconsider the uplink of a cellular/relay network representing MARC and shown in Figure 5.1. Assume that we have a total of N users cooperating via one relay and that each cooperating user is using an (n, k, d) linear block code. Hence, with time-division multiple access between the users, the relay node receives a total of kr = N coded packets. The relay node then decodes the received packets, re-encode them using the same (n, k, d) user block code. With the re-encoded packets, the relay node forms a coding matrix structure of size n × kr , by placing the kr packets one on each other (one received packet per row). The relay node then applies a linear block code, denote it by (nr , kr , dr ), along the columns of the formed coding matrix. The obtained coding matrix will have a size of n × nr . Since the first kr rows (packets) of this formed matrix received by the base station receiver via the direct links of the cooperating users, the relay node does not need to forward them but instead it only needs to forward the remaining nr − kr rows (packets) of this formed matrix. These forwarded packets by the relay node are in-fact the redundancy produced by the network coding scheme. The base station receiver takes the packets received directly from the cooperating users and the packets received from the relay node to form a received version of the complete product code matrix. This received codeword can now be decoded using known decoding algorithm of product codes [57–62]. The formed product coding matrix at the relay station is illustrated in Figure 5.4. The obtained product code for the proposed scheme is an (n, k, d) × (nr , kr , dr ) = (nr n, kr k, dr d).
5.3. CHANNEL-NETWORK CODING BASED ON PRODUCT CODES
67
y1 user 1
Product yN yN + 1
Decoder user N
yN + r Figure 5.5: Joint channel-network decoding for product code representation.
having a coding rate Rs =
k kr × . n nr
It is observed that this formed coding scheme has a correction capability ⌊(dr d − 1)/2⌋ which is about dr times larger than the correction capability of the individual user codes. Hence, with a proper selection of the block code used at the relay station, one can improve the link performance of the cooperating users within MARC significantly in comparison with the case when conventional XOR-based network coding is employed without affecting the overall efficiency of the MARC scheme. This selection reduces to choosing a linear block code at the relay node having as parameters: dr > 2 kr 2 = . nr 3 This obtained coding structure presents channel and network coding in one single code. Hence, a single decoder as shown in Figure 5.5, for joint channel-network decoding can be used at the base station receiver. A single decoder can take advantage of the channel variations in the different branches of MARC and, as a result, better diversity gain can be obtained due to the involvement of the different radio links at the receiver. Besides optimum joint detection method, there are many other methods described in literature for decoding product codes. These methods are based on generalized minimum distance decoding, turbo decoding of concatenated codes and iterative decoding, as discussed in [57–62]. These detection methods have performance close to joint detection and offers less complexity. Therefore any of these methods can be used to detect product code formed by network and channel codes.
68
CHAPTER 5. JOINT CHANNEL-NETWORK CODING FOR MARC
It should be mentioned that the coding structure of Figure 5.4 allows the combination of kr different packets at the relay node. This structure is quite general and the only limitation here is that the number of packets to be combined at the relay station needs to be kr packets. These kr packets can belong to one user, two users, or kr different users. It is also possible to combine packets with different code rates or different versions of the same packet. The result of this is a very flexible structure that can be adapted to help the user(s), within the cooperating set of users, that need(s) help.
5.4 Analytical Performance The product coding based structure for channel-network coding shown in Figure 5.4, provides enough motivation to use better network coding scheme at the relay. The main objective of the analysis in this section is to show the significance of using better network coding schemes to combine the users at the relay as compared to conventional XOR based method. For fair comparison, let us consider simple detection scheme as illustrated in Figure 5.3 at the receiver in both cases. For performing network/column decoding soft decision decoding can be used for instance, followed by the hard decision decoding for channel/row codes. With soft decision decoding based on joint detection, the receiver computes the following metric using symbol i from each received packet l as C(m) ˆ =
nr X l=1
2
|yil − hil sˆil | ,
i = 0, 1, · · · , n − 1
(5.5)
for all possible codewords(set of symbols) in a network/column code. Since we are computing the matric C(m) ˆ for the column code, hence symbol i from each link l is used in the calculation. Moreover sˆil denotes the estimated symbol for the transmitted symbol sil . For detection, the receiver chooses the set of symbols that have the minimum metric and declare them as the network decoded symbols of link 1, 2, · · · , N . Assuming uncorrelated links and Rayleigh fading channels, with channel state information hi = {hi1 , · · · , hiN , hi(N +1) , · · · , hi(N +r) }, the conditional pairwise error probability for column code words can be written as r Pn
r
P2 (si → sˆi |hi ) = Q
l=1
Γil δil Rc 2
!
(5.6)
where si = {si1 , si2 , · · · , siN } denotes the transmitted column codeword and sˆi = 2 {ˆ si1 , sˆi2 , · · · , sˆiN } denotes the estimated column codeword. Moreover Γil = |hilN|0 El 2
sil | denotes instantaneous received SNR on link l and δil = |silE−ˆ . For the Rayleigh fading l Rc channel the probability density function of Γil can be written as
fi (γ) =
1 − γγ e il , γil
γ ≥ 0.
(5.7)
5.4. ANALYTICAL PERFORMANCE
69
where γil = E{Γil } =
2σ 2 El N0
is the average received SNR per symbol on link l and σ 2 is the variance of real and imaginary part of the complex channel coefficient hil . The exact value of pairwise error probability for column codewords can be calculated by averaging the expression in (5.6) over the pdfs of Γil in (5.7). The resulting expression will be the generalization of the expression in (3.5) for nr links in error as compared to only three links. This expression can be used in (3.10) for finding upper bound on the average bit error probability for column code. However, the generalized expression for pairwise error probability is tedious to calculate for higher values of nr or using long block codes. Hence, a rather simple method to compute upper bound on pairwise error probability is to use Chernoff bound in (5.6) and the resulting expression can be written as follows: n
r 1Y P2 (si → sˆi ) ≤ 2
l=1
1 1+
γil δil Rc 4
!
(5.8)
The above expression assumes that when receiver detects the code word si wrongly, all the nr symbols are in error. However, it is not necessary that wrong detection of transmitted codeword always results into an error in all the symbols. Taking BPSK as an example, the number of symbol/bit errors corresponds to hamming distance between both(transmitted and detected) codewords and it varies from dr to the maximum value nr . Denoting the hamming distance between the transmitted codeword si and the estimated one sˆi by w, we can write pairwise error probability as w
P2 (si → sˆi ) ≤
1Y 2 l=1
�
1 1 + γil Rc
�
,
dr ≤ w ≤ nr
(5.9)
Here δil is replaced by 4 as calculated in (3.11). An upper bound on code word error probability given in [10] can be calculated using the expressions for pairwise error probability above as
pcw ≤
r −1 2k X
q=1
P2 (si → sˆi )
kr
� 2 −1 wq � 1 X Y 1 ≤ 2 q=1 1 + γil Rc
(5.10)
l=1
where 2kr represents the total number of possible codewords using column block code and again wq is the corresponding hamming weight while selecting codeword q instead of
70
CHAPTER 5. JOINT CHANNEL-NETWORK CODING FOR MARC
transmitted one. Using the upper bound on codeword error probability above and assuming that γil = γ0 , an expression for raw bit error probability [10] can be written as pb ≤
aq pcw kr kr
�wq � 2 −1 1 X 1 ≤ aq 2kr q=1 1 + γ0 Rc
(5.11)
Here aq is the number of information bit errors associated with choosing the codeword q instead of the correct transmitted code word. Consider that there are ndr number of terms having hamming distance dr , then these terms can be separated from the rest of the terms as follows r −1 � �dr � �wq ndr 2k X 1 X 1 1 pb ≤ aq + aq 2kr q=1 1 + γ0 Rc 1 + γ R 0 c q=n
(5.12)
dr +1
For high SNRs, the upper bound in (5.12) can be approximated by the first summation, since at high SNR the terms having dr limits the error performance. Therefore the expression for pb can be written as � �dr ad r 1 pb ≈ . (5.13) 2kr 1 + γ0 Rc In the above expression adr corresponds to the total number of information bit errors in the terms having hamming distance dr . It is obvious that performance is limited by the minimum hamming distance dr . It can also be observed that the diversity gain of dr can be obtained at the high SNR. After performing column decoding, the detected symbols/bits are passed through hard decision channel/row decoder. The expression for bit error probability of column code calculated in (5.11) can be used to model the memoryless binary symmetric channel at the input of the row code decoder with transition probability pb . With this model, a good upper bound on average bit error probability Pb for any user/packet can be written as follows
Pb ≤
� � n X j+t n j n−j (pb ) (1 − pb ) , n j j=t+1
(5.14)
d−1 ⌋ 2
(5.15)
where t = ⌊
represents the correction capability of channel/row block code (n, k, d). The expression in (5.14) is a bit loose at low SNR values but quite good at high SNR values.
5.4. ANALYTICAL PERFORMANCE
71
Since we have derived the expression for bit error probability pb for network/column code in (5.11), it can also be used to calculate block/codeword error probability PM for any user/packet. Assuming that all zero codeword was transmitted, the probability P2 that a codeword with hamming weight wm is selected at the receiver can be computed by using Chernoff bound [48] as follows wm /2
P2 ≤ [4pb (1 − pb )]
(5.16)
The detection error occurs at the receiver if wm /2 or more bits will be in error. For the channel code (n, k, d) total number of possible wrong codewords will be 2k − 1. [48] has calculated a tighter upper bound by considering the union of all these decisions as follows
PM ≤
k 2X −1
m=1
wm /2
[4pb (1 − pb )]
≤ 2k − 1
��
4pb − 4p2b
� d/2 ≈ 2k − 1 [4pb (1 − pb )]
�d/2
(5.17)
Since pb is low at high SNR, the terms containing higher powers in (5.17) can be ignored safely and the expression for pb derived in (5.13) can be used to obtain upper bound on PM as follows
k
PM ≤ 2 − 1
�
�
2adr kr
�d/2
1 dr d/2
(1 + γ0 Rc )
.
(5.18)
Hence, when all the links have the same SNR, a diversity gain of order dr d/2 is obtained with this scheme. This diversity gain order is the product of the diversity gain order obtained from network coding and that obtained from channel coding. Therefore by using a better network coding scheme having dr greater than two, the error performance of the users can be improved as compared to conventional combining method based on XOR. Simple detection scheme have been used to highlight the performance gain achievable by proposed method(using powerful network coding) as compared to conventional method. However, by looking at channel-network codes together as a single product code an efficient iterative decoding method proposed by [62], can also be used at the receiver. The importance of this iterative method increases while using powerful block codes, where constituent network and channel codes are long and it becomes too complex to use soft decision decoding to decode these constituent codes. In this iterative decoding method, multiple iterations are required to achieve maximum performance improvement. During each iteration hard decision decoding is applied along the columns, followed by hard decision decoding along the rows of the product coding matrix. The output of the first iteration is considered as input for the next iteration. In addition to simple detection scheme discussed earlier, the iterative decoding method is also considered in next section for performing channel and network decoding jointly in case of proposed method.
CHAPTER 5. JOINT CHANNEL-NETWORK CODING FOR MARC
72
0
10
Separate Channel−Network Coding Joint Channel−Network Coding
Average Bit Error Probability
−1
10
−2
10
−3
10
−4
10
0
2
4
6 8 γ0 , (in dB)
10
12
14
Figure 5.6: Comparison of joint channel-network decoding with separate channel-network decoding, using XOR as network code and (7, 4, 3) as channel code. All the links have the same received SNR γ0 .
5.5 Numerical Results In this section we will focus on two things. First we will show that joint network and channel coding based on product code representation improves the error performance of users as compared to separate network and channel decoding. Then we will illustrate that by using a better network coding scheme at the relay, links can be made more reliable as compared to conventional XOR based method. Let us consider a simple example, where channel coding is performed at the nodes using (7, 4, 3) hamming code. The packets are combined at the relay using conventional XOR based method. If the receiver considers channel and network decoding separately as illustrated in 5.3, then the redundancy contained in network coded packets cannot be exploited efficiently at the receiver in order to correct the errors. However by looking channel and network codes jointly as a (21,8,6) product code, the correction capability at the receiver improves due to higher minimum hamming distance between the codewords of the product coding matrix. Joint channel-network detection can be performed for the obtained product coding matrix at the receiver. Figure 5.6 illustrates the performance improvement in average bit error probability of the users by using joint decoding as compared to separate decoding in Rayleigh fading channels. It can be observed that by using product code based representation, performance gain of nearly 4 dB can be obtained at a bit error rate equal to 10−4 .
5.5. NUMERICAL RESULTS
73
0
10
Average Bit Error Probability
Conventional Network Coding with (15,11,3) Proposed Scheme with ( 15,11,3 ) × ( 7,4,3 ) Simulation Results −1
10
−2
10
−3
10
−4
10
0
2
4
6 8 γ0 , (in dB)
10
12
14
Figure 5.7: Average bit error probability of the proposed network coding scheme with (15, 11, 3) × (7, 4, 3) in cellular/relay systems over Rayleigh fading channels when joint detection is employed for the column code and hard decision for the row code. All the links have the same received SNR γ0 .
After illustrating the significance of product code representation, let us look at the impact of using better network coding scheme at the relay as compared to XOR based combining. To ensure a fair comparison between the two schemes, we have kept the code rate of the system Rs = Rc kr /nr same in both cases. As same channel code is used in both cases, hence fairness depends upon the rate of linear block code used at the relay station in case of proposed scheme. In XOR based network coding scheme each pair of users require three transmitted packets, i.e. two direct packets and one relay packet. Therefore we tried to match the column code rate kr /nr in proposed scheme with 2/3. Consequently, two linear block codes with a code rate around 2/3, namely (7, 4, 3) and (31, 21, 5) are considered as column codes for proposed scheme. Different row block codes considered here for illustration purposes are (15, 11, 3) and (15, 5, 7). Figure 5.7 illustrates the average bit error probability, of the proposed scheme over Rayleigh fading channels when (15, 11, 3) × (7, 4, 3) product code is employed. Here (15, 11, 3) is employed as channel code in case of XOR based reference system. Simulation results are supported by the analytical upper bounds in Figure 5.7. Since (7, 4, 3) is a short block code , hence the generalization of analytical expression in (3.5) for nr = 7 links is used in (3.10) for obtaining an upper bound on average bit error probability of the column code for proposed method. Similarly in case of XOR based system the expressions in (3.5) and (3.10) are used for nr = 3 links in order to obtain the average bit error proba-
CHAPTER 5. JOINT CHANNEL-NETWORK CODING FOR MARC
74
0
10
Average Bit Error Probability
Conventional Network Coding with (15,11,3) Proposed Scheme with ( 15,11,3 ) × ( 7,4,3 ) −1
10
−2
10
−3
10
−4
10
0
2
4
6 8 γ0 , (in dB)
10
12
14
Figure 5.8: Average bit error probability of the proposed network coding scheme with (15, 11, 3) × (7, 4, 3) in cellular/relay systems over Rayleigh fading channels when the relay link is 10 dB better that user direct link. Joint detection is employed for the column code and hard decision for the row code.
bility for the network coding scheme. These expressions for average bit error probabilities of column/network coding schemes are then used in (5.14) to obtain the analytical upper bounds on average bit error probability of each user as plotted in Figure 5.7. It is observed from the said figure, that the proposed network coding scheme provides good performance gain as compared to the conventional XOR based network coding. Gain around 3 dB at a bit error rate of 10−4 can be obtained with this simple (7, 4, 3) linear block code. Note that with the proposed network coding scheme it is possible to combine up to four users without affecting the efficiency of the overall system. Figure 5.8 illustrates the average bit error probability using simulation approach, when the relay to base station link is 10 dB better than direct links of the users. It can be observed that the relative gain of the proposed network coding scheme in comparison with that of the XOR-based scheme has increased and the performance improvement is now around 4.5 dB for a bit error rate of 10−4 . This improvement is due to the fact that, with the new network coding scheme, the cooperative communication scheme takes better advantage of the relay channel and can provide better help in decoding the cooperating users. As we have seen from Figure 5.7, significant gain in bit error probability can be achieved, even by using short block codes for combining the users in case of proposed scheme. Hence, it will be interesting to see the impact of using more powerful and long block codes along the columns. However, more powerful codes along the columns cor-
5.5. NUMERICAL RESULTS
75
0
10
Average Bit Error Probability
Conventional Network Coding with (15,11,3) Proposed Scheme with (15,11,3) × (7,4,3) −1
10
−2
10
One iteration −3
10
Two iterations −4
10
0
2
4
6 8 γ0 , (in dB)
10
12
14
Figure 5.9: Average bit error probability of the proposed network coding scheme with (15, 11, 3)×(7, 4, 3) in cellular/relay systems over Rayleigh fading channels when iterative hard decision decoding is employed for both the row and column codes. All the links have the same received SNR γ0 .
respond to more number of combined packets. We know that the complexity of joint detection increases exponentially with the number of combined packets and hence becomes unacceptable in case of long powerful block codes. Better bit error probability along with a low detection complexity can be obtained by employing iterative decoding described in [62], where candidate lists for constituent row and column codes are obtained using hard decision decoding. Therefore with low complexity iterative decoding more powerful product codes can be used. Let us apply iterative hard decision decoding to short code (15, 11, 3) × (7, 4, 3) first as illustrated by Figure 5.9. The curves are plotted using simulation approach. It can be observed that by increasing the number of iterations the error performance can be improved up to nearly 2.5 db at a bit error rate of 10−4 . However, using more than two iterations does not improve the average bit error probability further in this case. Figure 5.10 illustrates an example using simulation approach, where a powerful block code is used to combine the users and the formed product code is (15, 11, 3) × (31, 21, 5). Due to better hamming distance significant improvement in signal reliability on the links is expected. It is observed that a performance gain of nearly 5 dB at a bit error rate of 10−4 can be obtained as compared to the XOR-based network coding scheme. This is 2.5 dB more as compared to the performance gain obtained with the short code of Figure 5.9. Hence, more powerful codes can provide better system performance without affecting the
CHAPTER 5. JOINT CHANNEL-NETWORK CODING FOR MARC
76
0
10
Average Bit Error Probability
Conventional Network Coding with (15,11,3) Proposed Scheme with (15,11,3) × (31,21,5) −1
10
−2
10
One iteration
−3
10
Two iterations Four iterations
−4
10
0
2
4
6 8 γ0 , (in dB)
10
12
14
Figure 5.10: Average bit error probability of the proposed network coding scheme with (15, 11, 3) × (31, 21, 5) in cellular/relay systems over Rayleigh fading channels for different number of decoding iterations at the receiver. All the links have the same received SNR γ0 .
system code rate Rs . Let us now fix the block code used along the columns and investigate the impact of changing the block code used along the rows. Figure 5.11 illustrates the average bit error probability of the proposed method based on product codes using simulation approach over Rayleigh fading channels and for different row block codes. By employing a more powerful code along the rows, the relative performance gain between the two schemes is slightly reduced. This is due to the fact that with strong block codes the direct links become more reliable and there is less need for help from the relay link. For instance, the gain obtained with (15, 5, 7)×(7, 4, 3) as compared to corresponding XOR curve is slightly less than 3 dB at a bit error rate of 10−4 , whereas gain obtained with (15, 11, 3) × (7, 4, 3) is more than 3 dB as compared to its XOR curve.
5.6 Summary Here we have represented the channel and the network codes in the form of product codes. This new structure allows us to perform the network and the channel decoding jointly by using a single decoder for the product codes. This decoder takes the advantage of channel variations on the combined links and therefore diversity gain of each link can be improved. Moreover, using powerful block codes along with the iterative decoding method, enhance
5.6. SUMMARY
Average Bit Error Probability
10
10
10
10
10
77
0
Conventional Network Coding with (15,11,3) Proposed Scheme with (15,11,3) × (7,4,3) Conventional Network Coding with (15,5,7) Proposed Scheme with (15,5,7) × (7,4,3)
−1
−2
−3
−4
0
2
4
6 8 γ0 , (in dB)
10
12
14
Figure 5.11: Average bit error probability of the proposed network coding scheme with (n, k, d) × (7, 4, 3) in cellular/relay systems over Rayleigh fading channels for different row block codes. Joint detection is employed for the column code and hard decision for the row code. All the links have the same received SNR γ0 .
the error correction capability of the channel-network coding scheme, along with acceptable detection complexity at the receiver. From the results, it can be observed even with the simple linear block codes, the proposed method outperforms the conventional XOR based network coding scheme, while keeping the system efficiency same in both cases. The proposed method also helps in combining the multiple users/packets at the single relay and improves the link performance of each combined user.
Chapter 6
Conclusions The concluding chapter highlights the important contributions discussed in the thesis and the possible directions of future work.
6.1 Concluding Remarks Recently cooperative communications has been considered as an effective solution for future wireless systems. The thesis mainly addresses the issue of signal reliability on the links for network coded cooperative relaying scenario. Different factors affecting the error performance of users are studied. Two techniques have been proposed to improve the link reliability for the cooperating users. The role of the detection schemes in determining the bit/symbol error rates of users, have been illustrated using the analytical approach. It has been concluded that by taking the advantage of channel conditions, it is possible to achieve good error performance with low detection complexity. For instance, it has been observed that the performance of low detection schemes is nearly 1 to 2 dB away from conventional joint detection scheme. These low complexity detection schemes become more attractive for higher modulation levels since, performance gap remains almost same as that in case of BPSK, however complexity reduction becomes more prominent. The detection complexity is reduced from M 2 to 2M where M is the modulation level. Therefore joint detection can be replaced by low complexity detection schemes for high level modulation schemes, as the latter offer significant complexity reduction as compared to the corresponding performance loss. Since the number of users are always more than the number of relays in a cellular network, hence each relay has the possibility to choose the cooperating partners in MARC. How these partners are selected has an impact on the link performance of the users. User grouping at the relay has been studied before, only in the context of improving the system capacity. However, here we looked at this problem in the context of improving the link reliability of the cooperating partners. It has been found that the pairing strategy is independent of detection scheme used, however, it depends upon the SNR on the individual links. It has been concluded that for the users having poor channel conditions towards the 79
80
CHAPTER 6. CONCLUSIONS
destination (i.e. relay has better SNR than the sum SNR of the pair), it is preferable to group users having complementary channel conditions. On the other hand if users have good channel conditions towards destination, it is shown that users having similar channel conditions should be grouped together. Besides looking at various detection methods and user grouping strategies, we have looked at different techniques to improve the error performance of the users in MARC. First method is based on the concept of constellation selection at the nodes. Extra dimension provided by the relay in network coded cooperative scenario is exploited, to search an optimal bit to symbol mapping for the nodes. The selected constellation set improves the error performance of users as compared to the case when same constellation is used at the nodes. The improvement is verified for different detection schemes. The proposed method provides gain for different modulation schemes without spending any extra resources. For instance, taking 8 PSK as an example, a gain of nearly 2 dB is achievable in Rayleigh fading channels, by using the searched constellation set as compared to the conventional case, where same constellation is used at all the nodes. Another novel approach is introduced to improve, the link performance of MARC in cellular systems, by looking at the interaction of network and channel coding schemes at the relay. It has been shown that the channel and network codes can be considered as a single product code and this representation allows us to perform joint channel-network decoding at the receiver, that recovers the performance loss due to separate network and channel coding. It has been concluded that by using this representation, significant gain in link performance can be achieved by using joint decoding as compared to the separate network and channel coding. For instance, in Rayleigh fading channels using XOR based network coding and channel code having minimum hamming distance dmin , the diversity order of 2dmin can be achieved by using joint channel-network coding as compared to dmin in case of conventional separate network and channel coding. The gain is comparable to other related works such as [41], that considers distributed turbo codes to implement joint network and channel coding. Since linear block codes are used as channel and network codes, hence the decoding complexity at the receiver is less(for short block codes) as compared to the method based on turbo codes in [41]. Another advantage of using product code representation is that, it provides us an opportunity to choose powerful network coding schemes based on linear block codes instead of using conventional XOR based combining. It has been observed that by keeping the system throughput same in both cases, significant gain(at least around 3 dB) can be achieved in link performance, even by using short linear block codes to combine the users. Besides improvement in error performance of users, the proposed method allows us to combine more than two users at the relay.
6.2. FUTURE DIRECTIONS
81
6.2 Future Directions There could be several possible directions for the future work. These can be summarized as follows. Motivated by other related works on MARC, we have considered relay-user link as an ideal link by assuming that, relay is located near to the user and it can refrain from transmitting the network coded packet if there are errors on relay-user link. However, it is interesting to look, how errors on the relay-user link impacts the gains achieved by various methods discussed in this monograph. Different factors such as detection method used at the receiver and user grouping strategy have been studied for un-coded packets. Use of channel coding on the links may alter the performance of detection schemes or it may impact the user grouping strategy. While introducing product code based representation of channel-network codes, it has been assumed that all the users have the same channel code and have same average received SNR on their links. In practice, users can have different received SNRs and may require different channel codes. It will be interesting to investigate code selection for cooperating users and the interaction between them. Moreover, in order to keep throughput efficiency same as that of XOR based combining, for fair comparison in case of product coding based method, we are limited to choose network/block codes having code rate 2/3. Therefore small number of options are available to fulfill this criteria. Higher level modulation can be used to transmit the redundant packets at relay in case of low rate codes. The loss in error performance by using higher level modulation scheme can be compensated by better error correction capability of the low rate code. This method provides us the opportunity to choose different combinations of low rate codes and modulation schemes, along with keeping throughput efficiency equal to 2/3. Product codes can also be formed by the combination of convolutional codes(along rows) and linear block codes(along columns). Therefore the interaction between channel coding scheme based on convolutional codes and network coding scheme based on linear block codes can be investigated for further gain in link performance. The study can also be extended towards non linear block codes. Improvement in link level performance has been considered for various proposed methods. It is important to look how much performance gain can be achieved by these methods at the network/system level under multi-user multi-relay scenarios. For instance, since multiple users can be combined at the relay by product coding based scheme, hence it would be useful to look how this approach impacts the quality of service of the users in the whole network as compared to the conventional XOR based approach that allows to combine only two users at the relay. Another area that is receiving much attention these days, is the concept of energy efficient cellular system. The role of network coding in cooperative relaying scenarios can be explored to save power consumption at the transmitter side. Noise limited and interference limited scenarios can be investigated. More specifically, area energy consumption of the cellular network can be analyzed for a target user spectral efficiency, considering different transmission scenarios in downlink.
Bibliography [1] Infonetics Research Inc., “Is 100 Gigabit Ready To Roll,” Avaiable at http://www. netevents.org/events/binaries/Portugal2008/Infonetics-NetEvents-Portugal-100Gigabit-Presentation-Sept-25-2008-FINAL.pdf, 2008. [2] G. Fettweis, “ICT Energy Consumption - Trends and Challenges,” in Proceedings of Wireless Personal Multimedia Communications, WPMC 2008. [3] Vodafone Chair Inc., “CoolCellular - Energy Efficient Network Architectures and Transmission Methods,” Avaiable at http://www.vodafonechair.com/research /projects cool cellular.html, 2007-09. [4] A. Hashimoto, H. Yoshino, and H. Atarashi, “Roadmap of IMT-Advanced Development,” IEEE microwave magazine, August 2008. [5] G. J. Foschini and M. J. Grans, “On Limits of Wireless Communications in Fading Environment when using Multiple Antennas,” Wireless Personal Communications, vol. 6, no. 3, pp. 311–335, Mar 1998. [6] I. E. Teletar, “Capacity of Multi-Antenna Gaussian Channels,” European Transctions on Telecommunications, vol. 10, no. 6, pp. 585–595, Nov 1999. [7] D. Gesbert, M. Shafi, D. Shiu, P. Smith, and A. Naguib, “From Theory to Practice: An Overview of MIMO Space Time Coded Wireless Systems,” IEEE Journal on Selected Areas in Communications, vol. 21, no. 3, pp. 281–302, Apr 2003. [8] M. Shafi, D. Gesbert, D. shan Shiu, P. Smith, and W. Tranter, “Guest editorial: MIMO systems and applications,” IEEE Journal on Selected Areas in Communications, vol. 21, pp. 277–280, Apr 2003. [9] H. Yanikomeroglu, “Cellular Multihop Communications: Infrastructure Based Relay Network Architecture for 4G Wireless Systems,” in Proceedings of the 22nd Queen’s Biennial Symposium on Communications (QBSC’04), 1-3 June 2004, Queen’s University, Kingston, Ontario, Canada. [10] L. Ahlin, J. Zander, and S. B. Slimane, Principles of Wireless Communications. Narayana Press Denmark, 2006. 83
84
BIBLIOGRAPHY
[11] R. Pabst, B. H. Walke, D. C. Schultz, P. Herhold, H. Yanikomeroglu, S. Mukherjee, H. Viswanathan, M. Lott, W. Zirwas, M. Dohler, H. Aghvami, D. D. Falconer, and G. P. Fettweis, “Relay Based Deployment Concepts for Wireless and Mobile Broadband Radio,” IEEE Communications Magazine, vol. 42, no. 9, pp. 80–89, Sept 2004. [12] B. Timus, “Cost Analysis Issues in a Wireless Multihop Architecture with Fixed Relays,” in Proceedings of the IEEE VTC 2005, vol. 5, May 2005, pp. 3178–3182. [13] E. C. V. der Meulen, “Three Terminal Communication Channels,” Advanced Applied Probability, vol. 3, pp. 120–154, 1971. [14] T. M. Cover and A. E. Gamal, “Capacity Theorems for the Relay Channel,” IEEE Transctions on Information Theory, vol. 25, no. 5, pp. 572–584, Sept 1979. [15] A. Sendonaris, E. Erkip, and B. Aazhang, “Increasing Uplink Capacity via User Cooperation Diversity,” in Proceedings of IEEE International Symposium on Information Theory (ISIT 1998), Cambridge, MA , USA, August 1998, p. 156. [16] ——, “User Cooperation Diversity Part I and Part II,” IEEE Transactions on Communications, vol. 51, no. 11, pp. 1927–48, Nov 2003. [17] J. N. Laneman and G. W. Wornell, “Energy Efficient Antenna Sharing and Relaying for Wireless Networks,” in Proceedings of IEEE Wireless Communications and Networking Conference, WCNC. 2000, pp. 7–12. [18] J. N. Laneman, D. Tse, and G. W. Wornell, “Cooperative Diversity in Wireless Networks: Efficient Protocols and Outage Behavior,” IEEE Transactions on Information Theory, vol. 50, no. 12, pp. 3062–3080, 2004. [19] B. Zhao and M. Valenti, “Distributed Turbo Coded Diversity for the Relay Channel,” Electronic Letters, 2003, vol. 39, pp. 786–787, 2003. [20] Y. Cao and B. Vojcic, “Cooperative Coding using Serial Concatenated Convolutional Codes,” in Proceedings of IEEE Wireless Communications and Networking Conference (WCNC), March 2005. [21] A. Chakrabarti, A. de Baynast, A. Sabharwal, and B. Aazhang, “LDPC Code Design for Half-Duplex Decode and Forward Relaying,” in Proceedings of 43rd Allerton Conf. on Communication, Control, and Computing, Sept. 2005. [22] A. Nosratinia, T. E. Hunter, and A. Hedayat, “Cooperative Communication in Wireless Networks,” IEEE Communications Magazine, vol. 42, no. 10, pp. 74–80, Oct 2004. [23] T. E. Hunter and A. Nosratinia, “Cooperative Diversity through Coding,” in Proceedings of IEEE ISIT 2000, Laussane, Switzerland, July 2002, p. 220. [24] ——, “Diversity through Coded Cooperation,” IEEE Transactions on Wireless Communications, vol. 5, no. 2, pp. 283–289, Feb 2006.
BIBLIOGRAPHY
85
[25] J. N. Laneman and G. W. Wornell, “Distributed Space-Time-Coded protocols for exploiting cooperative diversity in wireless networks,” IEEE Transactions on Information Theory, vol. 49, no. 10, pp. 2415–2425, 2003. [26] M. Janani, A. Hedayat, T. E. Hunter, and A. Nosratinia, “Coded Cooperation in Wireless Communications: Space Time Transmission and Iterative Decoding,” IEEE Transaction on Signal Processing, 2004, vol. 52, no. 2, pp. 362–371, Feb 2004. [27] R. Ahlswede, N. Cai, S. Li, and R. W. Yeung, “Network Information Flow,” IEEE Transactions on Information Theory, vol. 46, no. 4, pp. 1204–1216, July 2000. [28] X. Bao and J. Li, “Matching Code-on-Graph with Network-on-Graph: Adaptive Network Coding for Wireless Relay Networks,” in Proceedings of 43rd Allerton Conference on Communication, Control, and Computing, September 2005. [29] ——, “On the Outage Properties of Adaptive Network Coded Cooperation in Large Wireless Networks,” in Proceedings of International Conference on Accoustic, Speech and Signal Processing (ICASSP), March 2006. [30] Y. Chen, S. Kishore, and J. Li, “Wireless Diversity through Network Coding,” in Proceedings of IEEE Wireless Communications and Networking Conference, 2006., pp. 1681–1686. [31] H. K. Dereje H. Woldegebreal, “Multiple Access Relay Channel with Network Coding and Non-Ideal Source-Relay Channels,” in Proceedings of 4th International Symposium on Wireless Communication Systems, October 2007. [32] S. Yang and R. Koetter, “Network Coding over a Noisy Relay : A Belief Propagation Approach ,” in Proceedings of IEEE International Symposium on Information Theory, Nice,France, June 24-29 2007. [33] J. Manssour, A. Osseiran, and S. B. Slimane, “Network Coding in OFDM Networks: Strategies and Performance,” in Proceedings of IEEE WiMob 2008, Aavignon, France, Oct. 2008. [34] Y. Wu, P. A. Chou, and S. Y. Kung, “Information Exchange in Wireless Networks with Network Coding and Physical Layer Broadcast,” in Proceedings of 5th Scandinavian Workshop on Adhoc Networks (ADHOC’05), Stockholm Sweden, May 2005. [35] S. Katti, D. Katabi, W. Hu, H. S. Rahul, and M. Médard, “The Importance of being Opportunistic: Practical Network Coding for Wireless Environments,” in Proceedings of 43rd Annual Allerton Conference on Communication, Control, and Computing, Monticello, IL, Sept. 2005. [36] P. Larsson, N. Johansson, and K. Sunell, “Coded Bi-Directional Relaying,” in Proceedings of IEEE 63rd Vehicular Technology Conference (VTC ’06) Melbourne, Australia, May 2006, pp. 851–855.
86
BIBLIOGRAPHY
[37] P. Popovski and H. Yomo, “Bi-Directional Amplification of Throughput in a Wireless MultiHop Network ,” in Proceedings of IEEE 63rd Vehicular Technology Conference, 2006. VTC 2006-Spring, May 2006, pp. 588–593. [38] eMobility Report, “White Papers produced during SRA Revision Period 1,” 2008. [39] J. Kliewer, T. Dikaliotis, and T. Ho, “On the Performance of Joint and Separate Channel and Network Coding in Wireless Fading Networks,” in Proceedings of IEEE Information Theory Workshop on Information Theory for Wireless Networks, Solstrand, July 2007. [40] X. Bao and J. Li, “A Unified Channel-Network Coding Treatment for User Cooperation in Wireless AdHoc Networks,” in Proceedings of IEEE International Symposium on Information Theory (ISIT), Seattle, WA, USA, July 2006. [41] C. Hausl and P. Dupraz, “Joint Network-Channel Coding for the Multiple-Access Relay Channel,” in Proceedings of 3rd Annual IEEE Communication society on Sensor and Ad Hoc Communication Networks (SECON 2006). [42] C. Hausl, F. Schreckenbach, I. Oikonomidis, and G. Bauch, “Iterative Network and Channel Decoding on a Tanner Graph,” in Proceedings of 43rd Allerton Conf. on Communication, Control, and Computing, Sept. 2005. [43] C. Hausl and J. Hagenauer, “Iterative Network and Channel Decoding for the TwoWay Relay Channel,” in Proceedings of IEEE International Conference on Communications (ICC), June 2006. [44] Z. Guo, J. Huang, B. Wang, J.-H. Cui, S. Zhou, and P. Willett, “A Practical Joint Network-Channel Coding Scheme for Reliable Communication in Wireless Networks,” in Proceedings of the Tenth ACM international symposium on Mobile Adhoc Networking and Computing, New Orleans, LA, USA 2009., pp. 279–288. [45] S. B. Slimane, “Combined Transmitter Diversity and Multi-Level Modulation Techniques,” Wireless Personal Communications, vol. 39, no. 2, pp. 215–227, Oct 2006. [46] Z. H. Awan and S. B. Slimane, “Improved Beamforming for Radio Links with MultiLevel Linearly Modulated Signals,” in Proceedings of IEEE Wireless Communication and Networking Conference (WCNC 2009), Hungary, April 2009. [47] B. Sklar, Digital Communications Fundamentals and Applications. PTR Second Edition, 2002.
Prentice Hall
[48] J. G. Proakis, Digital Communications. McGraw-Hill International Edition, 2001. [49] J. Zhao and A. Wittneben, “Cellular Relaying Networks: State of the Art and Open Issues,” in Proceedings of 2nd COST 289 Workshop, Kemer, Antalya, Turkey, July 2005.
BIBLIOGRAPHY
87
[50] H. Wu, C. Qiao, S. De, and O. Tonguz, “Integrated Cellular and AdHoc Relaying Systems: iCAR ,” IEEE Journal on Selected Areas in Communications, vol. 19, no. 10, pp. 2105–15, Oct 2001. [51] L. Le and E. Hossain, “Multihop Cellular Networks: Potential Gains, Research Challenges, and a Resource Allocation Framework,” IEEE Communications Magazine, vol. 5, no. 9, pp. 66–73, Sep 2007. [52] P. Popovski and H. Yomo, “The Anti-Packets Can Increase the Achievable Throughput of a Wireless Multi-Hop Network ,” in Proceedings of IEEE International Conference on Communications, ICC June 2006, pp. 588–593. [53] S. Zhang, S. C. Liew, and P. P. Lam., “Hot Topic: Physical Layer Network Coding ,” in Proceedings of ACM Mobicom, 2006. [54] A. Papoulis, Probability, Random Variables and Stochastic Process. McGraw-hill, 1984.
2nd Edition,
[55] S. B. Slimane and T. Le-Ngoc, “Tight Bounds on the Error Probability of Coded Modulation Schemes in Rayleigh Fading Channels,” IEEE Transactions on Vehicular Technology, vol. 44, no. 1, pp. 121–130, Feb 1995. [56] P. Elias, “Error Free Coding,” IEEE Transactions on Information Theory, vol. 4, pp. 29–37, 1954. [57] G. D. Forney, “Generalized Minimum Distance Decoding,” IEEE Transactions on Information Theory, IT-12, 1966. [58] J. Hagenauer, E. Offer, and L. Papke, “Iterative Decoding of Binary Block and Convolutional Codes,” IEEE Transactions on Information Theory, vol. 42, no. 2, Mar 1996. [59] R. M. Pyndiah, “Near Optimum Decoding of Product Codes: Block Turbo codes,” IEEE Transactions on Communications, vol. 46, no. 8, pp. 1003–1010, Aug 1998. [60] A. R. Calderbank, “ Multilevel Codes and Multistage Decoding,” IEEE Transactions on Information Theory, vol. 37, no. 3, pp. 222–229, Mar 1989. [61] L. R. Bahl, J. Cocke, F. Jelinek, and J. Raviv, “Optimal Decoding of Linear Codes for Minimizing Symbol Error Rate,” IEEE Transactions on Information Theory, IT-20, March 1996. [62] O. Al-Askary, Coding and Iterative Decoding of Concatenated Multi-Level Codes for the Rayleigh Fading Channel. PhD Thesis Royal Institute of Technology (KTH) Stockholm Sweden, 2006.