R. Rodman, D. McAllister, D. Bitzer, H. Fu, B. Xu. Voice I/O Group - Multimedia Lab. Dept. of Computer Science, North Carolina State University. Raleigh, NC ...
A Pitch Tracker for Identifying Voiced Consonants R. Rodman, D. McAllister, D. Bitzer, H. Fu, B. Xu Voice I/O Group - Multimedia Lab Dept. of Computer Science, North Carolina State University Raleigh, NC 27695-8206 We report on one aspect of our research into text-free, speech recognition-free lip synchronization (lip-sync). By lip-sync we mean inputting freely spoken speech and outputting parameters for animating a mouth, which can then be synchronized with the input speech. We first describe a “pitch tracker” that we find helps to expedite the identification of voiced consonants. Our approach to lip-sync is to subdivide the speech signal into specific classes of sounds, and then apply specialized lip-synch algorithms to determine the mouth shapes (visemes) corresponding to the individual members. One such class is the voiced fricatives. They are the medial consonants of over, bozo, seizure, and other, designated as /v/, /z/, /zh/ and /dh/. This paper describes a method for identifying voiced fricatives in the speech signal when they occur between vowel sounds. The technique is currently being extended to handle fricatives that occur in other contexts. The method is based in part on a sudden shift in the measurement of the fundamental frequency F0 of the speech signal at the start and end of the voiced fricative. F0 is determined by the rate at which the vocal cords vibrate or indirectly by the glottal pulse (GP) — the period of a single vibration. Its actual measurement is affected by rapid phase changes induced by the motion of the articulators — acting, in effect, as a time-changing filter — so that the F0 we measure does not always correspond to the actual rate of vibration of the vocal cords.
We have developed an algorithm for measuring F0 based on the fact that the amplitudes of the odd harmonics of a periodic function with period P are zero when the function is expanded in a Fourier series whose coefficients are determined by integrating over 2P instead of the usual P. That is, if f is integrable and periodic with period P, and t0 is an arbitrary point in time, then the following hold. t 0+ 2 P
∫
sin(nπt/P) f(t)dt = 0
and
t0 t 0+ 2 P
∫
cos(nπt/P) f(t)dt = 0,
n=1,3, . .
t0
These equations hold for an ideal periodic function. Voiced speech is quasi-periodic. To find F0 in voiced speech we vary the integration length L until the sum of the odd harmonics is minimized, say at Lmin. Then Lmin/2 is the desired quasi-period, and F0=2/Lmin. In practice the speech signal is digitized. We compute the odd harmonics from the discrete Fourier transform (DFT) of the signal. The following algorithm determines the GP, hence F0, in voiced utterances. Let s1, s2, s3 . . be some arbitrary starting point in the stream of digitized samples of the voiced speech S. We create a window of samples [i, j] selected such that i ≤ “2GP’s worth of samples” ≤ j for estimated values of the current GP. We then compute the absolute values of the DFTs over the intervals [s1, si], [s1, si+1], [s1, si+2] . . [s1, sj-1], [s1, sj], producing |DFTi| . . |DFTj|.
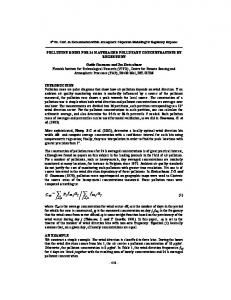
Let the sum of the first four odd harmonics of |DFTk| be Hk. (The “four” is somewhat arbitrary but has proven effective.) We seek the point m where Hm = min[Hk, i ≤ k≤ j]. The value of m is the number of samples in an estimate of 2GP. We then move forward m/2 samples (one GP’s worth) in the signal and search for the next minimum. This produces a sequence of GP estimates, . To locate 2GPn when the sampling rate is 22050 Hz, we use the window [2GPn-1 - 50, 2GPn-1 + 50] for the values [i, j] as described above. The values for F0 derived from the GP estimates have proven to be very accurate as corroborated by other estimates. Moreover, the method is sensitive to sudden changes in apparent frequency that may accompany transitions between vowels and consonants. These frequency shifts can be used to identify consonant classes in the speech signal, in particular, the class of nasal sounds, the lateral liquid /l/, and voiced fricatives. To illustrate our method we look at the “word” /amanalavazazhadha/; that is, the consonants /m/, /n/, /l/, /v/, /z/, /zh/, and /dh/ spoken with the vowel /a/ (as in father) between them. The speech is digitized at 22050 Hz, 8 bit quantization, producing a raw signal containing 84,992 samples. Applying our GP tracker to the digitized speech signal yields the figure atop the next column: (We currently ignore approximately 1500 samples at the end of the utterance to simplify the implementation of smoothing the transform. Hence the missing GPs for the final /a/ sound).
The x-axis is the glottal pulse number (GP#) (hence not uniformly spaced in time); the yaxis is the number of samples in a glottal pulse period, which is inversely proportional to frequency. Thus the peaks in this figure are frequency dips. For example the first large peak is the 265th glottal pulse and contains 220 samples. Dividing that figure into the sampling rate of 22050 gives F0 ≈ 100 Hz. The peak occurs during the sound /v/. The GPs of the preceding vowel contain about 158 samples, equivalent to an F0 of 140. The three peaks to the right of /v/ correspond to the other voiced fricatives, viz. /z/, /zh/, /dh/. We also observe that the /m/, /n/ and /l/ are boxed in by “sidebands,” sudden small jumps in apparent frequency. For example the sidebands surrounding /m/ are at GP#s 42 and 62; the ones for /n/ are at GP#s 105 (rather indistinctly) and 136; and for /l/ at GP#s 179 and 204. In the case of the nasals /m/ and /n/, the sidebands are the result of the rapid phase changes induced by the opening and closing of the nasal cavity port, which changes the number of acoustic paths from source to egress. In the case of the lateral consonant /l/, the phase changes result from the position of the tongue, which creates more than one path for the sound to propagate through the vocal tract. This behavior in the speech signals of /m/, /n/ and /l/ is anticipated in [1, p 187].
When we track the glottal pulse using the more traditional autocorrelation method, we get this figure.
The peaks corresponding to the voiced fricatives are still detected, but the sideband behavior of the other consonants goes for the most part undetected. That’s one reason we favor our GP tracker. To emphasize the peaks and give added assurance that we do indeed have voiced fricatives, we add the two glottal pulse tracks and filter the results to remove the effects of high frequencies. We then derive a second track by applying a moving average based on a width of 35 GPs. The result is shown in the following figure. The averaged signal is the smoother looking of the two. The first and last 35 samples are assigned the same values as the first and last computed averages, respectively.
We subtract the averaged signal from the filtered signal and zero below the axis to
arrive at the following figure. We call this derived signal FRIC(S).
The x-axis is still glottal pulse number. The y-axis can be used to identify a threshold for separating voiced fricatives from other consonants. Peaks that exceed 20 are deemed voiced fricatives in this case. This behavior has held for both a male and a female speaker, but more data are needed to draw general conclusions. The threshold is likely to be speaker dependent, and it may also depend on the extremes of pitch occurring in the overall speech context of the consonants in question. The small peaks in the left half of the preceding figure correspond to the /m/, /n/, and /l/ (a double peak). We wouldn’t be sure that they indicate a consonant presence by themselves, but we are helped by another phenomenon that further corroborates the voiced fricatives. In the speech signal a drop in amplitude relative to the surrounding vowels characterizes many consonants including those under discussion. This is also observed in [1]. Returning to the digitized signal of /amanalavazazhadha/, we take its absolute value and replace every 400 samples with a single maximum value from that range. This produces a modified signal containing 212 “super”-samples. We apply a smoothing filter to produce a signal called Tmax(S). Avgmax(S) is computed by applying to
Tmax(s) a moving average filter based on a width of 25. As above, the values assigned to the first and last 25 points are identical to the first and last computed averages. Below is a display of Tmax(S) with the much flatter Avgmax(S) superimposed on it.
Since we are interested in emphasizing the dips in the signal we subtract Tmax(S) from Avgmax(S) to achieve the following result.
The peaks in this display locate the consonants. The width of the peaks in their upper third averages 6 units or 2400 original samples, a resolution in time of 109 ms, which is sufficient for lip-synching. We modify this signal by zeroing values below the x-axis and normalizing both axes to the interval [0,1], to produce a representation we call Z(S). We normalize FRIC(S) in a similar manner and superimpose the results, permitting a comparison between the amplitude and
frequency analyses. Z(S) is the one with the seven high peaks.
Because of normalization the relative height of peaks from FRIC(S) and Z(S) are not comparable, but their location on the x-axis is. From this figure we can see that the shifts in fundamental frequency that are significant for consonant identification are the ones that coincide with an area of lowered amplitude. Thus the small maxima from FRIC(S) between the amplitude peaks of Z(S) may be ignored, whereas when they overlap the taller peaks, they are likely to indicate the presence of a consonant. Finally, the occurrence of a voiced fricative is indicated by the confluence of a drop in apparent frequency and a dip in amplitude. With the class of voiced fricatives identified, it becomes necessary to determine which voiced fricative actually occurred. This is necessary in lip-synching because each of /v/, /z/, /zh/, and /dh/ corresponds to a different mouth shape. We are currently working on algorithms to isolate the individual voiced fricatives using spectral moments. This approach has been successful in lip-synching vowels, as reported in [2–6]. Given an interval of the speech signal determined to be a voice fricative, we compute the GP sequence as described above, and then compute a DFT across each GP using a fast (discrete) Fourier transform
algorithm. From the output of the DFT we produce a spectrum. These spectra are smoothed and normalized in such a way that they take on the mathematical properties of a probability density function [4-6]. With that done, we proceed in the manner described in the following two paragraphs. The first moment (m1) and second central moment about the mean (m2) of a probability density function have long been used as a simple measure of the shape of the distribution. We create a two-dimensional moment space with m1 as the horizontal axis and m2 as the vertical axis and plot the (m1, m2) values for the set of smoothed spectra of the voiced fricative. In essence we are graphing one measure of the spectral shapes of the sound. Our hypothesis, still under investigation, is that the (m1, m2) values for different voiced fricatives will occur in different, separable regions of moment space. That is, different voiced fricatives will have measurably different spectra. We have preliminary results in which we have succeeded in isolating /z/ and /zh/ from each other and from /v/ and /dh/. So far we have not been able to isolate /v/ from /dh/ systematically. The work discussed in this paper is “in progress.” All of the parameters we have used for filtering and averaging are subject to experiment and improvement. Since consonant boundaries appear to be defined by rapid phase shifts, which we measure indirectly by observing changes in apparent F0, we may gain resolution by measuring the phase changes of the first harmonic directly, which we can get from the Fourier transform. We have begun that investigation. We are also in the process of refining other aspects of the methodology by studying
more speech data. Nonetheless all indications are that by computing sudden changes in amplitude and phase (as reflected in our measurements of fundamental frequency), we will be able to segment the speech signal into consonant classes that will make the difficult process of text-free lip-synching more effective. References [1] K. N. Stevens, Acoustic Phonetics. Cambridge, MA:The MIT Press, 1998. [2] B. Koster, R. Rodman, D Bitzer, Automated lip-sync: direct translation of speech-sound to mouth shape, Proceedings of the 28th Annual Asilomar Conference on Signals, Systems and Computers, (IEEE publication) 1994, pp 36-46. [3] B. Koster, Automatic Lip-Sync: Direct Translation of Speech-Sound to MouthAnimation. Ph.D. Dissertation. Department of Computer Science, North Carolina State University, Raleigh, NC 27695. 1995. [4] D.F. McAllister, R.D. Rodman, D.L. Bitzer, A.S. Freeman, Lip synchronization for animation, SIGGRAPH 97 Visual Proceedings, 1997, p 225. [5] D.F. McAllister, R.D. Rodman, D.L. Bitzer, A.S. Freeman, Lip synchronization as an aid to the hearing impaired," Proc. AVIOS 97, 1997, pp 233-248. [6] D.F. McAllister, R.D. Rodman, D.L. Bitzer, A.S. Freeman, Lip synchronization of speech, Proc. AVSP 97, 1997, pp 133-136.