Oct 21, 1995 - mance on live unstained cell images, which can be characterized as being of ... This paper presents a two-stage strategy for cell segmentation.
IEEE Transactions on Biomedical Engineering, 42(1), pp1-12, January, 1995
LIVE CELL IMAGE SEGMENTATION� Kenong Wu, David Gauthier and Martin D. Levine
Center for Intelligent Machines McGill University, 3480 University Street Montreal, Quebec, Canada H3A 2A7 October 21, 1995
Abstract A major requirement of an automated, real-time, computer vision-based cell tracking system is an e�cient method for segmenting cell images. The usual segmentation algorithms proposed in the literature exhibit weak performance on live unstained cell images, which can be characterized as being of low contrast, intensity-variant, and unevenly illuminated. We propose a two-stage segmentation strategy which involves: (1) extracting an approximate region containing the cell and part of the background near the cell and (2) segmenting the cell from the background within this region. The approach e�ectively reduces the in uence of peripheral background intensities and texture on the extraction of a cell region. The experimental results show that this approach for segmenting cell images is both fast and robust.
Keywords:
Image thresholding, cell segmentation, cell tracking, video microscopy, image processing, computer vision. �
All correspondence should be addressed to M. D. Levine
1
1 Introduction The study of cell movement and cell behavior is of fundamental importance in areas such as cell embryology, wound healing, host defense mechanisms, and mechanisms of tumor cell metastasis and invasion [24]. Under both normal and pathological conditions, certain types of cells exhibit extensive motion, often migrating to entirely di�erent parts of the organism. In embryological development, for example, neural crest cells migrate from the neural tube to various areas of the embryo and transform into structures such as pigment cells, spinal ganglia and visceral cartilages. In wound healing, broblasts migrate to the site of damaged tissue to help knit together the edges of the wound and restore the connective tissue matrix. In host defense mechanisms, leukocytes, lymphocytes, and macrophages are mobilized to immunological sites. The mechanisms of metastasis and invasion are tied to cell locomotion and are basic to the spread of cancer. The investigation of cell movement and behavior has led to the development of automated systems, designed to quantify the behavior of cells on a 2-D substratum or in a 3-D collagen gel [1, 3, 13, 17, 23]. Computer-controlled stage positioning and digital image acquisition systems enable sequences of cell images to be obtained using time-lapse procedures and analyzed using computer vision techniques. Analysis of an image begins with a segmentation process, which di�erentiates meaningful regions of interest from the background. In our case, we are attempting to identify regions which most likely correspond to cells. This step is critical in that its outcome serves as the basis for all subsequent analyses, such as the extraction of shape features, and ultimately the interpretation of cell movement and behavior. Cell segmentation is also one of the most challenging problems due to both the complex nature of the cells and problems inherent to video microscopy. In both 2-D and 3-D tissue culture environments, cells are non-rigid, irregularly-shaped bodies. The cells' external environment in uences their shapes, which in turn a�ects their locomotory behavior and ultimately how they function. Cells that naturally migrate within organisms can take on a variety of di�erent sizes and shapes, and can migrate at di�erent rates, depending on their current functional state. As the cell changes 2
shape during locomotion, the contrast between the cell boundary and the background varies continually. In some instances, portions of the cell membrane can appear to be occluded. Artifacts in the environment, such as small pieces of membrane and organelles within the cell, can easily be mistaken for the cell's membrane. In addition, equipment-related factors which contribute to the quality of the image, such as uneven illumination and electronic or optical noise, also play an important role in the e�ective segmentation of a digital image. The segmentation approach adopted must be robust against these problems in order to ensure that reliable information is obtained. This paper presents a two-stage strategy for cell segmentation. The technique was developed in response to the speci c problems encountered when imaging live cells that are embedded in a collagen gel. In the rst stage of the algorithm, the region of the image that contains the cell, as well as a small portion of its surrounding background, is isolated. The exact shape and size of this region are not important, and hence the region is referred to as an approximate region. In the second stage, the data within the approximate region are analyzed to accurately segment the cell from its background. Closely restricting the region of the image that is examined by the segmentation process reduces many of the di�culties associated with cell segmentation, resulting in more reliable results. The organization of this paper is as follows. Section 2 describes the imaging system and the characteristics of cell images upon which our segmentation approach relies. In Section 3, the details of the segmentation method are developed. The experimental results and properties of the segmentation method are presented in Section 4.
2 Materials and Methods 2.1 Biological Methodology The images used in our studies are of live unstained cells embedded in a 3-D collagen gel. The gel is produced by polymerizing a solution of 1.5 mg/ml collagen and cell growth media in a 3.5 cm diameter Petri dish. The thickness of the gel is 3
approximately 1200 microns. The cells are embedded by adding them to the solution just prior to polymerization [4, 16].
2.2 Imaging System A real-time automated 3-D cell tracking and optical sectioning system has been developed for studying cell movement and behaviour in vitro [3]. The basic components of the system are an inverted light microscope equipped with either a 6X/0.10NA or 10X/0.30NA Pl Fluotar objective, a 1.25X projection lens, and a 10X phot camera ocular; an illumination and shutter controller; a monochrome vidicon camera; a 512 by 480 pixel, 8 bit digital frame grabber; and a three-axis positioning stage which allows any cell to be centered within the eld of view of the microscope. A discussion of the relative merits of various microscope optical systems can be found in [9]. We have found that with the given instrumentation, Koehler illumination and bright eld optics provide the best results when imaging cells embedded in a collagen gel. Phase contrast microscopy produces higher contrast images but the characteristic halos around the cell are inconsistent from one image to the next. The approaches using a confocal microscope that we have investigated could not image cells in collagen at our working magni cation. The collagen bers scattered the light to such an extent that the cells were invisible (see item 5 in Section 2.4). The microscope magni cation is chosen to optimize the performance of the cell tracking system. Higher magni cations enable the image analysis algorithms to yield the most accurate and detailed position and boundary information but this is at the expense of the number of cells that can be tracked. As the magni cation is increased, the focal distance decreases, thereby limiting the thickness of the collagen gel that can be used. We have found that we can obtain reasonable results with a magni cation between 75X and 125X.
4
2.3 Cell Tracking Methodology The tracking system acquires, analyses, and characterizes sequences of digital images in real-time. It tracks a number of cells concurrently, using time-lapse techniques to follow their movements over extended periods of time. The system records position and boundary information of the cells at speci ed regular time intervals. When initializing the tracking system, an operator identi es the cells that are to be tracked. For each cell selected, a square tracking window containing the cell is de ned. For 3-D experiments, the tracking window is actually a cube. The size of the window is based on the size of the cell and the maximum distance that the cell may be expected to travel between successive samples, as estimated from previous experiments. The window must be su�ciently large to ensure that a cell cannot migrate from the center of the window to beyond its boundaries, within a single sample interval. The system optically sections through each cell's tracking volume. The out-offocus information is not removed from each slice per se. A focus algorithm is applied to the sections and an estimate of the depth of the cell is derived from the best focused sections. Our experiments have demonstrated that this approach is a consistent and reliable means of estimating the depth of the cells in the gel. The cell segmentation algorithm is then applied to the best focused section. Cell boundary information is extracted from the segmented cell. The tracking system analyses each cell in sequence and then repeats the process at a speci ed sampling frequency. Only one cell is allowed to reside in a tracking window throughout the duration of the experiment. This is assured initially by selecting only those cells that may be isolated in a tracking volume. The selected cell is maintained within its volume by resetting the position of the center of the volume to the estimated center of the cell after each sample. A speci c algorithm that deals with dividing cells has been developed and successfully tested [26]. The case of multiple unrelated cells moving in and out of the tracking window has not yet been addressed. In a typical experiment with 30 micron diameter broblasts, the tracking volume's dimensions would be 100X100X100 microns, the sampling interval would be every 5
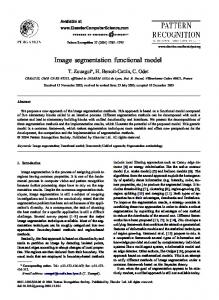
Figure 1: A typical image of a cell embedded in a 3-D collagen gel. two minutes, and ten optical sections at ten micron intervals would be acquired. The number of cells tracked would depend on the vision algorithms employed and the processing speed of the computer system.
2.4 Characteristics of Cell Images A portion of a typical image, containing a single cell, is shown in Figure 1. Figure 2(a) shows a vertical pro le through the center of the image, that is, a plot of the pixel intensities along a single column. Figure 2(b) depicts the intensity histogram of the whole image. There are several notable characteristics of this image, which are common to typical images that we encounter of cells embedded in a collagen gel. 1. The contrast of intensities between the cell and the background is low. This is evident from the intensity histogram (see Figure 2(b)). For an image whose intensity values in the background and foreground are clearly distinguishable, a histogram would depict two distinct peaks, corresponding to the background and foreground intensities. The histogram of the cell image is unimodal, re ecting the low separation in average intensity of the cell and background. 6
180
160
2500 background
cell
background 2000
number of pixels
Gray level value
140
120
100
1500
1000
80 500 60
40 0
50
100
150
200
250
0 0
300
vertical position
50
100
150
200
250
300
gray level value
(a)
(b)
Figure 2: Characteristics of a cell image. (a) An intensity pro le cut vertically through the center of the image in Figure 1. The image intensity values vary across the image but they exhibit the highest variation and attain the lowest intensities within the cell region; (b) The histogram of the image in Figure 1 shows that image intensity values in the background and foreground overlap heavily.
2. The average intensity of the background is often nonuniform across the image. 3. The average intensity is slightly darker within the cell than in the local surrounding background. It is emphasized that this observation holds only within the local surroundings. Due to variations in the average intensity of the background across the image and the low contrast between cell and background intensities, cells in one region of the image may appear lighter than the background in a distant region. 4. High local variation of intensity is observed both within the cell and the background. However, the local variation of intensity is higher within the cell and near the cell boundary than in background regions. 5. Cells embedded in a collagen gel physically change the optical properties of the system, depending on their shape. Scanning electron microscope sections of a cell embedded in a collagen gel [7] reveal that the gel's bers resemble a mat of randomly oriented strands that completely surround the cell. Depending on 7
their density, these bers result in varying degrees of optical distortion due to light scattering. The 3-D matrix of the gel also allows the cell to take on a number of di�erent shapes that are not encountered in 2-D environments such as when the cell is on a glass substrate. This 3-D matrix also a�ects the imaging of the cell. For instance, when a cell is round, it acts like a lens and a halo is produced around it. When a cell is stellate or bipolar in shape, parts of the membrane are at and can become indistinguishable from the background. 6. The boundary of the cell may be extremely di�cult to de ne. Due to variations in intensity, both within the cell and in the background, as well as the presence of a partial halo, portions of the cell may appear to blend directly into the background, without creating a distinct boundary. It is evident that it is di�cult to accurately distinguish the cell boundary from the background. The problem becomes even more di�cult with the existence of artifacts, such as stray pieces of membrane that may result from lysis, or when there is more than one cell in the eld of view. While the characteristics presented above attest to the di�culty in identifying cells, a close examination reveals information which can be used. We observed that two image features, local variation of intensity and image intensity level can be used to identify regions of the image that describe cells. High local variation of intensity is exhibited by regions within and near the boundaries of cells. Thus local variation of intensity can roughly identify regions of the image that contain cells. Across the entire image, changes in intensity level cannot reliably distinguish cells, due to possible nonuniformity of the average background intensity and low contrast between cells and background. However, within a small region of the image, changes in intensity level can e�ectively distinguish a cell, since locally a cell is darker than its surrounding background.
8
3 Segmentation Strategy 3.1 Why Approximate Region-Based Segmentation? Segmentation is the partitioning of a scene into di�erent meaningful regions, by identifying regions of an image that have common properties while separating regions that are dissimilar [12]. A number of techniques have been reported for image segmentation [5, 20, 25]. It is evident that no single method has been found that can universally produce satisfactory results. One reason for this is that the segmentation techniques are often constrained by instrumentation and experimental conditions. For example, in real-time applications, segmentation must be completed within relatively short sample time intervals. In our application, this may range from seconds to a few minutes depending on the algorithm selected and the number of cells that are being tracked. Only those techniques which can perform to a su�cient level of accuracy within the allocated time period can be considered. Also, techniques that rely on image enhancing stains or uorescing compounds [6, 14], which alter the physiological makeup of the cells or their environment, may not be acceptable in some applications. A popular segmentation scheme is image thresholding [5, 20, 25], which can be regarded as pixel classi cation. A feature value, such as gray level intensity or local variation of intensity, is associated with each pixel. The feature value is compared to the threshold in order to map the pixel onto one of two groups, corresponding to objects and background regions. Thresholding is computationally simpler than other segmentation techniques, such as boundary detection or region split-and-merge, and it is therefore attractive for applications in which a minimal computation time is a constraint. Thresholding methods can be classi ed as either global or local. Global methods use a single threshold level for the entire image [10, 18]. This approach is not suitable if a feature varies across the background of the image. For example, if the average intensity level were to vary across the background due to uneven illumination, as commonly occurs in video microscopy, a global approach will not provide adequate 9
results. The average intensity of a cell, while lower than the average intensity of the surrounding background, may be higher than the average intensity of distant background regions. Attempting to impose a global threshold across the image would result in darker background regions being misclassi ed as cells and lighter cell regions being misclassi ed as background. Local thresholding methods develop a threshold surface, which allows a di�erent threshold value to be applied at each pixel. This approach is e�ective if the feature varies across the background of the image, since the threshold surface can adapt to the variations. Threshold surfaces can be determined by interpolating either the image features at points with local maximum gradient, indicating probable object edges [28], or thresholds derived from those subregions which are thought to contain both background and objects [15, 2]. Local thresholding methods are often considered to segment images with unimodal histograms. Zhang and Gerbrands recently proposed a transition region-based thresholding method, which, like local thresholding methods, assumes that pixels with high intensity gradients are located on object boundaries [29]. These approaches are not applicable when live unstained cells are considered because the gray level intensity of a cell image varies, not only on the boundary, but also within cells and throughout the background (see Figure 2(a)). Attempting to apply these techniques to this kind of cell image tends to include high gradient-value nonboundary pixels in the set of boundary pixels, while excluding low gradient-value boundary pixels. A result of applying a local thresholding method [2] to the image in Figure 1 is given in Figure 7(c). Thresholding based on local variation of intensity is ine�ective, since high local variation of intensity identi es only approximate regions containing cells. An example of this kind of segmentation approach is given by [27], which makes use of an edge map in a sequence of images rather than a single image. In general, these segmentation schemes based on either gray level intensity or local variation of intensity are usually unsatisfactory. Spadinger et al. have proposed a method to detect live unstained V 79 cells based on a single one-dimensional pro le [22]. However, the overall cell shapes cannot be perceived by their method. We have developed a multi-stage segmentation strategy, using two image features associated with cell regions, namely, intensity level and local variation of intensity. 10
The rst step of our approach applys a global threshold to the local variation of intensity. This step segments a region of the image, consisting of a cell and the nearby surrounding background, from the distant background. Since local variation of intensity is stable across the regions of the background that are distant from cells, a global threshold is e�ective. The region of the image that is segmented is referred to as the approximate region. It is then further segmented by applying a global intensity threshold. Within this region, the average intensity of the background is su�ciently uniform, and again a global threshold is e�ective. At this stage, the cell has been segmented from the background. Smoothing and lling schemes are implemented to obtain a cell boundary representation. The advantage of this approach is that by borrowing the concept of image feature adaptation from local thresholding schemes, the pixels within the approximate region represent a better sample of the region to be segmented. This method results in a more accurate estimate of the intensity threshold than both strictly global and local thresholding approaches, and is computationally less expensive than local approaches.
3.2 Obtaining the Approximate Region The rst stage of the algorithm is to segment the approximate region, that is, a region which contains the cell and its neighboring background, from the background which is distant from the cell. This is e�ected by applying a global threshold to the local variation of intensity. A measure of local variation of intensity is provided by the second-order statistic, the variance, of the gray level intensity. The variance at each pixel is computed over a square neighborhood, or a mask, centered at the given pixel: +M iX +M jX �2(i; j ) = W1 2 � [I (k; l) ? �(i; j )]2 ; (1) k=i?M l=j?M where I (i; j ) is the gray level intensity at pixel (i; j ), W is an odd integer denoting the width of the mask, M = (W ? 1)=2 and �(i; j ) is the mean intensity within the mask, computed by: +M iX +M jX 1 I (k; l) : (2) �(i; j ) = W 2 � k=i?M l=j?M 11
(a)
(b)
4500 4000 3500
number of pixels
3000 2500 2000 1500 1000 500 0 0
50
100
150
200
250
300
normalized variance value
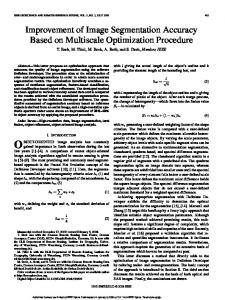
(c) Figure 3: Obtaining an approximate region. (a) The variance map of the image in Figure 1, with
W = 41. To show the variance in the form of a gray level image, it has been normalized within the
range 0 ? 255; (b) A boundary of the approximate region superimposed on the original image. (c) The histogram of the variance map in (a).
A fast algorithm for computing the variance is described in the Appendix. The normalized variance of the cell image displayed in Figure 1 is shown in Figure 3(a). The histogram of the variance map, depicted in Figure 3(c), can be described as a narrow peak of low variance and an elongated tail of high variance. The area of high variance corresponds to the approximate region. The boundary of this region, superimposed on the original image, is shown in Figure 3(b). The approximate region is segmented from the entire image by applying a minimumerror thresholding method, proposed by and Illingworth [10]. This method assumes that the gray levels of the object and background are normally distributed; it yields 12
a threshold at the intersection of the two distributions. The method was adopted at this stage since it performs well in cases where the distributions of the object and background gray levels have unequal variances. The histogram of the variance map describes two Gaussian-like curves with unequal variances: the rst corresponds to the narrow peak and represents the background; the second, of much higher variance, corresponds to the elongated tail and represents the object, or approximate region. The thresholding method proposed by Otsu [18], which is implemented in the next stage of our algorithm, is not as suitable as that of Kittler and Illingworth at this stage since it produces a biased threshold in the case of unequal variances. The thresholds for the histogram of Figure 3(c), computed by both methods, are shown in Figure 4; the boundaries of approximate regions that would be segmented based on each threshold are indicated in Figure 5, superimposed on the original image. Clearly Otsu's method results in object clipping. Since thresholding often misclassi es small regions of either the background or the object, producing small disjoint secondary objects or holes in the main object, the results of thresholding are further processed using a component labeling procedure, which is described below in Section 3.3, to obtain a single, connected region without holes.
3.3 Segmenting Cells The next stage of the algorithm segments the cell from the background within the approximate region, by applying a global threshold to the gray level intensity. The method employed was rst presented by Otsu and is based on a statistical analysis of variance [18]. An threshold is selected by maximizing the separability of the resultant composite histogram, that is, the ratio of between-class and within-class variances. It has been suggested that this approach is better than many popular global thresholding methods [11, 20]. In particular, it performs well in situations where there is little contrast between background and object, that is, in cases where a histogram can be modeled by two overlapping Gaussian curves with little separation between the two modes. As discussed above, the intensity histograms of our images are unimodal. 13
4500 4000 3500
number of pixels
3000 2500 K&I
OTSU
2000 1500 1000 500 0 0
50
100
150
200
250
300
normalized variance value
Figure 4: A comparison of the performance of Otsu's and Kittler and Illingworth's methods on the variance map in Figure 3 (a).
The method of Kittler and Illingworth is not suitable at this stage, since this method deteriorates as the overlap between the Gaussians describing the background and object intensities increases. Figure 6 plots the histograms obtained from the entire image and from the approximate region and shows Otsu's thresholds computed from these two histograms. Figure 7(a) shows the result of applying Otsu's thresholding method in the approximate region. Compared to Figure 7(b), which is obtained with Otsu's method applied to the entire image, the background noise is greatly reduced. As shown in Figure 7(a), thresholding the image can incur two kinds of noise: background pixels misclassi ed as foreground, which produce small disjoint foreground components in addition to the cell region, and foreground pixels misclassi ed as the background, which produce holes in the cell region. Misclassi cation of either foreground or background pixels near the cell boundary can also produce an extremely coarse boundary. The cell boundary representation can be obtained by removing holes and smoothing boundaries [3] using component labeling [19] and morphology 14
Figure 5: A comparison of results obtained by two thresholding methods. The outer closed contour is the boundary of the approximate region obtained by Kittler and Illingworth's thresholding method; the inner contour is obtained by Otsu's thresholding method. Both have been applied to the image in Figure 3(a).
operations [21]. This approach identi es and determines the size of each distinct connected foreground component; the largest foreground component is then assumed to represent the cell. All but the largest foreground component are then assimilated into the background. The boundary of the single remaining foreground component is smoothed using a morphological closing operation. Finally, holes in the foreground component are lled. This is accomplished by applying the component labeling procedure to the background in order to identify small disjoint background components, that is, holes in the foreground. These holes are then merged into the foreground. In some cases, artifacts can be mistaken for the cell membrane. Therefore a simple mechanism was designed to reject artifacts during the segmentation procedure. After component labeling is applied to regions obtained by thresholding the variance map, the largest region is used for the second stage, but other regions are recorded as well. After a cell region is obtained during the second stage, an algorithm examines 15
3000
4
2500
3
number of pixels
2000
1500
1
1000
500 2 0 0
50
100
150
200
250
300
gray level vaule
Figure 6: Thresholds obtained from the image in Figure 1 and an approximate region within this image. 1- the histogram of the entire image, 2- the histogram of the approximate region, 3- Otsu's threshold for the entire image, 4- Otsu's threshold for the approximate region.
several features of the segmented cell, such as length, width, area and perimeter, and compares this with previous samples of the same cell to ensure that the correct cell region was selected. If there is a signi cant discrepancy, the system will select the next largest region recorded in the rst stage and repeat the second stage until a similar cell region is found. Large artifacts can be eliminated in this way. Small artifacts can be removed by component labeling, as indicated in Figure 8.
4 Experiments and Discussion Results of various stages of the complete cell segmentation are illustrated in Figure 8. In the rst stage of the algorithm, identifying the approximate region, a single parameter is speci ed { the size of the mask used to compute the variance. The mask size is based on the size of the cell within the image. A mask whose size is approximately two to three times smaller than the size of an average cell provides satisfactory results. In our experiments, we employed a mask of size 41 � 41 (in 16
(a)
(b)
(c)
Figure 7: A comparison of thresholding results for the image in Figure 1. (a) The result of Otsu's
method applied to the approximate region. (b) The result of Otsu's method applied to the entire image. (c) The result of a local thresholding method [2]. In (b) and (c), the misclassi ed pixels in the background make it very di�cult to detect the cell in these two binary images.
17
(a)
(b)
(c)
(d)
(e)
(f)
Figure 8: The two-stage cell segmentation method: (a) a cell image; (b) the boundary of the
approximate region superimposed on the cell image; (c) the result of thresholding the approximate region; (d) the largest component in the foreground without small artifacts; (e) the result of the closing operation and lling holes; (f) the cell boundary overlapped by the original image.
18
pixels). The sensitivity of the method to variations in the mask size was evaluated by examining the e�ect of mask size on identi cation of the approximate region and on subsequent cell segmentation. Figure 9 shows the variation in the approximate regions that are identi ed as the mask size increases from 25 � 25 to 55 � 55, while Figure 10 plots the intensity threshold that would be computed in the second stage of the algorithm based on these approximate regions. It is observed that changing the mask size from 25 � 25 to 55 � 55 does not produce any dramatic variations in the approximate region identi ed, and moreover, does not result in a change of intensity threshold of more than two gray levels. These results indicate that intensity variance is a robust feature for identifying the approximate region and that the performance of this method is stable with respect to changes in the mask size. We initially tested the algorithm on ve individual images, three of size of 256�256 and two of size of 128 � 128. The algorithm worked very well on four of the them. One segmented cell image is shown in Figure 8 and the other three are shown in Figure 11. The failed segmentation was due to an artifact which separated the cell into two parts. Secondly, the algorithm was employed in a dividing-cell tracking system [26]. Two sequences of cell images were used, each containing 11 images. Experiments showed that the algorithm correctly segmented cells from the background and ensured successful cell tracking and identi cation. Thirdly, we conducted approximately fty experiments on tracking two or three cells in real-time. The duration of each experiment was twenty-four hours and each cell was sampled every two minutes. The segmentation algorithm was applied at least 1,440 times per experiment. Our results showed that if our design constraints are met, that is, only one cell is within the tracking window and no other cells move into the window, the system successfully tracks the cells. By design, the tracking system is also fairly robust against random segmentation errors. If a problem should occur with segmentation which results in a small error in estimating a portion of the cell's boundary, it is normally corrected in the next sample. The overall strategy discussed here is consistent with our requirements for a realtime tracking system. A fast algorithm was developed to compute the variance map 19
25 � 25
27 � 27
29 � 29
31 � 31
33 � 33
35 � 35
37 � 37
39 � 39
41 � 41
43 � 43
45 � 45
47 � 47
49 � 49 51 � 51 53 � 53 55 � 55 Figure 9: Di�erent approximate regions generated by varying the variance mask size for the image in Figure 1.
using large masks, as described in the Appendix. Execution time at the second stage is inherently kept low by restricting computations to the small approximate region. The algorithm was implemented in C on a SUN SPARC10-30 workstation. Complete segmentation of a 256 � 256, 8-bit gray level image containing one cell can be executed in under one second.
20
122 121.5
Otsu threshold value
121 120.5 120 119.5 119 118.5 118 25
30
35
40
45
50
55
mask size
Figure 10: Otsu's thresholds vs mask size. When the mask size applied to the image in Figure 1 changes from 25 � 25 to 55 � 55, Otsu's threshold changes from 121 to 119.
5 Conclusion We have presented a two-stage segmentation approach for light microscope images of live and unstained cells. The basic idea behind successful segmentation is to e�ciently restrict in uences from areas in the distant background to a�ect the computation of the gray level threshold and extraction of the cell boundary. We noted that reducing the size of the original image to a smaller xed rectangle is usually not e�ective due to the irregular size and shape of the cells. Our method automatically adapts both the shape and size of the region to the cell to e�ectively eliminate peripheral background intensities and texture. Bias that the background could contribute to the segmentation algorithm is therefore reduced. The experimental results presented demonstrate that the approach is both fast and robust for the type of images considered. This approach has been employed in a system which tracks multiple cells in real-time.
Acknowledgements 21
(a)
(b)
(c)
(d)
(e)
(f)
(g)
(h)
(i)
Figure 11: (a), (d), (g) show three cell images; (b), (e), (h) show the boundaries of the approximate regions; (c), (f), (i) show cell boundaries superimposed on the original images. The image size is 256 � 256 in (a) and (d) and is 128 � 128 in (g). The mask size is 41 � 41 for all three images.
22
The authors wish to thank Dr. Peter Noble (Faculty of Dentistry, McGill University), for his collaboration in the development of our cell tracking system, and Kim Wheeler for her valuable assistance in testing this algorithm. This work was partially supported by the Medical Research Council of Canada, under grant number MT-3236. Martin Levine would like to thank CIAR and PRECARN for their support.
23
References [1] G. S. Berns and M. W. Berns, \Computer-based tracking of living cells," Experimental Cell Research, vol. 142, pp. 103{109, November 1982. [2] J. Bernsen, \Dynamic thresholding of gray-level images," in Proceedings of 8th International Conference on Pattern Recognition, (Paris, France), pp. 1251{1255, October 1986. [3] D. Gauthier, M. D. Levine, and P. B. Noble, \Principles of object detection for an automated cell tracking system," in Image Analysis in Biology (D. P. Hader, ed.), ch. 2, pp. 9{28, CRC Press, Florida, 1991. [4] C. Guidry and F. Grinnell, \Contraction of hydrated collagen gels by broblasts: Evidence for two mechanisms by which collagen brils are stabilized," Collagen Related Research, vol. 6, pp. 515{529, 1986. [5] R. Haralick and L. Shapiro, \Image segmentation techniques," Computer Vision, Graphics, and Image Processing, vol. 29, pp. 100{132, January 1985. [6] H. Harms, H. M. Aus, H. M., and U. Gunzer, \Segmentation of stained blood cell images measured at high scanning density with high magni cation and high numerical aperture optics," Cytometry, vol. 7, pp. 522{531, November 1986. [7] J. P. Heath and L. D. Peachey, \Morphology of broblasts in collagen gels: A study using 400kev electron microscopy and computer graphics," Cell Motility and the Cytoskeleton, vol. 14, pp. 382{392, 1989. [8] T. S. Huang, G. J. Yang, and G. Y. Tang, \A fast two-dimensional median ltering algorithm," IEEE Transactions on Acoustics, Speech, and Signal Processing, vol. ASSP-27, no. 1, pp. 13{18, 1979. [9] S. Inou�e, Video Microscopy. New York: Plenum Press, 1986. [10] J. Kittler and J. Illingworth, \Minimumerror thresholding," Pattern Recognition, vol. 19, no. 1, pp. 41{47, 1986. 24
[11] S. U. Lee, S. Y. Chung, and R. H. Park, \A comparative performance study for several global thresholding techniques for segmentation," Computer Vision, Graphics, and Image Processing, vol. 52, pp. 171{190, 1990. [12] M. D. Levine, Vision in Man and Machines. McGraw-Hill, Inc., New York, 1985. [13] M. D. Levine, P. B. Noble, and Y. M. Youssef, \A rule-based system for characterizing blood cell motion," in Image Sequence Processing and Dynamic Scene Analysis (T. S. Huang, ed.), pp. 663{709, NATO ASI series, vol. F2, SpringerVerlag, 1983. [14] C. E. Liedtke, T. Gahm, F. Kappei, and B. Aeikens, \Segmentation of microscopic cell scenes," Analytical and Quantitative Cytology and Histology, vol. 9, pp. 197{211, 1987. [15] Y. Nakagawa and A. Rosenfeld, \Some experiments on variable thresholding," Pattern Recognition, vol. 11, pp. 191{204, 1979. [16] P. B. Noble, \The extracellular matrix and cell migration: Locomotory characteristics of MOS-11 cells within a three-dimensional collagen matrix," Journal of Cell Science, vol. 87, pp. 241{248, 1987. [17] P. B. Noble and M. D. Levine, Computer Assisted Analyses of Cell Locomotion and Chemotaxis. CRC Press, Florida, 1986. [18] N. Otsu, \A threshold selection method from gray level histograms," IEEE Transactions on Systems, Man and Cybernetics, vol. SMC-9, pp. 62{66, 1979. [19] A. Rosenfeld and A. Kak, Digital Picture Processing. Academic Press, Inc., New York, 1976. [20] P. K. Sahoo, A. K. Saltani, A. K. C. Wong, and Y. C. Chen, \A survey of thresholding techniques," Computer Vision, Graphics, and Image Processing, vol. 41, pp. 233{260, 1988. [21] J. Serra, Image Analysis and Mathematical Morphology. Academic Press, London, 1982. 25
[22] I. Spadinger, S. S. Poon, and B. Palcic, \Automated detection and recognition of live cells in tissue culture using image cytometry," Cytometry, vol. 10, pp. 375{ 381, 1989. [23] G. Thurston, B. Jaggi, and B. Palcic, \Measurement of cell motility and morphology with an automated microscope system," Cytometry, vol. 9, pp. 411{417, September 1988. [24] J. P. Trinkaus, Cells into Organs: the Forces that Shape the Embryo. 2nd ed., Prentice-Hall Inc., Englewood Cli�s, New Jersey, USA, 1984. [25] J. S. Weszka, \A survey of threshold selection techniques," Computer Graphics, and Image Processing, vol. 7, pp. 259{265, 1978. [26] K. M. Wheeler, \A computer vision system for tracking proliferating cells," Master's thesis, Department of Electrical Engineering, McGill University, August 1992. [27] H. Yang and M. D. Levine, \The background primal sketch: An approach for tracking moving objects," Machine Vision and Applications, vol. 5, no. 1, pp. 17{ 34, 1992. [28] S. D. Yanowitz and A. W. Bruckstein, \A new method for image segmentation," Computer Vision, Graphics, and Image Processing, vol. 46, pp. 82{95, 1989. [29] Y. J. Zhang and J. J. Gerbrands, \Transition region determination based thresholding," Pattern Recognition Letters, vol. 12, pp. 13{23, 1991.
26
A A Fast Algorithm to Compute the Local Variance For simplicity, we assume that the image and the window (called mask in this paper) in the following discussion are square. It is straightforward to extend this fast algorithm to the case of a rectangular image and window. The border processing problem is not considered in the following discussion. Let I = [I (i; j )] be an image of size N by N, where I (i; j ) 2 0; 1; 2; :::; L ? 1 is the set of gray levels, and i; j 2 0; 1; 2; :::; N ? 1 is the index of the pixels. The variance in a window surrounding each pixel (i; j ) is de ned as: +M iX +M jX [I (k; l) ? �(i; j )]2 : (3) �2(i; j ) = W1 2 � k=i?M l=j?M Here W = 3; 5; 7; ::: is the window size, M = (W ? 1)=2 is half the window size, and �(i; j ) is the mean of pixels within the window as follows: +M iX +M jX �(i; j ) = W1 2 � I (k; l) : (4) k=i?M l=j?M The computation in (3) for a whole image requires (2W 2 + 1)N 2 multiplications and (W 2 + 1)W 2N 2 additions. In order to save computation, we can change (3) to another form as follows: 8 2 32 9 > > j + M j + M i + M i + M < = X X X X 1 1 2 2 4 5 I (k; l) ? W 2 � I (k; l) > : (5) � (i; j ) = W 2 � >: ; k=i?M l=j?M k=i?M l=j?M The computation in (5) for a whole image requires (W 2 + 3)N 2 multiplications and (2W 2 + 1)N 2 additions. Although the computation in (5) is less than that in (3), the computation is still high because of redundant computation required for each window. In computing the variance for the current window, we observe that the data in the previous window need to be changed by adding and throwing away W points; the rest of the W (W ? 2) points in the previous window remain unchanged. Huang et al. proposed a fast algorithm for two-dimensional median ltering [8]. It was based on storing and recursively updating the gray level histogram of the image elements in the window. This idea, combined with a look-up table, is used in this 27
paper to develop a fast algorithm for computing the variance for each pixel. The di�erence between our algorithm and theirs is that we generate both the windows in an image and the columns in a window recursively, and they only generate windows in an image recursively. Equation (5) is rewritten as follows: � � (6) �2(i; j ) = 1 � A(i; j ) ? 1 � [B (i; j )]2 :
W2
W2
Here A(i; j ) is the summation of the squares of each pixel value within a window centered at (i; j ), and B (i; j ) is the summation of pixel values within the same window. When the window moves horizontally, the data in a window are changed by adding one column to the right of the window and deleting the leftmost column of the window. Thus, A(i; j ) and B (i; j ) can be expressed in a recursive way as:
Ah(i; j ) = Ah(i ? 1; j ) ? Cs(i ? M ? 1; j ) + Cs(i + M; j ) ;
(7)
Bh (i; j ) = Bh(i ? 1; j ) ? Cp(i ? M ? 1; j ) + Cp(i + M; j ) :
(8)
Here subscript h means that the window moves horizontally. Cs and Cp are, respectively, the summation of the squares of pixel values and the summation of the pixel values within a column. Similarly, if the window moves vertically, the A(i; j ) and B (i; j ) can be written in another way as follows:
Av (i; j ) = Av (i; j ? 1) ? Rs (i; j ? M ? 1) + Rs(i; j + M ) ;
(9)
Bv (i; j ) = Bv (i; j ? 1) ? Rs(i; j ? M ? 1) + Rp(i; j + M ) :
(10)
Here subscript v means that the window moves vertically. Rs and Rp are the summation of the square of pixel values and the summation of pixel values within a row, respectively. If done as above, the computation for Cs ; Cp; Rs , and Rp is actually performed twice, when the column or row is added and when it is removed. However, the computation need only be performed once if we compute Cs ; Cp; Rs , and Rp for all pixels in an image before computing A(i; j ) and B (i; j ). Either the columns or the rows can be overlapped because they are part of the overlapped windows. In computing each column or row, only two pixels in successive 28
columns or rows are altered. This is similar to the case of computing a window. Again a recursive method is used to compute the summation of the columns and rows as follows: Cs(i; j ) = Cs(i; j ? 1) + I 2(i; j ? M ? 1) + I 2(i; j + M ); (11)
Cp(i; j ) = Cp(i; j ? 1) + I (i; j ? M ? 1) + I (i; j + M );
(12)
Rs(i; j ) = Rs (i ? 1; j ) + I 2(i ? M ? 1; j ) + I 2(i + M; j );
(13)
Rp(i; j ) = Rp(i ? 1; j ) + I (i ? M ? 1; j ) + I (i + M; j ):
(14)
The initial values of Ah(0; 0) and Bh(0; 0) are de ned as: M X Rs(0; l); Ah(0; 0) = l=?M M X Rp(0; l): Bh (0; 0) = l=?M The initial values for computing columns and rows are de ned as: M 2 X Rs(0; j ) = I (k; j ); k=?M M X Rp(0; j ) = I (k; j ); k=?M M 2 X I (i; l); Cs(i; 0) = l=?M M X Cp(i; 0) = I (i; l): l=?M A look-up table is used to compute the square value of each pixel. In summary, this fast algorithm consists of the following steps: Step 1:
(15) (16)
(17) (18) (19) (20)
Compute the square value of each pixel in the image using a look-up table.
Compute initial values Rs(0; j ); Rp(0; j ); Cs(i; 0), and Cp(i; 0) using (17), (18), (19), and (20).
Step 2: step 3:
Compute the initial values A(0; 0) and B (0; 0) using (15) and (16).
step 4:
Compute Cs (i; j ) and Cp(i; j ) using (11) and (12). 29
Compute A(i; j ) and B (i; j ) using (7) and (8) when the window moves horizontally and using (9) and (10) only when the window moves downward for the rst pixel on each row of the image.
Step 5:
Compute the variance value �2(i; j ) by using (6), in which 1=W 2 is constant and can be ignored without a�ecting the nal result.
Step 6:
In this algorithm, the number of multiplication is 2N 2 and the number of additions is 9N 2 + 4WN + 2W ? 2. For example, for a 256 � 256 image and a 41 � 41 window, without considering the constant 1=W 2, the number of multiplications is 801 times less than formula (5) and the number of additions in our algorithm is 332 times less than formula (5).
30