Abstract. A key issue in semantic reasoning is the computational com- plexity of inference tasks on expressive ontology languages such as OWL. DL and OWL 2 ...
Predicting Reasoning Performance Using Ontology Metrics Yong-Bin Kang1 , Yuan-Fang Li1 , and Shonali Krishnaswamy1,2 1
Faculty of IT, Monash University, Australia Institute for Infocomm Research, A*STAR, Singapore {yongbin.kang,yuanfang.li,shonali.krishnaswamy}@monash.edu 2
Abstract. A key issue in semantic reasoning is the computational complexity of inference tasks on expressive ontology languages such as OWL DL and OWL 2 DL. Theoretical works have established worst-case complexity results for reasoning tasks for these languages. However, hardness of reasoning about individual ontologies has not been adequately characterised. In this paper, we conduct a systematic study to tackle this problem using machine learning techniques, covering over 350 real-world ontologies and four state-of-the-art, widely-used OWL 2 reasoners. Our main contributions are two-fold. Firstly, we learn various classifiers that accurately predict classification time for an ontology based on its metric values. Secondly, we identify a number of metrics that can be used to effectively predict reasoning performance. Our prediction models have been shown to be highly effective, achieving an accuracy of over 80%.
1
Introduction
Ontologies are essential building blocks of the Semantic Web. However, the high expressivity of ontology languages also incurs high computational complexity. For example, it has been shown that SHOIN (D), the description logic (DL) underlying OWL DL, is of worst-case NExpTime-complete complexity [10]. The complexity of SROIQ(D), the DL underlying OWL 2 DL, is even higher (2NexpTime-complete) [7]. The past decade has seen the development of highly optimized inference algorithms for description logics, with tableau algorithms [2] being a leading exemplar. A number of high-performance tableaux-based reasoners have been developed, including FaCT++ [19], HermiT [15], Pellet [16] and TrOWL [18]. Despite the tremendous progress in ontology reasoning, the high theoretical worst-case complexity results for OWL DL and OWL 2 DL still implies that core reasoning services may be computationally very expensive. For example, it is shown in [4] that although the simpler OWL 2 EL profile has polynomial-time inference algorithms [1], reasoning about large ontologies in OWL 2 EL (Gene Ontology, NCI Thesaurus and SNOMED CT) still requires considerable amounts of time and computational resources. Moreover, worst-case complexity does not necessarily indicate real-world performance on individual ontologies. In this context, it is noteworthy that reasoner P. Cudr´ e-Mauroux et al. (Eds.): ISWC 2012, Part I, LNCS 7649, pp. 198–214, 2012. c Springer-Verlag Berlin Heidelberg 2012 �
Predicting Reasoning Performance Using Ontology Metrics
199
benchmarking has been conducted previously [12,6,4]. However, these works only compared inference performance on a small set of ontologies. They did not attempt to correlate characteristics of ontologies with their inference performance. Hence, they do not provide insight into what makes inference difficult on a given ontology. Metrics have been used widely and successfully to model artefact complexity in combinatorics and software engineering. We believe that they can be similarly applied to the problem of modelling of ontology inference performance, using a set of ontology metrics like those defined in [24] as a basis. In this paper, we tackle the challenge of predicting ontology classification performance by applying machine learning techniques. Specifically, we conduct a comprehensive and rigorous investigation, using more than 350 real-world ontologies and 4 widely-used OWL 2 DL reasoners (FaCT++, HermiT, Pellet and TrOWL).1 Multiple classifiers and feature selection algorithms are tested for their effectiveness. Moreover, 27 metrics are studied for their suitableness for performance prediction. To the best of our knowledge, to date this is the most comprehensive study on characterizing ontology inference performance, and it is the first study on predicting ontology inference performance. The main contributions of this paper can be summarized as follows: Prediction Model. We learn a random forest-based classifier that is consistently accurate in predicting ontology classification time using metrics. The accuracy of the classifier is over 90% for HermiT and TrOWL, and over 80% for FaCT++ and Pellet. Key Metrics. A set of 8 ontology metrics are identified according to their effectiveness in predicting classification performance. These metrics can provide additional insights into ontology engineering and maintenance.
2
Background and Related Work
Works mostly closely related to ours are the ones that compare the performance of OWL reasoners. Benchmarking of description logics (hence ontology) reasoners is not a new topic. However, with the rapid advances made in reasoning algorithms and reasoners, there is sustained interest and need for repeated and rigorous evaluation. Early works [8,9] mainly used synthetic TBoxes for evaluating system performance on less expressive languages (ALC and its predecessors). In [17], Tempich and Volz developed a systematic method of generating synthetic ontologies. They also performed k-means clustering on 95 medium-sized ontologies (65 class expressions and 25 properties on average) and obtained 3 clusters of ontologies, using a number of different language constructs as features. Wang and Parsia [20] developed Tweezers, a profiler for Pellet, that is capable of 1
Note that TrOWL is a reasoning infrastructure that is capable of performing incomplete reasoning for OWL 2 DL through approximation [13]. The degree of completeness is not the focus of this paper and hence is not tested.
200
Y.-B. Kang, Y.-F. Li, and S. Krishnaswamy
collecting inference results and performance statistics. The authors demonstrated how such data can be used to modify an ontolgy to speed up reasoning. In [3], 4 ontologies, each from a language with a different expressivity (RDFS(DL), OWL Lite, OWL DLP and OWL DL) were chosen to compare a number of OWL reasoners. Both TBox and ABox reasoning tasks were compared for a number of reasoners and reason-able triple stores such as Sesame. Reasoner benchmarking has been done using either synthetic or real-world ontologies [12,6]. More recently, 8 modern reasoners are compared on 3 large OWL 2 EL ontologies (Gene Ontology, NCI Thesaurus and SNOMED CT) [4]. Various dimensions of the OWL reasoners were discussed with a focus on performance. The authors drew the conclusion that there is significant performance variability among reasoners and it should be further investigated. This work partially motivated our investigation in this paper. In the SEALS project,2 the Storage and Reasoning Systems Evaluation Campaign 2010 aimed at the evaluation of DL-based reasoners. In the evaluation, the performance of three reasoners: FaCT++, HermiT, and jcel were measured and compared in terms of a suite of standard inference services such as classification, class/ontology satisfiability, and logical entailment. Although the evaluation produces a good performance comparison summary of the different reasoners, it does not seem to identify what impact ontology characteristics have on the performance of these reasoners. There has been research on the development of a series of metrics for analyzing ontology complexity. For example, some metrics have been proposed [22,23] for analyzing ontology complexity by examining the quantity, ratio, and correlativity of classes and relations in a given ontology. However, the metrics developed in this work focused on characteristics of classes without considering a broader range of ontology characteristics. Also, these metrics were mainly designed to analyze complexity evolution and distribution of ontologies, but not for predicting the reasoning performance of ontologies. The work [5] defined some metrics to analyze structural complexity of a given ontology. However, it focused only on analyzing coupling between classes as a measure of ontology complexity. Thus, it does not provide any evidence of how the metrics can be used in analyzing reasoning performance of ontologies. In [24] we proposed a suite of metrics with the aim of characterizing different aspects of ontology design complexity. These metrics consider a broader range of ontology characteristics, and hence are more suitable for the task of performance prediction. All the metrics can be calculated automatically and efficiently, allowing us to leverage them for predicting reasoning performance.
3
Ontology Metrics
In [24] a total of 8 ontology metrics were defined with the aim of measuring different aspects of the design complexity of OWL ontologies. These metrics are defined on a graph representation of an ontology and are used in this paper as 2
http://www.seals-project.eu
Predicting Reasoning Performance Using Ontology Metrics
201
a set of features for predicting reasoner performance. They can be divided into two categories: ontology-level metrics (ONT) and class-level metrics (CLS). In addition to these 8 metrics, we have defined some other metrics that measure different aspects of an ontology’s size and structural characteristics. The metrics are defined on the asserted logical axioms in an ontology and they can be divided into two more categories: anonymous class expressions (ACE) and properties (PRO). For each ontology, we record the sum of each of the CLS, ACE and PRO metrics. Hence there are 27 distinct metrics in total. Note that syntactic sugar axioms such as EquivalenceClasses, Disjoint Classes and PropertyChain are transformed into pair-wise axioms with a quadratic increase in the number of axioms. – Ontology-level Metrics (ONT). The ONT metrics measure the overall characteristics of a given ontology. Besides the 4 metrics defined previously in [24], including SOV (size of vocabulary), EN R (edge-node ratio), T IP (tree impurity) and EOG (entropy of graph), we define 2 new ONT metrics: • CY C (Cyclomatic complexity). CY C is defined as CY C = #E−#N +2∗cc, where cc is the number of strongly connected components of the ontology represented as a graph. CY C measures the number of linearly independent paths in the ontology graph. • RCH (Expression richness). RCH measures the ratio between the number of anonymous class expressions and the total number of class expressions (including named classes). – Class-level Metrics (CLS). Classes are first-class citizens in OWL ontologies, hence we use the 4 CLS metrics defined in [24] to capture characteristics of classes in an ontology. These metrics are N OC (number of children), DIT (depth of inheritance), CID (class in-degree), and COD (class out-degree). – Anonymous Class Expressions (ACE). ACE are an important ingredient in building up expressive classes. The ACE metrics records, for each kind of anonymous class expression, the number of occurrences in an ontology. There are altogether 9 metrics: enumeration (EN U M ), negation (N EG), conjunction (CON J), disjunction (DISJ), universal/existential quantification (U F /EF ) and min/max/exact cardinality (M N CAR/M XCAR/CAR). – Properties (PRO). Similarly, property declarations and axioms may impact reasoning performance. The 8 PRO metrics record the number of occurrences of each type of property declaration/axiom: object/datatype property declaration (OBP /DT P ), functional (F U N ), symmetric (SY M ), transitive (T RN ), inverse functional (IF U N ), property equivalence (EQV ) and inverse (IN V ). Note that although there is no metric specifically for ontology expressivity (EL, QL, etc.), such information is implicitly captured by the ACE and PRO metrics as 0 for a metric indicates the absence of a particular language construct.
4
Investigation Methodology
The principal aims of this paper are two-fold: (1) identifying predictive models that accurately estimate reasoning performance of unknown ontologies, and (2)
202
Y.-B. Kang, Y.-F. Li, and S. Krishnaswamy
experimentally discovering significant metrics that influence reasoning performance. The key steps in our investigation can be summarized as follows: Scoping. There are a number of main reasoning tasks on ontologies, including classification and consistency checking, which are equivalent to each other [2]. We found that classification takes significantly longer than consistency checking, and that there is a significant discrepancy between consistency checking time reported by the reasoners. Thus, we focus on the more difficult reasoning task, classification, and aim to provide insight into prediction models and key metrics embedded in the models. We perform classification on a number of ontologies using different publicly available reasoners. As stated previously, our analysis is conducted on 4 actively-maintained, open-source and widely-used OWL 2 DL reasoners: FaCT++, HermiT, Pellet and TrOWL. Data Collection. We collect a number of ontologies with varying characteristics, including the application domain, file size, underlying ontology language, etc. We compute, for each ontology in the collection, (1) its metric values as presented in Section 3, and (2) an average performance time for the reasoning task of ontology classification for each of the 4 reasoners. Furthermore, since our goal is to learn classifiers, the continuous reasoning time values need to be discretized in order to assign (i.e. classify) ontologies into separate groups (i.e. class labels) based on their reasoning time. Feature Selection. We hypothesize that different metrics may have different effects on ontology classification performance. Feature selection is a very widely-used techniques in data pre-processing to remove irrelevant features. A number of feature selection algorithms are applied to identify and quantitatively study the ontology metrics that have a strong impact on performance. These algorithms typically fall into two categories. Feature ranking algorithms (feature selectors) rank the features by a metric and eliminate all features that do not achieve an adequate threshold. Subset selection algorithms search the set of possible features for the optimal subset. In this work, we consider 6 different feature selectors, since we are interested in ranking individual features (metrics) and then finding relevant features based on their ranks. These are the information gain (InfoGain), information gain ratio (GainInfo), support vector machine based weighting (SVM), ReliefF-based (ReliefF), symmetrical uncertainty (Symm), and chi-squared statistic (ChiSquared) feature selectors. Predictive Model Development. In this work, we develop predictive models using classification techniques (in the machine learning sense) to predict reasoning performance of the classification task (in the ontology reasoning sense). In our evaluation, the categories of ontologies are obtained from discretization of the reasoning time of the ontologies for the task, as stated above. Each ontology is represented as a pair consisting of a subset of metrics and the corresponding category. The subset of metrics is found using the feature selectors described above. Given a dataset consisting of a set of ontologies, we choose the training and test data based on standard 10-fold cross validation, in which each dataset is divided into 10 subsets. Of the 10 subsets, 1 subset is retained as testing data,
Predicting Reasoning Performance Using Ontology Metrics
203
and the remaining 9 subsets are used as training data. The validation process is then repeated 10 folds (times). It is well-known that different classifiers tend to produce different prediction performance. Hence, we employ various classifiers and identify the most effective one to build a predictive model for a given dataset. The effectiveness of each classifier is determined through its classification accuracy (simply accuracy), often considered to be the best performance indicator for evaluating classifiers.3 It measures the proportion of correctly classified ontologies against all ontologies in the testing data. We implement 9 representative classifiers that are available in Weka [21], with the aim of finding the best predictive models for the four reasoners. These are classified into 5 categories: Bayesian classifiers (BayesNet (BN) and Na¨ıveBayes (NB)), decision tree-based classifiers (J48, RandomForest (RF), REP Tree (RT)), rule-based classifiers (DecisionTable (DT)), a regression-based classifier (SimpleLogistic (SL)), and lazy classifiers (IBk[1≤k≤10] and K*). Key Metrics Determination. Identifying the metrics that most highly impact reasoning time can provide insights for ontology engineering. In this step, such metrics are identified by further analyzing outcomes of the feature selectors utilized in the previous step. More specifically, by examining the metrics used in the classifier chosen in the predictive model for each dataset, we can identify which metrics, in conjunction with the classifier, contribute most to accuracy. Given a dataset of metrics for each reasoner, we apply the 9 classifiers on various subsets of metrics that are identified by the 6 feature selectors. Then, we identify the best predictive model for the reasoner consisting of the following three dimensions: (1) a particular classifier leading to the best accuracy, (2) a particular metric subset, used for the classifier, and a specific feature selector that has found the subset, and (3) the prediction performance (accuracy) result achieved by the classifier with the metric subset. The discovered metric subset for each reasoner is designated as key metrics leading to its best predictive model. Furthermore, we measure the impact of individual metrics with respect to constructing predictive models for the 4 reasoners based on statistical analysis.
5
Data Collection
A total of 358 real-world, public-domain ontologies are collected for this work. No preprocessing (cleansing) is done. A large number of these ontologies are collected from the Tones Ontology Repository and NCBO BioPortal.4 These ontologies vary in file size, ranging from less than 4KB to almost 300MB. However, it is worth noting that file size is not a very good indicator of reasoning performance, as a small ontology (such as the DOLCE ontology) may owl:imports a large number of other ontologies, which make up the potentially very large 3 4
F-measure is measured and found to be completely positively correlated to accuracy. For brevity reasons, we only report our experimental results in accuracy. http://owl.cs.manchester.ac.uk/repository/, http://www.bioontology.org/
204
Y.-B. Kang, Y.-F. Li, and S. Krishnaswamy
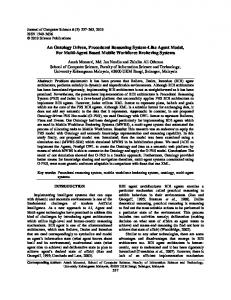
import closure that a reasoner considers. Note that all ontologies collected from BioPortal are large, with at least 10,000 terms. The expressivity of these ontologies ranges from OWL 2 EL and QL to OWL Full. At the same time, this collection also includes some well-known hard ontologies such as FMA, DOLCE, Galen, NCI Thesaurus and the Cell Cycle Ontology (CCO). The values of all metrics are calculated; and the distribution of 8 representative metrics are shown in Figure 1, where the metric values are plotted in log scale and ranked by the values. As can be seen quite clearly, the values for these metrics span a large range, from 0 to more than 105 , and to more than 107 for DIT . Moreover, as expected, the majority of ontologies have metric values in the middle of the range, with a few having values closer to the boundary. Classification time for all ontologies is also collected. All the experiments are performed on a high-performance server running OS Linux 2.6.18 and Java 1.6 on an Intel (R) Xeon X7560 CPU at 2.27GHz with a maximum of 40GB allocated to the 4 reasoner.5 OWLAPI version 3.2.4 is used to load ontologies and interface with the reasoners. The reasoners that are invoked are: FaCT++ 1.5.3, HermiT 1.3.5, Pellet 2.3.0 and TrOWL 0.8. REL is the underlying reasoner used by TrOWL. These metrics will be revisited in Section 7.
10
1
10
104
104
10
3
3
103
10
2
2
10
10
1
1
10
10
7
CID 104
2
10
1
10 DIT
COD
TIP
5
105
3
10
5
10
10
104
104
3
10
2
3
102
1
10
10
Ontologies
400
400
300
200
400
300
200
100
0
Ontologies
1
10
101
300
10
10
200
1
100
10
3
0
10
2
100
Metric value
5
10
10
Ontologies
400
2
104
300
10
CYC
5
10
200
3
NOC
5
10
100
104
SOV
5
0
Metric value
10
0
EF
5
10
Ontologies
Fig. 1. Distributions of values of 8 metrics
For each ontology and each reasoner, CPU time for classification is averaged over 10 independent runs and recorded. Loading and pairwise subsumption test time is are not included. Trivially simple ontologies (with reasoning time ≤ 0.01s) are later excluded from the experiment to reduce the skewness of the dataset. Some hard ontologies take an extremely long time to classify. Hence, we apply a 5
To accommodate large ontologies and potential memory leaks in reasoners (due to repeated invocations).
Predicting Reasoning Performance Using Ontology Metrics
205
Reasoning time (s)
Reasoning time (s)
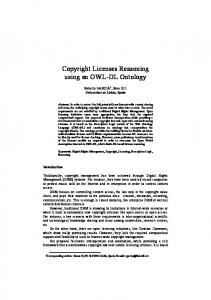
50,000-second cutoff for all the reasoners. The distribution of the raw reasoning time for the four reasoners can be found in Figure 2, where classification time (in log scale) is ordered and plotted against the ontologies. It can be observed that FaCT++, HermiT and Pellet all have some ontologies reaching the cut-off time, while TrOWL successfully classifies all ontologies.6 It can also be seen that for relatively easy ontologies (≤ 10s), FaCT++ and TrOWL seem to dominate the other 2 reasoners. Compared to performance data reported in [4], the performance on the same ontologies (GO and NCI Thesaurus) seems to be much worse in our experiments, running the same reasoners. Upon closer inspection we notice that the versions of the “same” ontologies are different – we are using more recent versions (current as of November 2011) of these ontologies, which are much larger than those versions used in [4].
10
HermiT
FaCT++
4
102 100 10
-2
10
4
10
2
Pellet
TrOWL
100 10
-2
0
50
100
150 200 Ontologies
250
300
0
50
100
150 200 Ontologies
250
300
350
Fig. 2. Raw classification time of the four reasoners
As stated in the previous section, discretization is a necessary first step before classifiers can be trained. After raw run time values are collected, they are discretized into 5 bins, where the bin ‘T’ contains the trivially simple ontologies (classification time ≤ 0.01s). The other 4 bins are of unit interval width. The interval width is used as the exponent of the reasoning time, i.e., 10i is the cutoff point between bin i and bin i + 1, 1 ≤ i ≤ 4. These 4 bins are labelled ‘A’, ‘B’, ‘C’ and ‘D’. A summary of the discretization and the number of ontologies for each reasoner in each bin is shown in Table 1. It can be seen in the table that each reasoner fails to perform classification on a number of ontologies due to parsing or processing errors or the ontology being inconsistent. It is worth pointing out that the server where the experiments are performed is very capable. Although 100 seconds is not a very long time, the same ontology will take much longer to run on a less powerful computer (mobile devices in particular). 6
We note again that this may be due to TrOWL’s incomplete reasoning approach.
206
Y.-B. Kang, Y.-F. Li, and S. Krishnaswamy
Table 1. Discretization of reasoning time and number of ontologies in each bin Discretized label Classification time Fact++ HermiT Pellet TrOWL T T ≤ 0.01s 161 77 138 188 A 0.01s < A ≤ 1s 75 154 126 105 B 1s < B ≤10s 16 35 38 17 C 10s < C ≤ 100s 6 12 12 13 D 100s < D 11 13 16 14 Total discretized 269 291 330 337 Ontologies in error 89 67 28 21
More analysis of the performance characteristics of the reasoners can be found in [11]. All the ontologies, their metric values and reasoning time can be found at http://www.csse.monash.edu/~yli/metrics_perf/.
6
Predictive Models
In this section, we present the first contribution of our work, the construction and analysis of predictive models for classification performance. Our analysis shows that consistently high accuracy (> 80%) is achieved for all of the 4 reasoners. Using 9 classifiers and 6 feature selectors, we learn predictive models as specified in Section 4. For each classifier, the 6 feature selectors are applied to find the best set of metrics. The set of metrics leading to the best accuracy for the classifier and the feature selector is then recorded. The accuracy values of the 9 classifiers are measured. More specifically, an accuracy value is measured for each classifier with 6 different collections of best metrics identified by each of the 6 feature selectors. Eventually, a single set of the best metrics for each (classifier, feature selector) pair is collected. Section 6.1 presents and analyzes the overall accuracy results of the 4 reasoners. Section 6.2 further characterizes the best predictive model and discusses the effect of feature selection. 6.1
Accuracy Distribution and Analysis
For the 4 reasoners, the accuracy distributions of the 9 classifiers (across the 6 feature selectors) are measured and presented in boxplots in Figure 3. Boxplots provide an excellent visual summary of a distribution through 5 statistical measures: minimum data value (MIN), lower quartile (Q1), median (Q2), upper quartile (Q3), maximum data value (MAX). Further, we enhance the boxplots by additionally showing the mean (AVG) of the accuracy data measured for a single classifier across the 6 feature selectors. A box itself contains the middle 50% of the accuracy data measured by a classifier with the 6 feature selectors; the upper box area (in blue) denotes the 50th−75th percentile (Q2−Q3) of the data, and the lower box area (in yellow) denotes the 25th−50th percentile (Q1−Q2). The remaining 50% of the data is contained within the areas between the box and the vertical lines or “whiskers”.
Predicting Reasoning Performance Using Ontology Metrics
FaCT++'s Performance
207
HermiT's Performance 92.00
84.26 83.33
Accuracy (%)
82.00 80.25
80.00
79.63
78.00
79.94
89.25 81.48
79.63
77.93
77.62
79.32 77.78 75.93
76.08
76.00
90.19 89.17
90.00
82.41 82.10
81.48
Accuracy (%)
84.00
88.00
87.38
86.00 84.00
86.84 85.51 84.74
84.11 83.49
83.65
84.03 82.71 82.24
82.71
82.32
82.00
75.15
87.38
85.98
81.15
74.00
80.00
72.00
78.00
BN
NB
SL
IBk
K* DT Classifiers
RT
RF
J48
BN
NB
SL
IBk
K* DT Classifiers
RT
RF
TrOWL's Performance
Pellet's Performance 92.00
85.00
91.28 90.38
84.38
82.29 81.76
82.25
81.00
79.00
80.73 80.30
80.40
80.21 79.00
90.00
83.33 82.61
82.81
89.26
80.21 79.69 78.98
78.77
78.65 78.32
77.00
Accuracy (%)
83.00
Accuracy (%)
J48
89.26
88.14
88.00
87.92
87.92 86.58
86.35
86.00
88.59 88.14
90.60 88.37
87.92 86.69
86.47
84.00 82.55
82.00
81.10 80.00
75.00
BN
NB
SL
IBk
K* DT Classifiers
RT
RF
J48
BN
NB
SL
IBk
K* DT Classifiers
RT
RF
J48
Fig. 3. Boxplots displaying the accuracy distribution for the 4 reasoners
The ends of the whiskers indicate the minimum and maximum accuracy values. The line inside the box indicates the median value of the accuracy data. The mean of the accuracy is represented by a red circle in the box. Among the above 6 statistical measures, the values of 2 measures, maximum (MAX) and mean (AVG) accuracy, are shown in the plot. A number of important observations can be made from Figure 3. – RF (RandomForest) is the most stable predictive model. For all the 4 reasoners’ performance, RF has the smallest difference of 1.42 between MIN and MAX, while BN has the largest of 4.57. This indicates that RF leads to the most reliable and stable accuracy results, while BN leads to the most variable accuracy results. – Ontology metrics entail good predictive models. The range of the MAX accuracy for the 4 reasoners is from 84.26 (by BN for FaCT++) to 91.28 (by RF for TrOWL). This indicates that particular subsets of ontology metrics, identified by different feature selectors, can be effectively leveraged for building good predictive models for classification reasoning performance of the reasoners. – RF is the best classifier leading to the best predictive models for the 4 reasoners. We examine which classifiers lead to the best predictive models for the 4 reasoners through statistical analysis of central tendency (e.g. mean) of the measured quantitative values. We compute the mean of the 6 quantitative values shown in Figure 3 across the 4 reasoners. The results are presented in Table 2. The best result in the mean values for each criterion is denoted in boldface. Table 2 clearly shows that RF leads to the best predictive models for all the 4 reasoners for all the 6 measures. In the following section, we describe these models in more detail.
208
Y.-B. Kang, Y.-F. Li, and S. Krishnaswamy
Table 2. The mean quantitative values of the 9 classifiers across the 4 reasoners Classifier BN NB SL IBk K* DT RT RF J48
6.2
MIN 81.38 79.85 82.98 82.54 82.31 82.50 81.27 85.85 82.09
Q1 82.89 79.94 83.54 82.88 83.70 83.04 82.40 85.97 82.90
6 Statistical Measures Q2 AVG Q3 83.41 83.94 84.74 80.23 80.79 82.68 84.12 84.17 85.11 83.11 83.51 85.00 84.16 84.72 86.15 83.19 83.51 84.40 82.91 83.43 83.80 86.41 86.68 87.30 83.34 83.53 84.63
MAX 82.30 80.66 83.47 82.09 82.83 82.78 80.75 86.03 82.66
Best Predictive Models
As each reasoner employs a different set of algorithms and optimization techniques, they may exhibit significantly different performance on the same ontology. As a result, the performance of classifiers may be different for the 4 reasoners as well. In this subsection, we further analyze the best classifiers and feature selectors to understand the reasoner-specific behaviours. As discussed in the previous subsection, RandomForest (RF) is the overall best classifier. This may in part be due to the nature of RF – that it is an ensemble classifier that consists of many decision trees. Figure 4 shows, for RF and each reasoner, the MAX classification accuracy (%) for each feature selector, and also their average. The numeric label on top of each bar denotes the number of metrics identified by the corresponding feature selector.
Accuracy measured by RF(RandomForest)
Accuracy racy (%) (%
90
15 21
23 23 20 15
85 19
13
12
13
22
21 22 22
21 24
17
17 21
18 4
23
18 25
80
75 GainRatio InfoGain SVM ReliefF Symm ChiSquared Mean
FaCT++ (RF) 81.48 82.41 81.48 82.41 82.41 82.41 82.10
HermiT (RF) 88.79 88.32 89.72 90.19 89.25 88.79 89.17
Pellet (RF) 83.33 81.77 82.81 81.77 82.81 82.29 82.47
Fig. 4. Best predictive models for the 4 reasoners
TrOWL (RF) 89.93 90.60 90.60 89.93 91.28 89.93 90.38
Predicting Reasoning Performance Using Ontology Metrics
209
RF achieves consistently high accuracy, all higher than 80% for each reasoner with an overall average of 86.03%. For TrOWL, RF achieves 90.38% accuracy on average. It suggests that RF can be effectively used in predicting classification reasoning performance. It also reinforces our belief that ontology metrics can be effective in learning predictive models for the reasoning performance. Moreover, it also opens up the potential to apply our approach to predicting reasoning performance of other reasoners. It can be observed that each best accuracy result comes with a different number of ontology metrics. The numbers vary from 4 (ReliefF for Pellet) to 25 (ChiSquared for FaCT++). Note that not once is the entire set of 27 metrics chosen by any feature selector. This finding establishes the validity of our hypothesis, presented in Section 4, that feature selectors can be leveraged to discover more significant metrics that impact on building more strong predictive models for classification reasoning performance.
7
Key Metrics Identification
In this section, we present the second main contribution of this work, the identification of important metrics that have a strong impact on classification performance. Such knowledge can contribute the task of ontology engineering and maintenance. This identification is achieved through a rigorous quantification of impact factors of all 27 ontology metrics used in the classifiers constructed in the previous section. As discussed in the previous section (Table 2), all of the 9 classifiers achieve mean accuracy of at least 80% for all the 4 reasoners. Such high accuracy makes the case for investigating the metrics used by all the classifiers and feature selectors. Two factors influence the significance of a given metric: (1) how frequently it gets selected to be used in the classifiers, and (2) how much it contributes to prediction of reasoning performance. In other words, the more frequently a metric is used in the predictive models (as chosen by the feature selectors), and the more weight it has in the classifiers that use it, the more it influences ontology classification performance. Hence, we combine these two factors to calculate the impact factor of all the metrics. Let metrics be denoted mi , 1 ≤ i ≤ 27, classifiers be denoted by cj , 1 ≤ j ≤ 9, feature selectors be denoted fk , 1 ≤ k ≤ 6, and reasoners be denoted rl , 1 ≤ l ≤ 4. We denote with f sj,k,l the set of metrics selected for each classifier cj by feature selector fk for reasoner rl . We further denote with #f sj,l|i the total number of occurrences of metric mi in all metric sets identified by the feature selectors for classifier cj and reasoner rl (0 ≤ #f sj,l|i ≤ 6). j,l Similarly, let ri,k denote the weight of the metric mi assigned by feature j,l selector fk for the pair (cj , rl ) (ri,k = 0 if mi is not selected), normalized by j,l ) so that it is between [0, 1]. We average over all the feature selectors max(r∗,k �6
r j,l
l to obtain the average ranked weight ri,j = k=16 i,k of mi . Algorithm 1 describes the calculation of the impact factor for all the metrics.
210
1 2 3 4
5 6 7 8 9 10
11 12 13
Y.-B. Kang, Y.-F. Li, and S. Krishnaswamy Input: Metric number of occurrences f (i, j, k, l) Input: Metric weight r(i, j, k, l) Output: Impact factor for each metric mif i , 1 ≤ i ≤ 27 foreach reasoner rl do Initialize 27 × 9 matrices mf tl , mf l , r l , nmf l mf tli,j ← #f sj,l|i /* Metric frequency per classifier l mf t i,j l mfi,j ← �27 /* Normalization l i=1 mf ti,j �6 j,l k=1 ri,k l ri,j ← /* Average ranked weight 6 mf l ← mf l ◦ r l /* Combining frequency with weight l nmfi,j ← a + (1 − a) ×
l mfi,j l max(mf∗,j )
*/ */
*/ */
/* Max frequency normalization */
end Initialize 27 × 9 matrix nmf for each (mi , cj ), 27 × 1 vector mif for each mi �4 l l=1 nmf nmf ← /* Average over the reasoners */ 4 �9 j=1 nmfi,j /* Average over the classifiers */ mif i ← 9 mif i mif i ← /* Normalization over max */ max(mif) return mif
Algorithm 1: The calculation of the impact factor of metrics For each reasoner (lines 1-8), the combined scores taking into account number of occurrences and weight for each metric are calculated. On line 3, we calculate the total number of occurrences of each metric for each classifier in a 27×9 matrix mf tl (metric frequency table). For example, if a metric ‘SOV’ (denoted m2 ) is in the sets of metrics selected by 4 out of the 6 feature selectors for the classifier RF (denoted c1 ) and reasoner Pellet (denoted r3 ), then mf t32,1 = 4. Each mf tli,j value is then normalized by dividing by the total number of occurrences of all metrics for classifier cj on line 4. l by averaging over From the raw weight r(i, j, k, l), we obtain the weight ri,j all the 6 feature selectors on line 5. Line 6 then combines the frequency and the averaged weight of each metric by taking the entrywise product of matrices mf l and rl . Note that one problem of the measure mf l as calculated on line 6 is that the difference of impact factors between higher and lower frequency metrics tend to be too large. For example, it seems unlikely that 6 occurrences of a metric with a ranked scored rl in the collection of a classifier in mf tl truly carry 6 times the significance of a single occurrence with the same or similar ranked score rl . To avoid this problem, we apply a normalization technique similar to maximum term frequency normalization [14] to mf l on line 7 to obtain the normalized impact
Predicting Reasoning Performance Using Ontology Metrics
211
factor values for each (metric, classifier) pair for each reasoner. Parameter a is a value between 0 and 1 and is generally set to 0.4 [14]. It is a smoothing term whose role is to dampen the contribution of l mfi,j
l mfi,j l ). max(mf∗,j
In this step we also scale
by the largest frequency values of all metrics in the collection for a down classifier cj . Eventually, the impact factor values are averaged over all 4 reasoners and all 9 classifiers to obtain the final impact factor values of the metrics (lines 10-11). The metrics can be grouped into a number of categories according to the quartiles their mif values fall into: Strong Impact (SI, 0.75 < mif ≤ 1), Normal Impact (NI, 0.5 < mif ≤ 0.75), Weak Impact (WI, 0.25 < mif ≤ 0.5), and Very Weak Impact (VI, 0 ≤ mif ≤ 0.25). The ranking and categorization results are shown in Figure 5. 1 SI
Impact factor
0.9 0.8
NI
0.7
WI
0.6
VI
0.5 0.4 0.3 0.2 0.1
SYM
ENR
MXCAR
TRN
IFUN
ENUM
CAR
DISJ
DTP
EOG
NEG
OBP
MNCAR
FUN
CONJ
INV
UF
EQV
RCH
TIP
COD
DIT
CID
CYC
NOC
EF
SOV
0
Metrics
Fig. 5. Normalized impact factors of all the ontology metrics
The 11 metrics in SI, NI and WI are all commonly used in the best predictive models presented in Figure 4. Except in one case, all metric sets selected by feature selectors for RF (in Figure 4) are a superset of the 11 metrics in SI, NI and WI in Figure 5. The exception is the set of metrics selected by ReliefF for TrOWL, where there are only 4 metrics. In this case, however, the 4 metrics also belong to these 3 categories. It can be concluded that these 11 metrics form a core group of metrics that are important for predicting classification performance. Furthermore, it can be observed in Figure 5 that a group of 8 metrics (SI and NI) have high impact on reasoning performance, and that there is a clear separation of mif scores between these two groups of metrics and the rest of the metrics. Specifically, it can be clearly seen that (1) the number of existential quantification restrictions (EF ), (2) the size of an ontology (SOV ), (3) the number of independent paths (CY C), (4) the characteristics of named classes (the 4 CLS metrics) and (5) the non-treelike-ness of the inheritance graph (T IP ) have a strong impact on prediction performance.
212
Y.-B. Kang, Y.-F. Li, and S. Krishnaswamy
As mentioned previously, the impact factor indicates a metric’s relative influence on (the prediction of) classification performance. The 8 metrics identified above can hence be used to guide ontology engineering. For example, reducing the size of the ontology (SOV ), reducing the number of independent paths (CY C), reducing the degree of classes (CID and COD) and making the inheritance graph more tree-like (T IP ) may significantly improve reasoning performance of the ontology.
8
Conclusion
Terminological reasoning has been shown to be a computationally expensive problem, especially for expressive languages such as OWL DL and OWL 2 DL. Despite tremendous progress in the past decade in the design and development of highly optimized algorithms and reasoners, ontology classification is still a very challenging task, as demonstrated by previous benchmarking works and our own experiments. It is therefore highly desirable to be able to quantitatively analyze and predict reasoning performance using syntactic features. Metrics have been successfully used to capture different aspects of the syntactic/structural characteristics of various kinds of artefacts (software, combinatorial problems, etc.), including their complexity and empirical hardness. In this paper we propose, develop and evaluate the use of ontology metrics as an effective basis for predict reasoning time for the task of ontology classification. To the best of our knowledge, this is the first such study to apply machine learning techniques (classification) to predict reasoning time for ontologies. Our contributions in this paper are three-fold: (1) the development of highly effective (over 80% accuracy) predictive models to estimate the reasoning time for an ontology given its metric values, for four widely-used OWL 2 DL reasoners, (2) the identification of a set of 8 metrics that have the most impact/correlation with reasoning performance, and (3) a rigorous empirical validation of the proposed methodology with a set of over 350 real-world ontologies, the largest study so far in terms of the size of the dataset. A number of future directions are planned for this work. We will further study the statistical significance of our predictive models and key metrics. Other metrics, such as language profile and number of (hidden) GCIs, will be investigated to evaluate their effectiveness in reasoning time prediction. The effect of optimisation techniques on reasoning performance will also be investigated. We also plan to investigate other reasoning tasks (consistency checking) and other machine learning techniques (regression analysis). The degree of incompleteness of TrOWL will also be studied to quantify its impact on prediction accuracy. Lastly, we will study the feasibility of generating synthetic ontologies with specified reasoning performance with metric values as parameters. Such ontologies will be very valuable in the analysis and optimization of reasoning algorithms.
Predicting Reasoning Performance Using Ontology Metrics
213
References 1. Baader, F., Brandt, S., Lutz, C.: Pushing the E L envelope further. In: Clark, K., Patel-Schneider, P.F. (eds.) Proceedings of the OWLED 2008 DC Workshop on OWL: Experiences and Directions (2008) 2. Baader, F., Sattler, U.: An overview of tableau algorithms for description logics. Studia Logica 69(1), 5–40 (2001) 3. Bock, J., Haase, P., Ji, Q., Volz, R.: Benchmarking OWL reasoners. In: ARea2008 - Workshop on Advancing Reasoning on the Web: Scalability and Commonsense (June 2008) 4. Dentler, K., Cornet, R., ten Teije, A., de Keizer, N.: Comparison of reasoners for large ontologies in the OWL 2 EL profile. Semantic Web Journal 2(2), 71–87 (2011) 5. Garc´ıa, J., Garc´ıa, F., Ther´ on, R.: Defining Coupling Metrics among Classes in an OWL Ontology. In: Garc´ıa-Pedrajas, N., Herrera, F., Fyfe, C., Ben´ıtez, J.M., Ali, M. (eds.) IEA/AIE 2010, Part II. LNCS, vol. 6097, pp. 12–17. Springer, Heidelberg (2010) 6. Gardiner, T., Horrocks, I., Tsarkov, D.: Automated benchmarking of description logic reasoners. In: Proceedings of the 2006 International Workshop on Description Logics (DL 2006) (2006) 7. Grau, B.C., Horrocks, I., Motik, B., Parsia, B., Patel-Schneider, P., Sattler, U.: OWL 2: The next step for OWL. Journal of Web Semantics: Science, Services and Agents on the World Wide Web 6, 309–322 (2008) 8. Heinsohn, J., Kudenko, D., Nebel, B., Profitlich, H.-J.: An empirical analysis of terminological representation systems. In: Proceedings of the Tenth National Conference on Artificial Intelligence, AAAI 1992, pp. 767–773. AAAI Press (1992) 9. Horrocks, I., Patel-Schneider, P.F.: DL systems comparison (summary relation). In: Proceedings of the 1998 International Workshop on Description Logics (DL 1998). CEUR Workshop Proceedings, vol. 11. CEUR-WS.org (1998) 10. Horrocks, I., Patel-Schneider, P.F., van Harmelen, F.: From SHIQ and RDF to OWL: The Making of a Web Ontology Language. Journal of Web Semantics 1(1), 7–26 (2003) 11. Kang, Y.-B., Li, Y.-F., Krishnaswamy, S.: A rigorous characterization of reasoning performance – a tale of four reasoners. In: Proceedings of the 1st International Workshop on OWL Reasoner Evaluation (ORE 2012) (June 2012) 12. Pan, Z.: Benchmarking DL reasoners using realistic ontologies. In: Grau, B.C., Horrocks, I., Parsia, B., Patel-Schneider, P.F. (eds.) OWLED. CEUR Workshop Proceedings, vol. 188. CEUR-WS.org (2005) 13. Ren, Y., Pan, J.Z., Zhao, Y.: Soundness preserving approximation for tbox reasoning. In: Fox, M., Poole, D. (eds.) AAAI. AAAI Press (2010) 14. Salton, G., Buckley, C.: Term-weighting approaches in automatic text retrieval. Information Processing and Management: an International Journal 24(5), 513–523 (1988) 15. Shearer, R., Motik, B., Horrocks, I.: HermiT: A Highly-Efficient OWL Reasoner. In: Proceedings of the 5th International Workshop on OWL: Experiences and Directions, OWLED 2008 (2008) 16. Sirin, E., Parsia, B., Grau, B., Kalyanpur, A., Katz, Y.: Pellet: A practical OWLDL reasoner. Web Semantics: Science, Services and Agents on the World Wide Web 5(2), 51–53 (2007) 17. Tempich, C., Volz, R.: Towards a benchmark for semantic web reasoners - an ´ (eds.) EON. CEUR analysis of the DAML ontology library. In: Sure, Y., Corcho, O. Workshop Proceedings, vol. 87. CEUR-WS.org (2003)
214
Y.-B. Kang, Y.-F. Li, and S. Krishnaswamy
18. Thomas, E., Pan, J.Z., Ren, Y.: TrOWL: Tractable OWL 2 Reasoning Infrastructure. In: Aroyo, L., Antoniou, G., Hyv¨ onen, E., ten Teije, A., Stuckenschmidt, H., Cabral, L., Tudorache, T. (eds.) ESWC 2010, Part II. LNCS, vol. 6089, pp. 431–435. Springer, Heidelberg (2010) 19. Tsarkov, D., Horrocks, I.: FaCT++ Description Logic Reasoner: System Description. In: Furbach, U., Shankar, N. (eds.) IJCAR 2006. LNCS (LNAI), vol. 4130, pp. 292–297. Springer, Heidelberg (2006) 20. Wang, T.D., Parsia, B.: Ontology Performance Profiling and Model Examination: First Steps. In: Aberer, K., Choi, K.-S., Noy, N., Allemang, D., Lee, K.-I., Nixon, L.J.B., Golbeck, J., Mika, P., Maynard, D., Mizoguchi, R., Schreiber, G., Cudr´eMauroux, P. (eds.) ISWC/ASWC 2007. LNCS, vol. 4825, pp. 595–608. Springer, Heidelberg (2007) 21. Witten, I.H., Frank, E.: Data mining: Practical machine learning tools and techniques with Java implementations. Morgan Kaufmann, San Francisco (2000) 22. Yang, Z., Zhang, D., Ye, C.: Evaluation metrics for ontology complexity and evolution analysis. In: IEEE International Conference on E-Business Engineering, pp. 162–170 (2006) 23. Zhang, D., Ye, C., Yang, Z.: An Evaluation Method for Ontology Complexity Analysis in Ontology Evolution. In: Staab, S., Svatek, V. (eds.) EKAW 2006. LNCS (LNAI), vol. 4248, pp. 214–221. Springer, Heidelberg (2006) 24. Zhang, H., Li, Y.-F., Tan, H.B.K.: Measuring Design Complexity of Semantic Web Ontologies. Journal of Systems and Software 83(5), 803–814 (2010)