SAS 2009 – IEEE Sensors Applications Symposium New Orleans, LA, USA - February 17-19, 2009
LOAD BALANCED CLUSTERING ALGORITHM FOR ENERGY EFFICIENT HOME AREA NETWORKING Saad A. Khan, Fahad A. Khan, Arslan Shahid, Zubair A. Khan Department Of Electrical Engineering, University of Engineering & Technology, Lahore Pakistan Email:
[email protected],
[email protected],
[email protected] Abstract— Advancement and refinement of technology has resulted in widespread deployment of sensor networks in various facets of human life. Body and home area networks are an embodiment of their steady infiltration in our daily lives. Inherent energy issues with the sensor network technology paradigm have brought an emphasis towards the energy efficiency issue, thereby, propelling researchers to focus on developing topologies with minimal energy consumption constraints. Our work revolves around home area networking in which we have explored a self-organizing clustered topology with a low latency periodic and query-based data collection solution and have proved our proposition to have a significant reduction in terms of energy expenditures. Index Terms— Wireless Sensor Networks, Home automation, Clustering algorithm.
R
I. INTRODUCTION
ESEARCH in wireless sensor network technology has helped in the development of small sensor nodes, which have multitasking sensing and data manipulation capabilities. As the node size has scaled to diminutive level, their power management issues have been increased in a challenging. Nowadays, mostly the sensors operate on battery, which has a limited source of energy . In addition, nodes are deployed in such a manner that at times it becomes difficult to replace batteries constantly, so longevity of network is a desired prospect. Various applications of wireless sensor network can be found which encompass a wide range of civil applications e.g. health monitoring, home and office applications [1]. The home automation provides mutual interoperability between various devices as well as it provides a graphical user interface for people to control their applications [2]. Some of the technologies that have been used till now are: INSTEON, X10 [3][4], PLC BUS [5], Universal Powerline Bus (UPB), KNX (standard) [6], LonWorks [7], UPnP [7], Wi-Fi, ZigBee and ZWave. Integrating Personal Digital Assistant (PDA's) or Smartphone etc is much easier using wireless networks in
9781-4244-2787-1/09/$25.00 ©2009 IEEE
home automation systems. One needs not to find the exact location or a device, as long as it is in the vicinity of network [8]. Using algorithms for finding efficient routing paths in home area networking takes in account many complications such as heavy and complex computations for the sustainment and management of good routing paths, which gives a perception of heavy energy consumption. Moreover, transmission cost of data is much and it is expedient to use clustering algorithms [9] [10] [11]. Penetrating into the clustered sensor network properties, we see that it is more suitable for home automation networking. Using cluster head eliminates a large amount of redundant data in such a way that only aggregated data is sent to the sink. We present an algorithm for home automation which is based on data centric approach. In this algorithm the data is aggregated to the base station (database center) through different cluster heads. The house is partitioned in areas i.e. sectors and cluster head are formed which gather the data from all the nodes according to query. The aggregated data is send to the base-station or to other cluster-head nodes to route to base-station. Load balancing is also handled to switch clusterhead and reduce the energy consumption to increase the lifetime of the deployed network. The rest of the paper is machinated as follows. Section II gives a highlight of the related work. Section III introduces the system architecture. The load balanced clustering algorithm is explained in Section IV. The query handling in home area networking is discussed in Section V. Section VI gives the simulations and results. In the end, we conclude in Section VII. II. RELATED WORK In paper [12], a routing scheme had been proposed named as RDSR (Relative Direction based Sensor Routing). In this paper, the home area is divided into different sectors and manager nodes are selected. Then using (x,y) co-ordinates, the shortest path to sink is found. A hybrid sensor network system has been proposed by Song, Wei and Zhang [13]. The architecture is divided into 3-layers and provides internet
access. Heterogeneous mobile node has been designed which is capable of simple planar motions. Sung-Hwa, Kim and Eom proposed a base-station centric data gathering routing protocol [14]. The relay nodes collect the data from other nodes and route it the base-station. Only those relay nodes can be involved which have greater amount of energy than other nodes in vicinity. A Minimum Hop Routing Protocol [15] was suggested by Chiang, Huang and Chang . It is an adaptive routing protocol in which paths can be decided if some nodes fail or energy is completely depleted from them. A routing table is maintained in each node in network which contains the parent, siblings, and child nodes. Flooding initiated the start of network, where a special packet helps in formation of table. The energy efficient selection of next-hop node is based on routing table.
The data is gathered according to query or different set of queries from the base-station. Data is aggregated at clusterhead and send to other cluster-heads till it reaches the basestation. The sensor query can be referred to as one of the two states in which a sensor might be in. One state is the soft-state in which periodic transmission of data is done after pre-defined intervals. The other state is the hard-state in which on-demand transmission of data is done. Such queries for state are generated from the main control. In our architecture the flow of the sensor data is from the sensor node to its respective cluster head, and then the required data is routed via the cluster heads to the sink i.e. the database server. The communication between the server and the cluster is two-way communication. IV. LOAD BALANCED CLUSTERING ALGORITHM
III. SYSTEM DESCRIPTION Our system model contains a base station, sensor nodes which are heterogeneous in nature. The nodes are scattered in a nondeterministic manner. Each sensor node being deployed has a capability of sensing data as well as can perform as a clusterhead for accumulating and routing data to the base-station. The base-station is the main access point from where queries are generated and data is gathered. It has more computational power and memory i.e. we have considered in to be a personal computer. We have assumed the sensor-nodes being deployed are able to operate in both modes i.e. the active mode as well as standby (sleeping mode). The sensor node that can exist within a home area network can be of one of the following modes. Sensing mode This mode is active when a query is generated from the basestation to sense the surrounding environment of a particular area and generate data accordingly. Data aggregation mode This mode is activated when the node is acting as a clusterhead and is used for data aggregation purposes. Inactive mode (Sleep mode) The node exhibits this mode, when it needs not to sense any environmental information and can be turn off its sensing and go in sleeping mode, to conserve energy. In the initialization process, network broadcast packets are sent from each nodes to determine the distance between nodes and the base-station. In next step, cluster-heads are formed which have minimal distance and have the maximum connectivity among the nodes in vicinity. It is made sure that each node is connected to a particular cluster-head, so that no node is left orphan. Cluster head can be rotated within different nodes based on the energy-level. To avoid the energy drainage problem of cluster head, the cluster head is periodically rotated between other nodes. Cluster head formation is also reinitiated when the cluster head is not reachable to other nodes i.e. a situation in which it dies out. If there is less energy left in a node than a certain threshold level, it doesn't participate in next round of cluster-head generation.
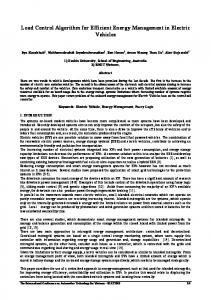
The algorithm is divided into different phases. In the first phase the network is initialized and cluster heads are decided.
Figure 1. Initial Phase of network formation
Initial Phase In the initial phase of the algorithm, each sensor node 'j' represents a cluster-head itself. The probability 'Wj(t)'of node to elect itself as a cluster head, in a network of 'Y' nodes, is given by ( ) x xq (1) Wj(t) = ∑ ( ) ( )) ( where Ej(t) is the remaining energy in node j, the number of neighbor in fixed radius transmission is given by 'n' and 'q' refers to the expected number of clusters [19]. A particular node 'j' elects itself as a cluster head only if Wj(t) is between (0, 1). Node Solicitation Phase After the initial phase, the elected cluster-head broadcasts association announcement for other node to join. This broadcast message is acknowledged by other nodes and they join nearest cluster-head. This association phase is given by (2) Yj €║Yj - CHi║ < ║Yj – CHX║ where j = 1 to N, x i and x = 1 to K
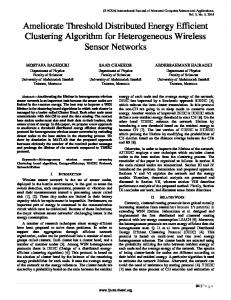
The phase is repeated until cluster links with each node is proximity is established. The left-over nodes which haven’t joined any cluster become cluster head themselves. Cluster Merging and Splitting The election of initial cluster is based upon probabilistic decision, so there would be uneven clusters within the network. If the number of members within a cluster would be less than a certain threshold limit, then the cluster should merge with a nearby cluster, and if a cluster has member count more than the upper limit then it should split and get merged with other clusters. In the merge phase the members would try to associate themselves with a cluster-head which is second nearest to their cluster-head, if successful, they’ll add themselves to their new cluster-head. Else they would retain their previous cluster membership. Re-election of cluster head After the formation of cluster, cost for each the member within cluster would be calculated by the initially elected clusterhead. The cost distance calculated between a member j and other nodes is given by Sj = ∑Ni=1║Yj - Yi║
(3)
Next, the cost distance is calculated between each member node and the sink i.e. base-station Dj = ∑Ni=1║Yj - BS║
(4)
The cluster head is re-elected on basis of having minimum intra-cluster cost and minimum distance to the base-station. CHj = min 1≤ j d (Sj, Dj)
(5)
Figure 2. Clustered Home Area Network
V. QUERY HANDLING A. Query Manipulation In our architecture the queries are handled in the following ways: Pre-defined queries for periodic data A pre-defined set of query is sent to each particular node (broadcast) or to a set of nodes (multicast). The queries might vary from a single query (e.g. data from a particular node) to a set of queries (e.g. data from a room or number of rooms). In such type of query, the data is send periodically to the sink via the cluster-heads. The format for such query is: typecast query //pre-defined or on-demand information // data to the gathered location // the area from where data is to be collected time //time-interval for predefined query
Reassignment of nodes in within cluster head After the formation of the clusters, there is still some space for minor adjustments that can count towards minimum energy consumption. A sensor node that is already a part of a cluster can join another cluster, keeping in view the constraint that the node shouldn’t be a cluster-head itself i.e. a sensor node which is not acting as a cluster-head might join another cluster. The node can only assign itself with a new cluster head if it obeys the rule of shortest path to the main head node (co-ordinator). In other words, node reassignment might only be done if joining with the other cluster head gives a shortest path via cluster head’s to the database center.
On-demand query for data A user can send any query, which can act as an on-demand query. This on-demand query can also be in a broadcast manner or multicast. In such query, an on-demand reading e.g. temperature reading at the very instant can be generated and satisfied. The format for such query is: typecast query //pre-defined or on-demand information // data to the gathered location // the area from where data is to be collected
Formation for new cluster head A new cluster head is formed if energy is depleted from a cluster head that has been participating actively in the routing process and it can't participate any further as a cluster head in network. Due to this a cluster head cannot resume its activity of routing and hence needs to get replaced by another clusterhead. In such a case re-election of cluster head is again repeated for cluster-head assignment, without taking in consideration the energy exhausted cluster-head.
B. Query Patterning In home area networking, different kind of queries might be generated. Using flat topology for handling such queries consume more energy. In routing schemes, the intermediate nodes might be involved in data aggregation [16]. For example, in figure 3, shown on next page, different sensor nodes are installed in the hall-way i.e. temperature sensors (T), light sensors, humidity sensors (H), smoke sensors. Now all the nodes don’t satisfy a particular query e.g. query for
temperature reading is only satisfied by temperature sensing nodes. If such information from each temperature sensing node is routed to the sink, some intermediate nodes would also be involved in data aggregation, which implies the energy cost at no expense.
Sink (Base Station)
H
T
H
H
H
T
H
T
H
H
H
T
T
H
T
Figure 4. Data Aggregation Through Cluster Heads For Tranmsission Of Data From Source Node to Base Station
Figure 3. Data Aggregation Using Intermediate Nodes For Transmission Of Data From Source Node to Base Station
In clustering methodology, only the cluster head (CH) needs to aggregate the data to the sink and results in more energyefficient network. As you can see in figure 4, that other nodes need not to be disturbed and they can maintain the sleep mode. Only temperature nodes would send the data to the cluster head, from where data would be aggregated through other cluster head’s to the sink node. The clustering via cluster head formation is shown in figure 4. VI. SIMULATIONS & RESULTS To prove the worth of our proposed data centric approach using load balanced clustering algorithm (BCHAN) we ran simulations. The nodes were deployed in a non-deterministic manner i.e. the sensors are deployed in a random manner. Before the start of simulations, nodes were randomly given an amount of energy ranging from 1.75J to 2J. The total maximum size of the home area was considered to be 100m x 100m. Energy consumption parameters are based on the one that had been used by the LEACH [17]. The energy consumption model being used for simulations is shown in figure 5. In LEACH, if a message of n-bits had to be transferred to a node at distance 'r', then the radio module had to consume a energy equal to PTx, where PTx (n, r) = PTx-e (n) + PTx-fs (n, r). When a data is to be received at node i.e. by the cluster head, the energy it has to expend is PRx-e (n) = PTx-e (n) = Pe x n. The per bit transmission and reception power of each node 'Ee' was taken as 50 nJ.
Figure 5. Energy Consumption Model
Different routing protocols for home area networking have been introduced [12, 13, 14, 15]. These protocols have been designed to transmit the data those intermediate nodes to the base-station. For our comparison we consider the Least Energy Consumption Protocol (LECP), in which data is routed through different nodes via the minimum path between the base-station 'bs' and the source node 's' . In LECP, the data can only be routed through a path having intermediate node 'b, if it obeys the following condition. (6) PTx (n, r)|s-bs > PTx (n, r)|s-b + PTx (n, r)|b-bs Figure 6 represents the network of 100 nodes that were deployed in a non-deterministic manner. The figure represents the working phase of network, after the clustering phase has been performed. The 'star' represents the base-station, those nodes who had the probability of becoming cluster-heads are shown by 'empty boxes' and those node who had been selected as cluster-heads are shown by 'shaded-boxes'. Figure 7 shows the total energy consumption in the network as the parameter of network area changes to a maximum of 100m x 100m and with change of electronics energy to maximum of 100nJ/bit. The graph shows that as the network is expanded i.e. on global scale, our proposed algorithm is much more energy efficient as compared to LECP. Using LECP in home area networking, it is clear the nodes in the vicinity of the base-station would quickly be depleted of their energy because all the routing would be done through
Y-Coordinate Axis (x 100 m)
X-Coordinate Axis(x 100m) Figure 6. Network deployment of 100 nodes after the clustering phase
LECP
BCHAN
died out more quickly in figure 8, and after same number of rounds our algorithm showed longer life-span of network. 1 0.9
Y-Coordinate Axis (x 100 m)
Total Energy Dissipated In System (J)
these nodes. As the nodes nearer to base-station die out, the nodes next-most nearer to base-station would require more energy to transmit data-packets to the base-station and hence would die out soon. The network longevity would hence decrease. For proving this point, we ran simulations for LECP and our proposed algorithm. .
0.8 0.7 0.6 0.5 0.4 0.3 0.2 0.1 0 0
0.1
0.2
0.3
0.4
0.5
0.6
0.7
0.8
X-Coordinate Axis( x100 m)
0.9
Figure 8. Number of nodes alive after 200 rounds using LECP x 10-7
Electronics Energy (Joules/bit)
Network Diameter (m)
Figure 7. Graph representing the total power consumption using LECP and BCHAN
The data packet size was considered to be 2000bit, which was to sent from each node to the base-station during each 'round'. The nodes were considered to be dead, i.e. won’t be taking further participation in the network if there left-over energy was less than 0.2J. Figure 8, shows the number of nodes alive (after 200 rounds) of transmission using LECP. The ‘circles’ represent the number of nodes left alive and the ‘dots’ represent the number of dead nodes. Figure 9 shows the number of nodes alive (after 200 rounds) using our algorithm. The results, as expected, show that nodes near to base station
Another important advantage of using balanced clustering algorithm for home area networking is the longevity of the network. As shown in figure 10, if a technique like LECP is used, the network dies out much sooner. It is due to the fact, the it isn’t a balanced algorithm and if a certain nodes die out near the base-station, the other nodes need to route data from farther distances. Hence, much more energy is consumed and nodes die out. Figure 10, clearly shows that a balanced clustering algorithm for home area networking would result in a better long lifetime for the network. Using LECP causes more energy consumption as the size of network is increased using constant Eelec = 50nJ/bit. The graph clearly shows that using our algorithm saves a great amount of energy as compared to LECP. As the network is expanded overall energy dissipation is more in the LECP network as compared to BCHAN network.
1
0.5
collection without latency. It selects appropriate cluster-head for optimal routing of data. We have proposed a load balanced clustering algorithm which focuses on efficient usage of battery power and its even utilization in the network. Our algorithm outperforms simple routing algorithms. At different time, the cluster head rotate which increase the network lifetime. Failure detection and recovery has not been addressed in this paper and future work can be extended on it.
0.4
References:
1 0.9
Y-Coordinate Axis
0.8 0.7 0.6
0.3 0.2 0.1 0
0
0.1
0.2
0.3
0.4
0.5
0.6
0.7
X-Coordinate Axis
0.8
0.9
1
Figure 9. Number of nodes alive after 200 rounds of BCHAN 100 90 BCHAN LECP
Total Number Of Nodes
80 70 60
50 40 30 20 10
0
0
200
400
600
800
1000
1200
1400
1600
1800
2000
Time (Rounds)
Total Energy consumption in network (J)
Figure 10. Comparison of network lifetime between LECP and BCHAN
0.9 0.8
BCHAN LCEP
0.7 0.6 0.5 0.4 0.3 0.2 0.1 0 0
10
20
30
40
50
60
70
80
90
100
Network Diameter (m)
Figure 11. Total Energy Consumption using LECP and BCHAN VII. CONCLUSION
We have discussed the importance of data-aggregation in home area networking using clustering. Our approach provides both periodic data collection and query-based data
[1] Ning Xu , A Survey of Sensor Network Applications, Computer Science Department University of Southern California [2] Michal Varchola, Miloš drutarovsky, "Zigbee Based Home Automation Wireless Sensor Networks", Acta Electrotechnica et Informatica No. 4, Vol. 7, 2007 [3] E. Mainardi, S. Banzi, M. Bonfè, S. Beghelli, A low-cost Home Automation System based on Power-Line Communication Links, 22nd International Symposium on Automation and Robotics in Construction ISARC 2005 - September 11-14, 2005, Ferrara (Italy) [4] Tarrini, L., Bandinelli, R. B., Miori, V., and Bertini, G. 2002. Remote Control of Home Automation Systems with Mobile Devices. In Proceedings of the 4th international Symposium on Mobile Human-Computer interaction (September 18 - 20, 2002). F. Paternò, Ed. Lecture Notes In Computer Science, vol. 2411. Springer-Verlag, London, 364-368. [5] Intark Han; Hong-Shik Park; Youn-Kwae Jeong; Kwang-Roh Park, "An integrated home server for communication, broadcast reception, and home automation," Consumer Electronics, IEEE Transactions on , vol.52, no.1, pp.104-109, Feb. 2006 [6] Manfred Mevenkamp, Michael Mayer, "Energy Efficiency in Educational Buildings using KNX/EIB", KONNEX Scientific Conference, Pisa, 09/2005 [7] YH Sheng, WW Lin, CS Tu, KM Lee, "Integrate LonWorks and UPnP devices by OSGi gateway and universal remote console", Advanced Communication Technology, 2006. ICACT 2006. [8] Reinisch, C.; Kastner, W.; Neugschwandtner, G.; Granzer, W., "Wireless Technologies in Home and Building Automation," Industrial Informatics, 2007 5th IEEE International Conference on , vol.1, no., pp.9398, 23-27 June 2007 [9] Kemal Akkaya, Mohamed Younis, "A survey on routing protocols for wireless sensor networks", Ad Hoc NetworksVolume 3, Issue 3, May 2005, Pages 325-349 [10] N. Narasimha Datta and K. Gopinath, “A survey of routing algorithms for wireless sensor networks”, Journal of the Indian Institute of Science, 2006 [11] J. N. Al-Karaki and A. E. Kamal, “Routing Techniques in Wireless Sensor Networks: A Survey”, IEEE Wireless Communications, 12/2004 [12] Hayoung Oh, Hyokyung Bahn, and Ki- Joon Chae, "An EenrgyEfficient Sensor Routing Scheme for Home Automation Networks", IEEE Transactions on Consumer Electronics, Vol. 51, No. 3, AUGUST 2005 [13] Guangming Song, Zhigang Wei, Wei Zhang, Aiguo Song, "A Hybrid Sensor Network System for Home Monitoring Applications", IEEE Transactions on Consumer Electronics, Vol. 53, No. 4, NOVEMBER 2007 [14] Sung-Hwa Hong; Byongguk Kim; Doo-Seop Eom, "A Base-station Centric Data Gathering Routing Protocol in Sensor Networks Useful in Home Automation Applications," Consumer Electronics, IEEE Transactions on , vol.53, no.3, pp.945-951, Aug. 2007 [15] Shao-Shan Chiang; Chih-Hung Huang; Kuang-Chiung Chang, "A Minimum Hop Routing Protocol for Home Security Systems Using Wireless Sensor Networks," Consumer Electronics, IEEE Transactions on , vol.53, no.4, pp.1483-1489, Nov. 2007 [16] Arati Manjeshwar, Dharma P. Agrawal, "APTEEN: A Hybrid Protocol for Efficient Routing and comprehensive Information Retrieval in Wireless Sensor Networks", Proceedings of the International Parallel and Distributed Processing Symposium (IPDP), IEEE Computer Society, 2002. Efficient Communication Proctocol for Wireless Microsensor Networks", Proceedings of the Hawaii International Conference on System Science, page 1-10, Jan, 2000. [17] W . R. Heinzelman, A. Chandrakasan, H. Balakrishhan, "EnergyEfficient Communication Proctocol for Wireless Microsensor Networks", Proceedings of the Hawaii International Conference on System Science, page 1-10, Jan, 2000.