Sep 8, 2006 - Load-Representative Temperature-Difference Method, a Third Generation Design-Assisting Tool. Khaled Mansy. Oklahoma State University ...
rd
PLEA2006 - The 23 Conference on Passive and Low Energy Architecture, Geneva, Switzerland, 6-8 September 2006
Load-Representative Temperature-Difference Method, a Third Generation Design-Assisting Tool Khaled Mansy Oklahoma State University, Stillwater, Oklahoma, USA ABSTRACT: This paper reports on a new bioclimatic design analytical tool, i.e., the LoadRepresentative Temperature-Difference (ΔTLR). This method is a quantitative method that accurately predicts the environmental performance of individual spaces based on their design, orientation, occupancy, and location. ΔTLR method uses simple algorithms to plot the Load-Representative Temperature (TLR) points on the Psychrometric Chart. The TLR is the imaginative outdoor temperature at which the transmitted thermal load is equal to all thermal loads (internal and external) at the actual ambient temperature. The Psychrometric Chart then can be used to give an accurate prediction of the environmental performance of a certain space based on its actual design and its own balance point and not only based on the ambient temperature. Consequently, the ΔTLR method should eventually replace the Annual Bioclimatic Envelope method that is currently used to select passive systems and strategies appropriate for buildings in a given climate. Keywords: climate, bio-climatic analysis, bio-climatic design, design strategies
1. INTRODUCTION In the field of bioclimatic design, design-assisting tools are seen as the essential vehicle that can help designers achieve their environment-conscious goals. Meaningful quantitative feedback on the whole building performance during early design phases, i.e., pre-design analysis, schematic design and design development, is the only way to guide the design of buildings towards energy efficiency through load reduction. Quantitative feedback on environmental performance is especially crucial in the form-finding phase and in the design of building envelope. The first generation of these bioclimatic design-assisting tools was developed as early as forty some years ago. The second generation of these design-assisting tools was primarily a re-working of the same firstgeneration but in a digital format [1]. However in the third-generation of design-assisting tools, a significant advancement is taking advantage of the computerage accuracy and the development of user-friendly tools that architects are able to use during the early design phases.
2. THE THIRD GENERATION OF DESIGN ASSISTING TOOLS Architectural design is a multi-disciplinary process. Creative thinking research found that architectural design takes the form of a loop of objective analysis, subjective synthesis, and objective evaluation, respectively [2]. It is a “creative sandwich”, with a central creative phase sandwiched between two objective phases of analysis and execution [3]. Based on the above-mentioned understanding of the design process and based on the current need for
advanced design-assisting tools, the author considered the following criteria as the basis for developing the Load-Representative TemperatureDifference method as a third generation designassisting tool [4]. a. A tool that can guide the form-finding phase as well as related design decisions early in the design process. b. Takes into account all essential factors that may affect the whole building’s annual environmental performance (energy consumption), i.e., climate, physical reality of the building, and occupancy type and schedule. c. A computer-based tool that takes the advantage of the power of computers to perform accurate calculations. d. An interactive tool that allows architects to try a variety of alternatives without spending long time on the analysis. e. Presents easy-to-understand quantitative results to architects who have moderate background on the subject. f. Presents results in graphical format in order to fit the need of architects who are visual learners.
3. WHY THE LOAD-REPRESENTATIVE TEMPERATURE-DIFFERNCE METHOD 3.1 A first generation tool In practice and in academia, a commonly-used analytical tool is the annual climate envelope, through which architects determine the appropriate passive systems and/or strategies for a building in a certain climate [5]. The annual climate envelope tool is considered a first-generation design assisting tool. The same tool is included in the commonly-used
rd
PLEA2006 - The 23 Conference on Passive and Low Energy Architecture, Geneva, Switzerland, 6-8 September 2006
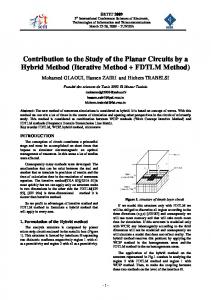
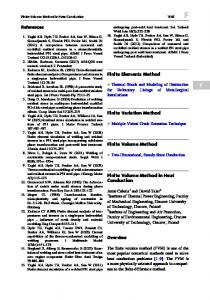
publication: The Architect’s Portable Handbook (Fig. 1) [6]. 3.2 A second generation tool A second-generation tool that is based on the annual climate envelope method is also presented in another commonly-used publication, which is the Time-Saver Standards for Architectural Design Data, 1997. This Time Saver Standards presents an example on how to utilise daily-range data of the ambient climate conditions to accurately analyse climate, then, define design strategies appropriate for buildings in this climate (Fig. 2) [7]. In this example, the computer-generated graphical representation of the ambient climate conditions (in a certain place during a certain period of time) is imposed on the psychrometric chart, which results in defining the percentage need for different passive and low-energy strategies during the analysed period of time.
refers to a similar chart as the means by which “the designer can construct a climate envelope that will describe annual external conditions”. In other words, these two tools do not provide any feedback on the environmental performance of enclosed spaces and/or buildings. The serious problem is that the two aforementioned tools are being used by architects and architecture students while unaware of their inherent limitations. If design of buildings relies only on the results of these two tools, design will go in the wrong direction. That is why a new tool is needed to replace those two tools and to solve this problem. The LoadRepresentative Temperature-Difference method (ΔTLR) is developed to do just that.
4. THE LOAD-REPRESENTATIVE TEMPERATURE-DIFFERNCE METHOD (ΔTLR) 4.1 Objective & means The primary objective of the ΔTLR method is to provide a meaningful and accurate feedback on the environmental performance of architectural spaces early in the design phase in order to guide the decision making process towards thermal loads reduction. Another primary objective is to develop a third generation design assisting tool according to the description in section 2 in this paper. The means to generate accurate meaningful feedback on environmental performance is through taking into account all factors that may impact that performance, which are:
Figure 1: Annual climate envelope [6].
a. Outdoor climatic conditions in one year cycle. b. Envelope design of the building or space. c. Major load-generating factors, including climate, and internal and solar heat gains. 4.2 Development of the ΔTLR method The underlying concept of the ΔTLR method is to convert space loads into an imaginative temperature difference (between indoor & outdoor) that has an equal thermal impact on the environmental performance of a given space. This imaginative temperature difference is called: Load-Representative Temperature-Difference (ΔTLR). The Balance Point equation is used to convert space loads into an imaginative temperature difference.
Figure 2: The building bioclimatic chart for Minneapolis, MN. Daily Max. & Min. points plotted for an entire year [7]. 3.3 The problem Both aforementioned tools define the percentile need for different passive systems and/or strategies in a certain climate, which is useful information early in the pre-design analysis phase. However, because this analysis is based only on two of the ambient climatic variables, i.e., dry bulb temperature and moisture content, the results are only valid in the case in which a person is under a tree shade or a tent. In “The Energy Design Handbook”, published by the American Institute of Architects (AIA), 1993, Watson
4.2.1 Balance Point equation The space balance point temperature is the outdoor air temperature at which the space’s heat gain equals its heat loss. Thus, it is “the outdoor air temperature required for the space to be comfortable without the need for any mechanical heating or cooling” [8]. The building’s balance point, at a given hour, is obtained by using equation 1: T balance = T thermostat - (QIHG+QSOL / UENV) ... (1) Hence: QIHG = internal heat gain QSOL = solar heat gain UENV = heat transfer coefficient of the envelope
rd
PLEA2006 - The 23 Conference on Passive and Low Energy Architecture, Geneva, Switzerland, 6-8 September 2006
What is unique about the balance point temperature as a bioclimatic design indicator is that it takes into account all of the load-generating variables that influence the environmental performance of a given space. It takes into account the space’s physical reality, i.e., form, orientation, solar exposure, and heat transfer coefficients of envelope materials, as well as, the building use and occupancy patterns in terms of internal heat gains. That is why it is an accurate tool, which can be used to quantify the energy flows that occur within a given space as well as between the space and the outdoor environment. In equation (1): Internal heat gain is the hourly heat gain from people, lights, and equipment. Solar heat gain is due to area and orientation of windows as well as hourly solar intensity. Heat transfer coefficient of envelope is due to area and materials of exterior walls and due to hourly ventilation requirements. 4.2.2 Load-Representative ΔT Because the Balance Point Temperature (Tbalance) is an imaginative outside temperature at which the space is not in need to any mechanical heating or cooling, when the balance point is compared to the real Outside Temperature (Toutside) at the same hour, the temperature difference indicates the relative need for heating and cooling at this hour. This temperature difference is what this paper calls: LoadRepresentative Temperature-Difference (ΔTLR). Figure 3 shows a graphical comparison between the Outside Temperature and the Balance Point Temperature of a space in Salem, Oregon, USA, in the four seasons [9]. In the figure, the light shaded areas indicate the need for cooling, and the dark shaded areas indicate the need for heating. An energy-conscious design of an architectural space should try to minimise these shaded areas on the chart below. It is a user-friendly tool that fits the use of architects.
Equation 2 gives a positive value with net heat gain (cooling is required) and gives a negative value with net heat loss (heating is required). 4.2.3 Load-Representative Temperature (TLR) In order to replace the two afore-mentioned methods (shown in figures 1 & 2), with a new method that takes into account all space load-generating variables, the final step in the ΔTLR method is to calculate the LR-Temperature (TLR) and plot it on the Psychrometric Chart. The TLR can be obtained by using equation 3. In equation 3, if the Load Representative Temperature Difference (ΔTLR) = zero, then TLR = Tthermostat, i.e., no thermal loads, and no need for mechanical cooling nor heating. TLR = (Tthermostat + ΔTLR) … (3) The Load-Representative Temperature when plotted on the Psychrometric Chart it; represents outdoor conditions that affect the environmental performance of spaces and not ambient conditions that affect human comfort. Figure 4 (a & b) shows a comparison between the distribution of ambient conditions and Load Representative Temperatures in one year for a certain architectural space.
The ΔTLR, at the same hour, can be obtained by using equation 2: ΔTLR = (Toutside - Tbalance) ... (2)
Figure 3: Heating and cooling patterns for a space in Salem, OR, USA [9].
Figure 4a: Distribution of ambient conditions [10].
Figure 4b: Distribution of LR Temperature for a certain enclosed (perimeter) space [10].
rd
PLEA2006 - The 23 Conference on Passive and Low Energy Architecture, Geneva, Switzerland, 6-8 September 2006
In Figures 4a & 4b, annual hourly data is plotted on the Sychrometric chart. In each figure, one full year is represented by 144 points; twelve points per month. Each month is represented by bihourly readings of its 21st day. Based on visual comparison between the two figures, the hourly representation of ambient conditions (Fig. 4a) suggests a temperate climate in which the temperature readings are evenly distributed on both sides of the comfort zone, i.e., almost equal need for heating and cooling. However, after internal and solar loads are taken into consideration in a form of equivalent ΔT, the hourly TLR values (Fig. 4b) suggest a much higher need for cooling than heating, since all hourly values experienced a significant shift towards the cooling side of the chart; with about half the morning hours now outside of the working areas of natural ventilation and direct evaporative cooling. The comparison between figures 4a & 4b provides evidence on the valuable benefit from using the ΔTLR method to perform environmental performance analysis of spaces during early design phases. ΔTLR method gives accurate results. Both figures 4a & 4b were generated by the author as part of an environmental study for an office building in Cairo, Egypt. 4.3 A Case study Figure 5 shows the improvement of environmental performance of a single space as guided by the ΔTLR method. The given space is a single classroom facing due south in the City of Tulsa, Oklahoma, USA. This analysis is performed for the Fall season, as represented by the 21st day of October.
A
Daily Toutside range
Daily TLR range
B
C
Figure 5: Design development of a space as guided by the LRTD method.
In this example, solution (A) is the initial design of the space, which resulted in a high need for cooling. In solution (B), larger windows with deep overhangs were used, which resulted in cooling load reduction due to increased heat loss through glass and lower solar heat gain because of the deep overhang. A further development took place. In solution (C), the ventilation system in the space bypassed the Heat Recovery unit (HR), which resulted in further space load reduction. Because October outside temperature in Tulsa is lower than the thermostat temperature, bypassing the heat recovery unit improved the environmental performance of the space. In this case study, the ΔTLR method proved to be instrumental in providing meaningful guidance to the design development of the given space. Graphic representation of the results made it easy for the designer to examine the impact of his design decisions.
5. CONCLUSION In conclusion, because the ΔTLR method takes into account major variables that may affect the environmental performance of spaces, and is capable of guiding the design development of spaces, it should replace its predecessor tools as a third generation design-assisting tool.
REFERENCES [1] K. Mansy, The Need for a Third Generation of th Design Tools in the Early Design Phases, Proc. 20 Conference on Passive and Low Energy Architecture, Santiago - Chile (2003), F30. [2] J. Jones, Method of Systematic Design, in N. Cross (ed.), Developments in Design Methodology, (1984), pp. 11-29. [3] N. Cross (ed.), Developments in Design Methodology, (1984), p. 4. [4] K. Mansy, The Need for a Third Generation of Design Tools in the Early Design Phases, Proc. 20th Conference on Passive and Low Energy Architecture, Santiago - Chile (2003), F30. [5] D. Watson, The Energy Design Handbook, The American Institute of Architects Press, Washington D.C. (1993), pp. 23-25. [6] P. Guthrie, The Architect’s Portable Handbook, 2nd Edition, McGraw Hill, New York (1998), p. 143. [7] D. Watson and M. Milne, Bioclimatic Design, in D. Watson (ed.) Time Saver Standards for Architectural th Design Data, 7 Edition, McGraw Hill, New York (1997), pp. 21-34. [8] G. Z. Brown, et al., Sun, Wind, and Light, Architectural Design Strategies, John Wiley & Sons, New York (1985). [9] Ibid. [10] K. Mansy, et al., Customised Operation Profiles based on Hourly Load-Representative Temperature Difference, a model for incorporating climate-induced decision making into building environmental systems design, Proc. 17th Conf. on Passive and Low Energy Architecture, Cambridge, UK (2000), pp. 759-764.