energies Article
Load Signature Formulation for Non-Intrusive Load Monitoring Based on Current Measurements Aggelos S. Bouhouras 1 , Paschalis A. Gkaidatzis 2 , Konstantinos C. Chatzisavvas 1,3 , Evangelos Panagiotou 1 , Nikolaos Poulakis 1 and Georgios C. Christoforidis 1, * 1
2 3
*
Electrical Power Laboratory, Department of Electrical Engineering, Western Macedonia University of Applied Sciences, 50100 Kozani, Greece;
[email protected] (A.S.B.);
[email protected] (K.C.C.);
[email protected] (E.P.);
[email protected] (N.P.) Power Systems Laboratory, Department of Electrical and Computer Engineering, Aristotle University of Thessaloniki, 54124 Thessaloniki, Greece;
[email protected] mSensis S.A., VEPE Technopolis, Bld. C2, P.O. Box 60756, 57001 Thessaloniki, Greece Correspondence:
[email protected]; Tel.: +30-24610-68141
Academic Editor: Rodolfo Araneo Received: 14 February 2017; Accepted: 10 April 2017; Published: 16 April 2017
Abstract: In this paper we present a new methodology for the formulation of efficient load signatures towards the implementation of a near-real time Non-Intrusive Load Monitoring (NILM) approach. The purpose of this work relies on defining representative current values regarding the 1st, 3rd and 5th harmonic orders to be utilized in the load signatures formulation. A measurement setup has been developed and steady-state measurements have been performed in a Low Voltage residence. A data processing methodology is proposed aiming to depict representative current values for each harmonic order in order to keep the load signature short and simple. In addition, a simple disaggregation scheme is proposed under linear equations for the disaggregation mode in order to examine the near-real time application of the methodology. The analysis indicates that the developed load signatures could be efficient for a per second application rate of the NILM algorithm. The results show that the higher harmonic currents facilitate the identification performance. Finally, the analysis concludes that for combinations that include appliances with intense harmonic content, the phase angle of the higher for harmonic currents should also be considered to the load signatures formulation. Keywords: NILM; load signatures; load identification; odd harmonic currents
1. Introduction The Smart Grid Concept (SGC) relies basically on advanced metering capabilities regarding the real or near real time recording of the grid’s operational characteristics, and on upgraded automation concerning immediate switching operations [1,2]. The Smart Home paradigm is expected to constitute the core of the SGC in Low Voltage (LV) networks and is likely to be implemented via the installation of Smart Meters with upgraded metering features, and advanced data acquisition and analysis tools. Smart Meters are expected to provide detailed measurements of the energy consumption of each residence in order to promote Demand Side Management (DSM) actions towards energy efficiency strategic plans [3]. Moreover, in order to facilitate consumers to understand their consumption behavior and to analyze its dependency on specific consumption patterns, further functional capabilities are investigated to be embedded in Smart Meters. These capabilities refer to Load Identification (LI) functions that aim to provide information about the identity of the turned-on appliance, its working duration, and its consumption [4]. Such information is highly appreciated by both the consumers and the aggregator (e.g., Distribution Network Operator) since it could support (a) the consumers to understand their consumption behavior and possibly alter it in order to reduce their electricity cost, Energies 2017, 10, 538; doi:10.3390/en10040538
www.mdpi.com/journal/energies
Energies 2017, 10, 538
2 of 21
and (b) the aggregator to launch DSM programs that provide incentives towards energy efficiency, peak shaving, peak shifting and more. LI is based on the notion that the consumption/working behavior of each appliance could be described under a unique and distinct formulation, which embeds information about all features related to the appliance’s operational/electrical attributes. This formulation is commonly known as Load Signature (LS). In practice, LS constitutes a suitably configured data structure that describes concisely the behavior of the load during its operation. The early attempts for LI involved either installing sensors on every appliance or an intermediate monitoring system that recorded its operation [5]. Generally, this Intrusive Load Monitoring (ILM) method is inconvenient due to its high cost for large scale implementations. A simpler methodology, namely the Non-Intrusive Load Monitoring (NILM), was proposed in the early 1990s [6]. The advantage of NILM is that it requires only one power meter for the monitoring and identification of the plugged appliances, installed at the main feeding panel. The challenge, though, in NILM methodologies lies on the LI efficiency, since the recorded and measured signal is actually an aggregated one that embeds the information from all simultaneously working appliances. The efficient disaggregation of this signal into its components depends greatly on the formulation of unique and distinct LSs. In case of simultaneous operation of two or more appliances, LI involves finding an appropriate combination of the individual LSs of the active appliances. Therefore, the higher the uniqueness of these load signatures the easier the identification procedure. Many NILM methodologies have been proposed to deal with the development of both efficient LSs and LI approaches. The overall efficiency of a NILM algorithm is heavily dependent on the complexity and size of the LS, which in turn depends on the selection of the appliances’ features [7–11]. Most of the published methodologies utilize features like the active and reactive power, current and voltage harmonics, transient behavior particularly during the activation, current waveform characteristics, and techniques based on V-I trajectory [12–16]. For example in [17] the analysis utilizes the transient response time and transient energy on the power signatures. These features are obtained via a discrete wavelet transform as it has been considered more suitable than the short-time Fourier transform. In all aforementioned methodologies the selected features are utilized either individually or combined, in order to enhance the efficiency of the LSs. One crucial aspect regarding the utilization of harmonics in NILM methodologies relies on how this information should be depicted and embedded in LSs. For example in [18] it has been found that the odd harmonic currents constitute efficient features for the load signature formulation. Thus, the question raised in this case refers to the highest order of odd harmonic currents to be utilized. Naturally, the more the harmonic currents depicted, the higher the uniqueness of the LS. On the other hand, a high complexity regarding the LS formulation could cause unacceptable computation burden for the disaggregation mode of the NILM algorithm. In this latter case, the identification accuracy could worsen at the expense of the algorithm’s implementation time. In [19] a NILM scheme is employed to identify special loads of a microgrid. Several Fast Fourier Transform (FFT) spectrum components are considered for the formulation of the LSs, while sub-harmonics and interharmonics are also examined due to the nature of the examined loads. The work in [20] presents a thorough survey about NILM methodologies, analyzing four load types. Type-I refers to appliances with only two states of operation (on/off). Type-II loads are multi-state appliances with a finite number of operational states and repeatable switching pattern. Type-III includes appliances with variable power draw characteristics, but without fixed number of operational states. Finally, Type-IV involves appliances that remain active throughout weeks or days consuming energy at a constant rate. The analysis in [20] concludes that NILM methods under steady-state that utilize harmonic current have a relatively low accuracy for Type-III loads and for overlapping features for consumer electronics of Type-I and Type-II category. The consideration of harmonic currents has been proven to contribute in formulating more distinct LSs [21–23], but it has not been fully clarified how these harmonic features could be efficiently disaggregated in NILM algorithms under simultaneous operation of various appliances.
Energies 2017, 10, 538
3 of 21
In [24] an approach of multi point sensing and group control in NILM techniques is presented. The technique used the first 8 harmonic of the current signature for the classification with neural network classifier and Bayes classifier demonstrating a recognition accuracy of up to 99.18%. Although high identification accuracy is performed, the proposed technique depends on large data since 8 harmonic orders are utilized. In [25] a low cost NILM approach is proposed. The basic utilized data for the LS formulation concern the peak current values. The performance of this approach is significantly decreased when more than three appliances are operating simultaneously. In [26] the LSs are formulated based on harmonic currents up to the 15th order. Moreover, the phase of each order is also measured and the total rms current is also utilized. These aforementioned data have been acquired under a high sampling frequency via an expensive measurement device. Finally, in [27] an interesting approach is presented. The methodology utilizes a Data Acquisition (DAQ) card to measure rms current values and as stated by the authors, an unknown appliance can be identified according to the following metrics: (a) Similarity of magnitude arrays of the consumed current level, (b) Similarity of standard distribution array of the consumed current level and (c) Operation time and duration of each appliance type. In this paper, we examine the contribution of the Odd-Order Harmonic Currents (OOHC) towards the enhancement of LSs that are formed only by the amplitude of the currents at the fundamental frequency (i.e., 50 Hz) and at 3rd and 5th harmonic orders (i.e., 150 Hz and 250 Hz respectively) for each appliance. For this investigation, we have obtained measurements from a different mix of appliances inside a residence with a single phase installation. Each appliance was measured under stand-alone operation in order to develop the LS database of the residence. These measurements concern the instantaneous current at the main feeding panel of the residence. Then the measured current is processed (FFT application) and the amplitudes of the 1st, 3rd and 5th harmonic orders are calculated. Based on these latter values the load signatures and the load identification (disaggregation scheme is performed). In addition, we have realized scenarios regarding the simultaneous operation of appliance combinations, in order to examine whether the efficient decomposition of aggregated signals is possible for successful LI. The main aim of this analysis is to highlight the contribution of the OOHC to the development of more distinct LSs especially for nonlinear LV loads and, in turn, to facilitate the recognition of these appliances. Moreover, this work intends to examine if LSs consisting only of harmonic current amplitudes up to the 5th order can be used to reliably decompose an aggregated signal. In such case, we assess the performance of the identification procedure by determining the magnitude of the recognition error. The rest of the paper is organized as follows: Section 2 provides all information about the measurement setup and the performed measurements. Moreover, the proposed methodology for the LS formulation is explained and the LSs for the test case in this work are presented. In Section 3 a NILM approach for near-real time load identification is analyzed and various scenarios regarding simultaneous operation of appliances to be identified are presented. Recommendations and suggestions for further improvements are commented. Finally, Section 4 is devoted to conclusions. 2. Measurements and Load Signature Formulation In this section the measurement setup is analyzed and all relevant information about the performed measurements are provided. Moreover, the proposed methodology about the LS formulation is explained and the formed LS database is presented. 2.1. Measurement Setup The measurement setup consists of a common AC current probe (LEM PR630, measuring range ±60 A with accuracy ±1%, DC to 20 kHz frequency range) and a voltage optoisolated transducer (measuring range ±600 V). The outputs of the voltage transducer and current probe (transfer coefficients 5 V/600 V and 10 mV/A, respectively) were acquired using a data acquisition card (DAQ card, NI PXI-6123). Sampling rate was set at 50,000 samples/s. Voltage and current waveforms
Energies 2017, 10, 538
4 of 21
captured by the DAQ card contained 50,000 samples each corresponding to an acquisition period of 1 s or 50 periods of the fundamental frequency of the power line. Current acquisition was configured to be in synchronization to the voltage waveform. Acquired analog current waveform was processed and further FFT (Fast Fourier Transform) analyzed in real time by means of an application developed in LabVIEW graphical programming language. FFT analysis revealed the amplitudes and frequencies of current fundamental and harmonic components (current power spectrum). The frequency interval df of the power spectrum resulted from FFT analysis, i.e., the minimum frequency difference between successive harmonic components of the signal, is given by df = r/n, where, r is the sampling rate (50,000 samples/s) and n is the number of samples contained in each analyzed waveform (5000 samples). Taking into account the above acquisition parameters, the frequency interval of the current power spectrum, presented in this work, is 1 Hz. The recording frequency of the measured data was set to 1 Hz (1 sample/s). Low-pass filter is intrinsic to the Fast Fourier Transform (FFT) algorithm to comply with Nyquist’s theorem. As a sampling rate of 50 kSamples/s was used for the acquisition of current in this work, a low-pass filter with a cut-off frequency set at 25 kHz was applied to acquired waveforms (Nyquist theorem). The FFT analysis applied to the filtered current signal in the frequency range dc—25 kHz revealed a power spectrum consisting of a normal array of peaks at fundamental (50 Hz) and higher harmonics (150 Hz, 250 Hz, . . . ) with diminishing amplitudes as frequency increases with no intermediate peaks and an almost negligible white noise amplitude. A measure of the white noise contribution to the variation of the observed harmonics amplitude is given by the measured standard deviation of the peak amplitudes and its interpretation and handling lies within the subjects of this work. 2.2. Measured Appliances All measurements have been carried out in a residence with a single-phase installation, using various appliances. The installed nominal capacity of the residence is 25 kVA. The measurements involved (a) the stand-alone operation of each appliance so as to capture its own and unique operational characteristics for the development of its LS, and (b) various scenarios with simultaneous operation of appliance combinations. The recorded data were the amplitudes of the currents at 50 Hz, 150 Hz and 250 Hz, i.e., the fundamental current, 3rd and 5th harmonic currents respectively. Prior to any measurement, we measured the background in order to identify the harmonic content at the main feeding panel. This has been found to be in the order of 10−2 regarding both the 3rd and 5th order harmonic currents. The first aim of this work is to investigate whether specific harmonic current amplitudes (fundamental, 3rd and 5th) can formulate efficient LSs. This will result in less computation effort for the data processing and the identification procedure, and lower cost for the measurement setup. The second aim is to examine the potential for real time matching of aggregated individual LSs with the input signal for load identification. Table 1 lists the examined appliances along with the appliance combinations measured for this residence. It is clarified that each appliance has been measured individually in order to form its LS and the load combinations have been measured in order to test the efficiency of the disaggregation scheme in this work. Table 1. Measured appliances and appliance combinations for the examined residence. Measured Appliances PC TV
Hair-dryer (hot) Resistive-heater
Coffee-maker Toaster
Vacuum Refrigerator
Electric iron Blender
Measured Appliance Combinations 1 2 3 4
Hair-dryer (hot) Coffee-maker Coffee-maker PC
Vacuum Electric iron Toaster Electric iron
Resistive-heater Resistive-heater Refrigerator TV
Toaster Blender Resistive-heater
Energies 2017, 10, 538
5 of 21
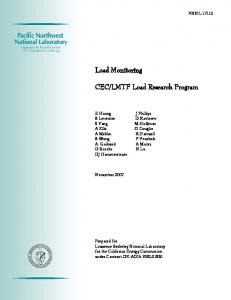
Energies 2017, 10, 538 5 of 21 One of the greatest challenges in NILM methodologies is to ensure that the LSs would be robust and distinct under the simplest possible formulation and the fewest possible operational One of the greatest challenges in NILM methodologies is to ensure that the LSs would be robust features the appliances. Obviously, if formulation the LS of an many operational and of distinct under the simplest possible andappliance the fewest consist possibleof operational features of and electrical characteristics it would beLS distinct such aoperational choice yields the appliances. Obviously, if the of an enough. appliance However, consist of many and complex electrical LSs it would be distinctcomputational enough. However, such aAnother choice yields complex LSs withappliances large with characteristics large databases and increased burden. difficulty concerns databasesoperational and increased computational concerns appliances with various with various states/modes forburden. which Another most of difficulty the utilized operational features in their LSs operational states/modes for whichthese mostalterations of the utilized operational features in their follow under these the follow these alterations. Naturally, and/or variations would beLSs present alterations. Naturally, these alterations and/or variations would be present under the operation of such operation of load combinations and could affect the identification performance. Therefore, in load combinations and could affect the identification performance. Therefore, in such cases the cases the question raised concerns the capability for the consideration of these variations in the LSs. question raised concerns the capability for the consideration of these variations in the LSs. In this In this work such an attempt is investigated under the consideration of discrete values that could be work such an attempt is investigated under the consideration of discrete values that could be representative for the different operational willbe beexplained explained in detail in next the next section. representative for the different operationalmodes modes and and will in detail in the section. Figures 1a–c and 2a–c show the recorded current amplitudes at 50 Hz, 150 Hz and 250 Hz for the Figures 1a–c and 2a–c show the recorded current amplitudes at 50 Hz, 150 Hz and 250 Hz for the laptop and the vacuum appliances. laptop and the vacuum appliances.
Current amlitude [A]
0.7 0.6 0.5 0.4 0.3 0.2 0.1 0.0 0
50
100
150
200
250
300
sec recorded current amplitude at 50 Hz
Current amplitude [A]
(a) 0.45 0.40 0.35 0.30 0.25 0.20 0.15 0.10 0.05 0.00 0
50
100
150
200
sec recorded current amplitude at 150 Hz (b) Figure 1. Cont.
250
300
Energies 2017, 10, 538
6 of 21 6 of 21
Energies 2017, 10, 538
6 of 21
Current amplitude [A] [A] Current amplitude
Energies 2017, 10, 538
0.18 0.16 0.18 0.14 0.16 0.12 0.14 0.10 0.12 0.08 0.10 0.06 0.08 0.04 0.06 0.02 0.04 0.00 0.02 0 0.00 0
50
100
150
200
250
300
50
100
sec 150
200
250
300
sec recorded current amplitude at 250 Hz recorded current (c)amplitude at 250 Hz Figure 1. (a) Recorded current amplitudes for laptop appliance for 50 Hz; (b) Recorded current Figure 1. (a) Recorded current amplitudes for (c) laptop appliance for 50 Hz; (b) Recorded current amplitudes for laptop appliance for 150 Hz; (c) Recorded current amplitudes for laptop appliance for amplitudes for laptop appliance for 150 Hz; (c) Recorded current amplitudes for laptop appliance for Figure 250 Hz.1. (a) Recorded current amplitudes for laptop appliance for 50 Hz; (b) Recorded current 250 Hz. amplitudes for laptop appliance for 150 Hz; (c) Recorded current amplitudes for laptop appliance for
Current amlitude [A] [A] Current amlitude
250 TheHz. results for the laptop measurements constitute a representative example regarding appliances varied operational modes.constitute The appliance has been recorded forregarding 5 min (i.e., 300 The results with for the laptop measurements a representative example appliances Theunder results for the laptop measurements constitute a representative example regarding values a recording frequency of 1 sample/s). The laptop is a typical load with varied with varied operational modes. The appliance has been recorded for 5 min (i.e., 300 values under appliances with operational The appliance hastobeen recorded for 5 min (i.e., 300 consumption duevaried toofthe screen’s andmodes. processor’s adjustments thewith user’s preferences. It is highly a recording frequency 1 sample/s). The laptop is a typical load varied consumption due to values under a recording frequency of 1 sample/s). The laptop is a typical load with varied possible to capture additional variations under a higher recording frequency. One first observation the screen’s and processor’s adjustments to the user’s preferences. It is highly possible to capture consumption dueshare to the processor’s to the user’s preferences. It is highly is that all graphs anscreen’s identicaland pattern, which adjustments means that amplitude harmonics vary similarly at additional variations under a higher recording frequency. One first observation is that all graphs share possible to capture additional variations under a higher recording each operating mode. The most interesting observation, though, isfrequency. that thereOne are first two observation operational is that all graphs share an identical pattern, which means that amplitude harmonics vary similarly atmode. an identical pattern, which means that amplitude harmonics varyvariation similarly at each operating modes with different current amplitude values and significant range. There are two each operating mode. The most interesting observation, though, is that there are two operational The most interesting observation, though, is that there are two operational modes with different current concerns in this case: Firstly, a decision should be made about which of these operational modes modes with different amplitude and are significant variation range. are amplitude and significant variation range. two concerns in case:There Firstly, decision shouldvalues be utilized forcurrent the formulation ofvalues theThere laptop’s LS. Secondly, thethis identification ofa two this concerns in this case: Firstly, a decision should be made about which of these operational modes appliance can be hindered, asthese other operational appliances may fall within between the twoof the should be made about which of modes shouldthe bevariation utilized range for the formulation should bemodes. utilizedFinally, for the formulation of the LS. Secondly, the each identification of state this operation it should beof stated that laptop’s smoother during laptop’s LS. Secondly, the identification this appliance canvariations be hindered, as otheroperational appliances may fall appliance can be hindered, as other appliances may fall within the variation range between the two should also be considered duringthe thetwo LS formulation. within the variation range between operation modes. Finally, it should be stated that smoother operation modes. Finally, it should be stated that smoother variations during each operational state variations during each operational state should also be considered during the LS formulation. should also be considered during the LS formulation. 8.0
8.0 6.0 6.0 4.0 4.0 2.0 2.0 0.0 0.0
0
50
100
150
200
250
0
50
100
sec 150
200
250
sec recorded current amplitude at 50 Hz recorded current (a) amplitude at 50 Hz (a) Figure 2. Cont.
Energies 2017, 10, 538
7 of 21
Energies 2017, 10, 538
7 of 21
Current amplitude [A]
1.40 1.20 1.00 0.80 0.60 0.40 0.20 0.00 0
50
100
150
200
250
sec recorded current amplitude at 150 Hz (b)
Current amplitude [A]
0.25 0.20 0.15 0.10 0.05 0.00 0
50
100
150
200
250
sec recorded current amplitude at 250 Hz (c) Figure 2. (a) Recorded current amplitudes for vacuum appliance for 50 Hz; (b) Recorded current
Figure 2. (a) Recorded current amplitudes for vacuum appliance for 50 Hz; (b) Recorded current amplitudes for vacuum appliance for 150 Hz; (c) Recorded current amplitudes for vacuum appliance amplitudes for vacuum appliance for 150 Hz; (c) Recorded current amplitudes for vacuum appliance for 250 Hz. for 250 Hz.
In Figure 2a–c the recorded current values for the vacuum appliance are presented for the 3 examined In this case one operational mode that is relatively are constant with very In Figure frequencies. 2a–c the recorded current values for theexists vacuum appliance presented for the smooth variations. Thus, the LS could be formed based on few values for each frequency that would 3 examined frequencies. In this case one operational mode exists that is relatively constant with very be representative for the whole steady state operation period. smooth variations. Thus, the LS could be formed based on few values for each frequency that would be representative for the whole steady state operation period. 2.3. Load Signatures Formulation In the present work the formulation of the LSs relies on the utilization of the OOHCs and 2.3. Load Signatures Formulation specifically on the 1st, 3rd and 5th order harmonic currents. This facilitates the identification both of
In the present theanformulation the LSs on the utilization of consumption. the OOHCs and non-linear loadswork within aggregated of signal, and relies of appliances with similar specifically on the 1st, 3rd and 5th order harmonic currents. This facilitates the identification both of Therefore, the proposed LS formulation is as follows: non-linear loads within an aggregated signal, and of appliances with similar consumption. Therefore, a , I b , I c LS i = I 50 (1) the proposed LS formulation is as follows: i 150 i 250 i where:
where:
h h i i a b c LSi = [ I50i , [ I250i ], I150i ]
(1)
Energies 2017, 10, 538 Energies 2017, 10, 538
•• •• ••
8 of 21 8 of 21
LSii is the load signature signature of of appliance appliance i;i; LS indices 50, 150 and 250 represent the fundamental nominal andharmonic the 5th indices 50, 150 and 250 represent the fundamental nominal current,current, the 3rd the and 3rd the 5th harmonicrespectively; currents respectively; currents indices a ∈ N∗* and andb, bc ,∈ with number of values utilized for 1 and c ∈NNwith b , c0≥denote 0 denote indices a ∈ N a ≥a1≥and b, c ≥ the the number of values utilized for the respective partpart of the the respective of LS. the LS.
Current amplitude [A]
Indices a, a, bb and and cc express express the the number number of of representative representative current current values values that that have have been been utilized utilized for for Indices each harmonic order (1st, 3rd and 5th) in order to form the load signature of each appliance. These each harmonic order (1st, 3rd and 5th) in order to form the load signature of each appliance. These representative values values are are supposed supposed to to be be efficient efficient for for load load recognition recognition under under aggregated aggregated measured measured representative current values. For example, in Figure 3 the recorded values of the fundamental current for the the PC current values. For example, in Figure 3 the recorded values of the fundamental current for (desktop) appliance are presented in descending order. The values in Figure 3 refer to a typical PC (desktop) appliance are presented in descending order. The values in Figure 3 refer to a typical operation of of the the appliance appliance for for approximately approximately 55 min. min. operation 1.35 1.25 1.15 1.05 0.95 0.85 0.75 0
25 50 75 100 125 150 175 200 225 250 275 sec recorded current values for 50 Hz
Figure 3. Recorded current amplitudes for PC (desktop) appliance for 50 Hz. Figure 3. Recorded current amplitudes for PC (desktop) appliance for 50 Hz.
Based Based on on the the data data presented presented in in Figure Figure 33 the the variation variation range range of of the the fundamental fundamental current current for for this this appliance is [0.86–1.3] A. The following questions are raised in this case: appliance is [0.86–1.3] A. The following questions are raised in this case:
1. 1.
2. 2.
Which one of these values should be considered for the formulation of the first part of the the LS LS in in (1) since all of them describe describe the the operation operation of of this this appliance appliance under under steady-state? steady-state? A simple simple and and quick approach approachcould couldbebethe the mean value. problem is the thathigher the higher the variation mean value. TheThe problem herehere is that the variation range, range, less representative the mean would Thishinder could the greatly hinder of the the less the representative the mean value wouldvalue be. This couldbe. greatly performance a performance of a and NILM and accuracy the identification accuracy of the appliance. NILM algorithm thealgorithm identification of the appliance. If the the consideration consideration of single value value yields yields inefficient inefficient LS, LS, then then how how many many values values should should be be of a single utilized that the the operation operation of of the the appliance appliance is is captured captured in in most most of of the the possible possible utilized in in order order to to ensure ensure that operational operational modes? modes? Τhe The answer answer in in this this question question defines defines the the number number of of a, b and and c indices indices of of the the LS. LS.
In order to answer these questions the following methodology is proposed for the formulation In order to answer these questions the following methodology is proposed for the formulation of of each LS: each LS: 1. Each appliance is measured for a time period of 5 min under a recording frequency of 1 1. Each appliance is measured for a time period of 5 min under a recording frequency of 1 sample/s sample/s as described in Section 2.1. Therefore, a data series with approximately 300 current as described in Section 2.1. Therefore, a data series with approximately 300 current values for values for each harmonic order (i.e., at 50 Hz, 150 Hz and 250 Hz) for each appliance are stored each harmonic order (i.e., at 50 Hz, 150 Hz and 250 Hz) for each appliance are stored in the in the database. For most of the typical appliances in a residence the time period of 5 min can be database. For most of the typical appliances in a residence the time period of 5 min can be considered adequate, since it captures the typical residential usage. For those with multiple considered adequate, since it captures the typical residential usage. For those with multiple operational modes, e.g., washing machine, all of these different operational modes should be operational modes, e.g., washing machine, all of these different operational modes should be measured, for the LS formulation. measured, for the LS formulation. 2. The standard deviation (SD) for each appliance is computed: SD50, SD150 and SD250 respectively 2. for Thethe standard deviationfrequencies. (SD) for each appliance is computed: SD50 , SD150 and SD250 respectively three examined forthreshold the three examined frequencies. 3. A (th) is defined for each SD in order to identify if one or more values should be utilized for the formulation of the respective part of the LS.
Energies 2017, 10, 538
3. 4.
5.
9 of 21
A threshold (th) is defined for each SD in order to identify if one or more values should be utilized for the formulation of the respective part of the LS. This threshold is taken as follows: SD50(th) = SD150(th) = SD250(th) = 0.02. The value of the threshold (th) has been selected after several trials since this specific value has provided relatively short load signatures (i.e., with relatively few representative currents values) but efficient enough for Energies 2017, 10, 538 9 of 21 load identification in the disaggregation mode of the proposed methodology. This threshold value proposed asisthe upper limit regarding the data processing towards LSs formulation. 4. isThis threshold taken as follows: SD50(th) = SD150(th) = SD250(th) = 0.02. The value of the the threshold (th) has been selected after several trials since this specific value has provided relatively short For each appliance i the following rules are applied: load signatures (i.e., with relatively few representative currents values) but efficient enough for load identification in the disaggregation mode of the proposed methodology. This threshold a. If SD50i ≤ SD50(th) , then compute the mean value (µ50i ) for the data in this data series and value is proposed as the upper limit regarding the data processing towards the LSs formulate the first part of the LSi as follows: I50i = µ50i . Obviously in this case the value of formulation. a isappliance equal toi the 1, afollowing = 1. 5. index For each rules are applied:
b.
c. d.
e.
Ifa.SD50i > SD , then the data descending Afterwards, If SD 50i ≤50(th) SD50(th) , thenreorder computethe thedata meaninvalue (μ50i) series for the in data in this dataorder. series and divide top-down the part dataofin (ai =as1, . . . , z)I50inon-overlapping sequential data of groups in formulate the first thea LS follows: = μ50i. Obviously in this case the value a is equal 1, a each = 1. one SD50ia ≤ SD50(th) . orderindex to ensure thattofor b. If SD50i > SD50(th), then reorder the data in the data series in descending order. Afterwards, For each of these a groups, compute the mean value (µ50ia ). Formulate the first part of the divide top-down the data in a (a = 1, …, z) non-overlapping sequential data groups in order LSi astofollows: I50ifor=each µ50iaone , . .SD . , 50ia µ50iz . 50(th). ensure that ≤ SD Apply 5a–5c the data series Hz(μ50ia and 250 Hz the respectively under the c. Forsteps each of these atogroups, compute the for mean150 value ). Formulate first part of the LSi as follows: = μ50ia, …, μthat 50iz. corresponding SDI50ithreshold is defined in step 4. This obtains the values of indices steps 5a–5c to the data series for 150 Hz and 250 Hz respectively under the b d. andApply c. corresponding SD threshold that is defined in step 4. This obtains the values of indices b Store and the c.formulated LSs for the i appliances and form the LS database for this residence. e.
Store the formulated LSs for the i appliances and form the LS database for this residence.
This procedure is summarized in the LS formulation flowchart of Figure 4. This procedure is summarized in the LS formulation flowchart of Figure 4. START
Activation of individual appliance i (recording frequency 1sample/sec)
Apply FFT to measured values (sampling frequency 50,000 samples/ sec) Current amplitudes for 50 Hz, 150 Hz and 250 Hz are computed.
Data acquisition under a recording frequency of 1 value/sec 3 data sets – each set contains currents values of respective frequency
Exclude outliers from the 3 data sets (i.e null values which usually refer to appliances that are switched off by thermostats)
For the remaining values regarding the 1st data set (50 Hz) define a (a=1,…,n) data groups for which their standard deviation is lower than a predefined threshold: SD